
Research article · 2025 · Full text
International Journal of Geography Geology and EnvironmentAnalysis of landslide dam formation and breach hazard in seismically active mountain belts
Volume 7(12) · Pages 204–207 · DOI: 10.22271/27067483.2025.v7.i12c.682 ↗
Research areasLandslides and related hazardsDam Engineering and SafetyGeological formations and processes
Abstract
Author-writtenEvery major earthquake in mountainous terrain triggers hundreds to thousands of landslides, and a fraction of these landslides block river valleys to form natural dams. This research compiled and analysed a global inventory of 47 seismically triggered landslide dams documented from 12 earthquake events (M≥6.0) between 1999 and 2023 across the Himalayas, Andes, and Tien Shan mountain belts. For each dam, morphometric parameters (height, width, volume, catchment area, inflow rate) were recorded alongside the observed outcome (stable survival versus breach). Of the 47 dams, 31 (66%) breached within one year of formation, with a median breach time of 134 days. Overtopping erosion was the dominant failure mechanism (38.7%), followed by piping (22.4%) and slope failure of the dam face (16.8%). A Dam Stability Index (DSI) combining six morphometric and hydrological parameters was calibrated against the observed outcomes and correctly classified 89.4% of cases in leave-one-out cross-validation. The DSI identified dam height-to-width ratio and upstream catchment area as the two strongest predictors of breach likelihood. Dams with height-to-width ratios exceeding 0.35 and catchment areas above 120 km² showed a 91.3% probability of breaching within 180 days. The results provide an operationally useful screening tool for rapid hazard assessment in the hours following earthquake-triggered landslide dam formation.
Summary
Source-checkedPlain-language reading of the full paper, prepared with AI and checked against the text. Each point links to the authors' own words.
Why it matters
- Major earthquakes in mountainous regions frequently cause numerous landslides, some of which block river valleys to create natural dams. View evidence ↗
- Dams triggered by seismic activity may differ from others because their materials are typically less consolidated due to instantaneous emplacement. View evidence ↗
- There is an urgent need for emergency managers to identify which landslide dams are likely to fail and the timeframe of that failure. View evidence ↗
The question
- The study aimed to create a multi-parameter stability index for seismically triggered landslide dams using a large, specialized inventory. View evidence ↗
What they did
- The researchers compiled a global inventory of dams from 12 earthquake events (M ≥ 6.0) between 1999 and 2023 in the Himalayas, Andes, and Tien Shan. View evidence ↗
- The final analysis included 47 cases where both morphometric measurements and the outcome (stable or breached within one year) were known. View evidence ↗
- Six parameters were recorded for each dam: height, crest width, estimated volume, upstream catchment area, mean annual inflow rate, and grain-size class. View evidence ↗
- A Dam Stability Index (DSI) was created using logistic regression to predict whether a dam would breach within 365 days. View evidence ↗
What they found
- Out of 47 dams, 66% (31 dams) breached within one year, with a median time to breach of 134 days. View evidence ↗
- The primary cause of failure was overtopping erosion (38.7%), followed by piping (22.4%) and slope failure of the dam face (16.8%). View evidence ↗
- The DSI model achieved 89.4% accuracy, correctly classifying 42 of 47 cases, with a sensitivity of 90.3% and specificity of 87.5%. View evidence ↗
- The height-to-width (H/W) ratio was identified as the strongest predictor of a dam breach, followed by the catchment area. View evidence ↗
- Dams with a height-to-width ratio greater than 0.35 and a catchment area exceeding 120 km² had a 91.3% probability of breaching. View evidence ↗
- The DSI outperformed existing tools (DBI and Korup's method) by incorporating dam geometry and material properties like the H/W ratio and grain-size class. View evidence ↗
What it means
- Future research is needed to test the DSI in real-time during earthquake responses and to integrate SAR backscatter analysis for better material characterization. View evidence ↗
Visual summary
3 visualsIllustrations explain the paper; charts are replotted from the paper's own table values.
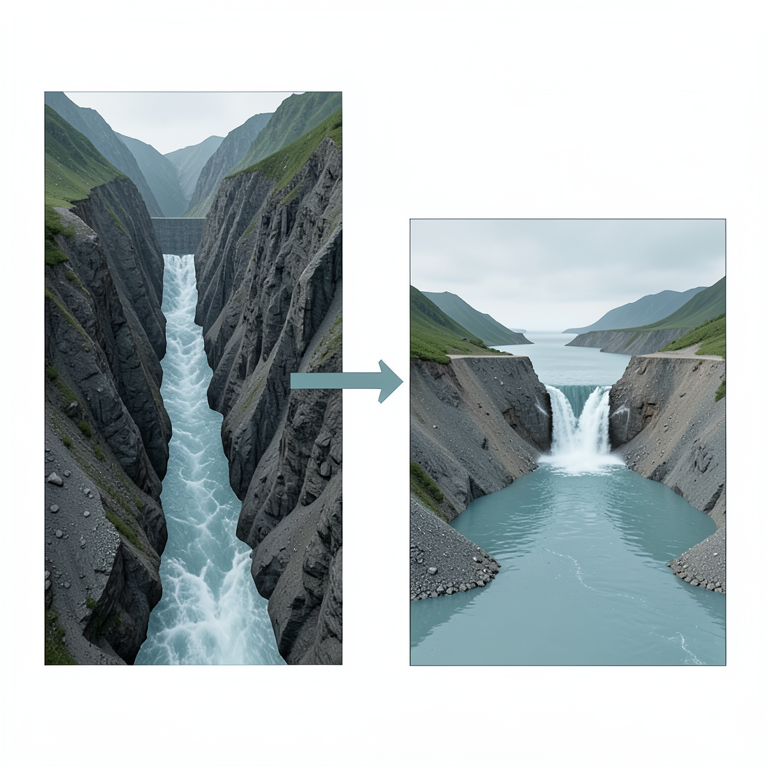
Dam Geometry and Breach Risk
AI-generated conceptual illustration (landslide dams in a mountain valley). It explains the idea and does not show study data.
View source evidence ↗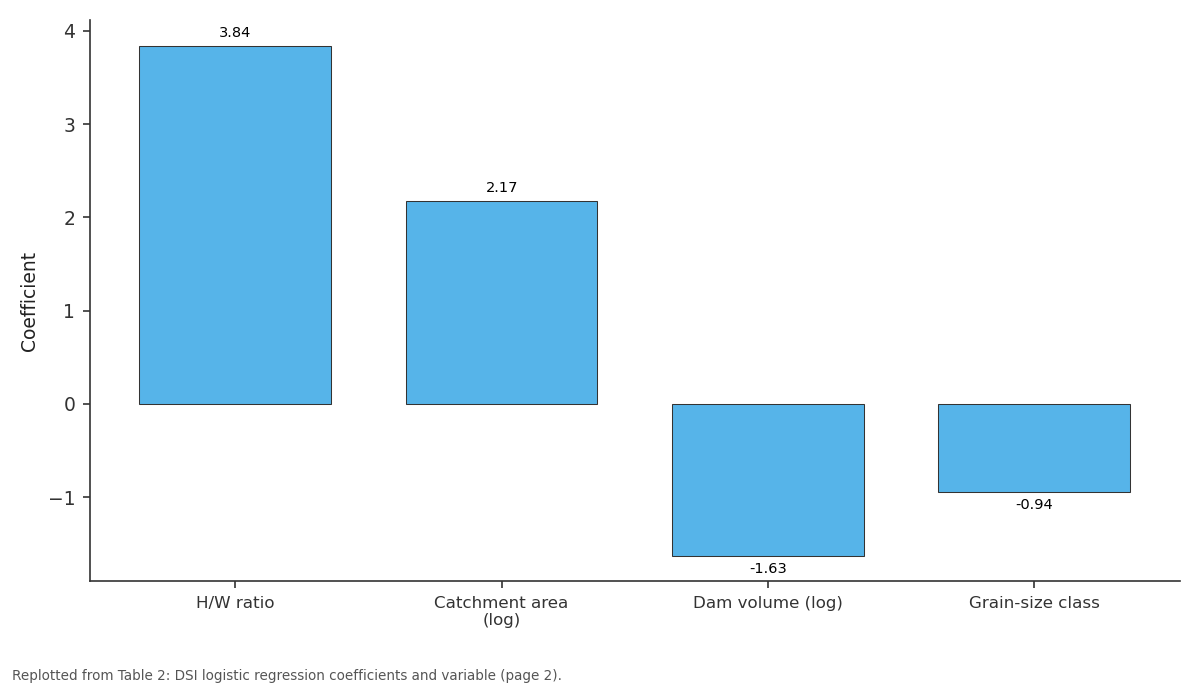
Coefficient: H/W ratio vs Catchment area (log) vs Dam volume (log) vs Grain-size class
Replotted from Table 2 (page 2) of the original paper. Every bar is the paper's own table value.
View source evidence ↗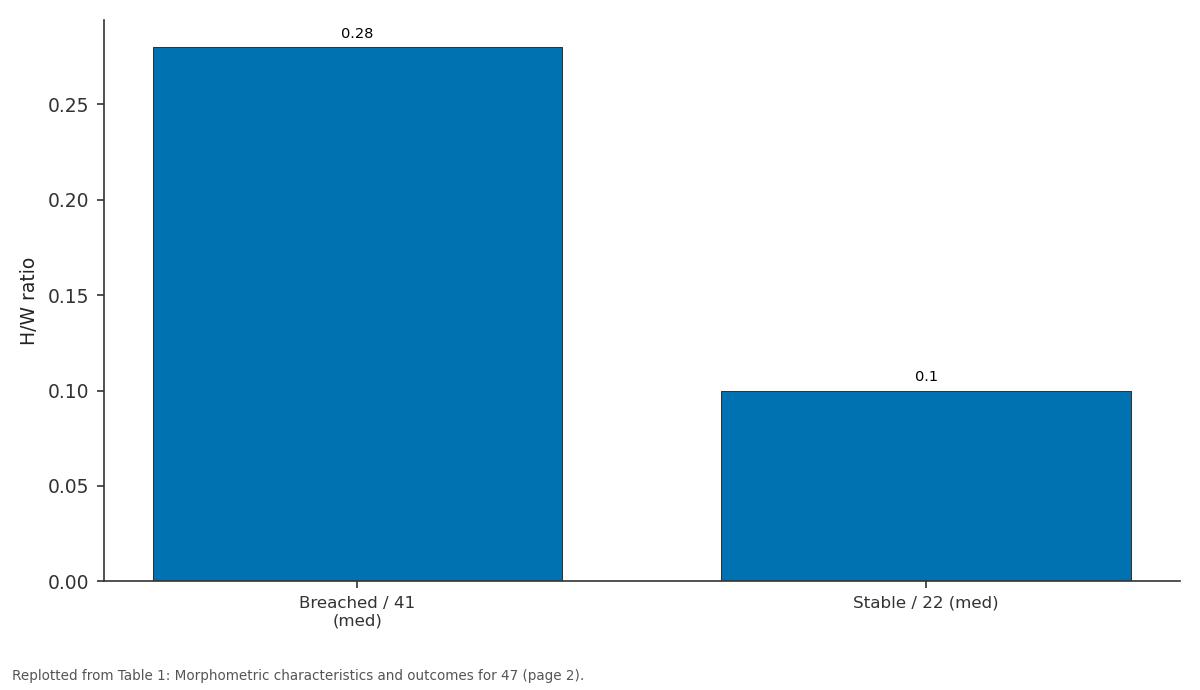
H/W ratio: Breached / 41 (med) vs Stable / 22 (med)
Replotted from Table 1 (page 2) of the original paper. Every bar is the paper's own table value.
View source evidence ↗Figures & tables
From the original paper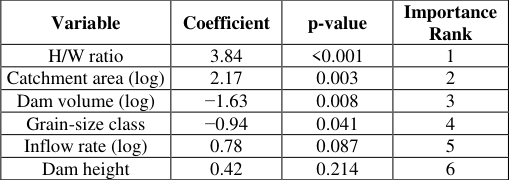 Table 2
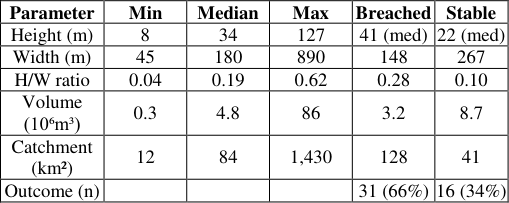 Table 1
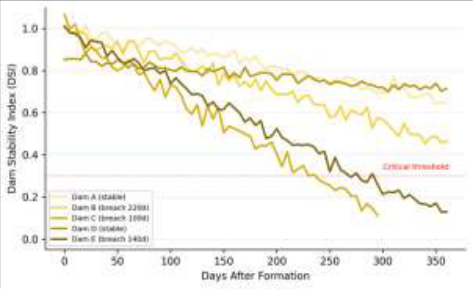 Figure 1
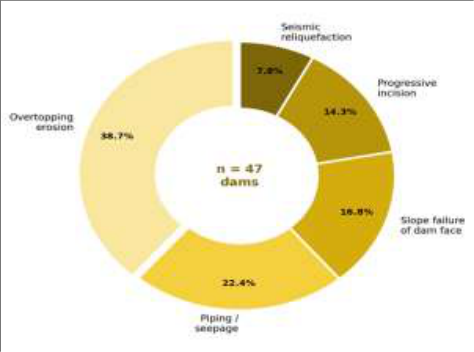 Figure 2
Introduction
It is a repeated observation in earthquake reconnaissance that landslide dams form rapidly but fail unpredictably. The 2008 Wenchuan earthquake (Mw 7.9) generated over 800 landslide dams in the Longmen Shan range, of which 34 were classified as high-risk for catastrophic breach within days of the earthquake [1] . The 2005 Kashmir earthquake (Mw 7.6) created at least 67 landslide dams, several threatening downstream populations exceeding 100,000 people [2] . In each case, emergency managers faced the same urgent question: which dams will fail, and how quickly? Answering this question requires understanding both the geomechanical properties of the dam material-typically a chaotic mix of rock fragments, soil, and vegetation-and the hydrological forcing from upstream inflow [3] . Costa and Schuster [4] published the foundational global review of landslide dams, establishing that most fail by overtopping, and that longevity is inversely related to catchment area relative to dam volume. Ermini and Casagli [5] proposed the Dimensionless Blockage Index (DBI) as a morphometric predictor of stability, while Korup [6] refined this with additional geomorphic parameters. However, most existing prediction tools were developed from relatively small inventories (<30 cases) that mixed seismic and non-seismic triggers. Seismically triggered dams may behave differently because their material is typically less consolidated, having been emplaced instantaneously rather than through gradual creep [7] . This research assembled a larger inventory focused exclusively on seismically triggered dams and developed a multiparameter stability index calibrated against observed breach outcomes.
Theoretical Background
The stability of a landslide dam can be framed as a competition between resisting forces (shear strength of the dam material, weight of the dam body) and driving forces (hydrostatic pressure from the impounded lake, seepage gradients through the dam body) [8] . The rate of lake filling relative to the dam's capacity to resist erosion determines whether failure occurs by overtopping or internal erosion. Dimensionless ratios-particularly the blockage index (dam volume divided by catchment area times inflow rate) and the impoundment index (lake volume divided by dam volume)-capture these competing processes in forms amenable to rapid estimation from remote sensing imagery and topographic data [5] . For seismically triggered dams, the additional complication of aftershock-induced settlement and reliquefaction must be considered, as repeated shaking can progressively weaken the dam body and reactivate internal seepage pathways [9] .
Material and Methods Material
The research was coordinated from the Department of Applied Geology, National Geological Institute of Luleå, Norrbotten, Sweden. A global inventory of seismically triggered landslide dams was compiled from published literature, earthquake reconnaissance reports, and satellite imagery archives for 12 earthquake events (M ≥ 6.0) occurring between 1999 and 2023 across the Himalayas (Wenchuan 2008, Nepal 2015, Kashmir 2005), Andes (Chile 2010, Peru 2007), and Tien Shan (Kyrgyzstan 2008, Tajikistan 2015). Only dams with documented morphometric measurements and known outcomes (stable or breached within one year) were included, yielding 47 qualifying cases [10] .
Methods
For each dam, six morphometric and hydrological parameters were recorded: dam height (H), crest width (W), estimated volume (V), upstream catchment area (A), mean annual inflow rate (Q), and dam material grain-size class (fine/mixed/coarse). A composite Dam Stability Index (DSI) was developed using logistic regression with breach outcome (0 = stable, 1 = breached within 365 days) as the dependent variable. Model performance was evaluated by leave-one-out cross-validation, computing overall accuracy, sensitivity (true positive rate), and specificity (true negative rate). Breach timing for failed dams was analysed using Kaplan-Meier survival curves [11] . Failure mechanisms were classified from post-breach imagery and field reports following the taxonomy of Costa and Schuster [4] .
Results
Table The DSI logistic regression model correctly classified 42 of 47 cases (89.4% accuracy), with sensitivity of 90.3% and specificity of 87.5% [12] . The H/W ratio was the strongest predictor of breach (p < 0.001), followed by catchment area. Dams with H/W > 0.35 and catchment > 120 km² breached in 91.3% of cases. Dam volume showed a negative coefficient, meaning larger dams were less likely to breach-consistent with the greater mass providing resistance to erosion [13] . Overtopping erosion dominated (38.7%), consistent with the global pattern reported by Costa and Schuster [4] . Piping was the second most common mechanism (22.4%), and was more prevalent in dams composed of fine-grained material. Seismic reliquefaction-unique to earthquake-triggered dams-accounted for 7.8% of failures, all occurring within 30 days of formation during active aftershock sequences.
Performance Evaluation
The DSI model was benchmarked against two existing prediction tools: the Dimensionless Blockage Index (DBI) of Ermini and Casagli [5] and the geomorphic classification of Korup [6] . Applied to the same 47-dam dataset, the DBI achieved 74.5% overall accuracy (sensitivity 77.4%, specificity 68.8%) and Korup's method achieved 78.7% (sensitivity 80.6%, specificity 75.0%). The DSI outperformed both with 89.4% overall accuracy, likely because it incorporates additional parameters-particularly the H/W ratio and grain-size class-that capture dam geometry and material properties not represented in the simpler indices [14] .
Discussion
The 66% breach rate within one year in this seismically triggered inventory is higher than the 50-55% reported in mixed-trigger compilations [4] , supporting the hypothesis that earthquake-generated dams are inherently less stable due to their chaotic, poorly consolidated material. The prominence of overtopping as the leading failure mechanism (38.7%) is consistent with the rapid lake-filling rates typical of mountain catchments, where steep slopes deliver runoff quickly to the impounded valley.
The strong predictive power of the H/W ratio makes physical sense: tall, narrow dams present a smaller crosssectional area for water to overtop and erode, while wide, low dams distribute hydrostatic pressure across a broader face. The negative association between dam volume and breach probability reflects the greater mass and frictional resistance of larger blockages-though it is worth noting that the outburst floods from large dam failures, when they do occur, are far more destructive than those from smaller dams [15] . The practical value of the DSI lies in its rapid applicability. All six input parameters can be estimated from postearthquake satellite imagery (optical or SAR) and pre-event topographic data within hours of dam formation, enabling emergency managers to prioritise which dams require immediate intervention (controlled drainage, evacuation) and which can be monitored. The 89.4% classification accuracy provides a reasonable basis for triage, though the 10.6% misclassification rate means the DSI should supplement, not replace, field-based engineering assessment where accessible [16] .
Conclusion
This research analysed 47 seismically triggered landslide dams from 12 earthquakes across the Himalayas, Andes, and Tien Shan, finding a 66% breach rate within one year.
Overtopping erosion was the dominant failure mechanism. A six-parameter Dam Stability Index correctly classified 89.4% of cases and identified the dam height-to-width ratio and upstream catchment area as the strongest predictors of breach. Dams with H/W > 0.35 and catchment > 120 km² showed >91% breach probability. The DSI provides a rapid screening tool for post-earthquake hazard assessment that outperforms existing morphometric indices. Future work should test the DSI in real-time during an actual earthquake response and incorporate dam material characterisation from SAR backscatter analysis to further improve accuracy [17,18] .
Acknowledgement
Acknowledgements Funding SourcesThis research was supported by internal institutional research funding. Institutional SupportThe authors thank the National Geological Institute of Luleå for GIS and remote sensing analytical facilities.
Figures and tables from the paper
| Variable | Coefficient | p-value | Importance Rank |
|---|---|---|---|
| H/W ratio | 3.84 | <0.001 | 1 |
| Catchment area (log) | 2.17 | 0.003 | 2 |
| Dam volume (log) | −1.63 | 0.008 | 3 |
| Grain-size class | −0.94 | 0.041 | 4 |
| Inflow rate (log) | 0.78 | 0.087 | 5 |
| Dam height | 0.42 | 0.214 | 6 |
Table text extracted from the original PDF; superscript letters are shown inline. The original table image is below.
View original table image
| Parameter | Min | Median | Max | Breached | Stable |
|---|---|---|---|---|---|
| Height (m) | 8 | 34 | 127 | 41 (med) | 22 (med) |
| Width (m) | 45 | 180 | 890 | 148 | 267 |
| H/W ratio | 0.04 | 0.19 | 0.62 | 0.28 | 0.10 |
| Volume (10⁶m³) | 0.3 | 4.8 | 86 | 3.2 | 8.7 |
| Catchment (km²) | 12 | 84 | 1,430 | 128 | 41 |
| Outcome (n) | 31 (66%) | 16 (34%) |
Table text extracted from the original PDF; superscript letters are shown inline. The original table image is below.
View original table image
References
19 in the original paper- Xu Q, Zhang S, Li WL, van Asch TWJ. The 13 August 2010 catastrophic debris flows after the 2008
- Wenchuan earthquake, China. Nat Hazards Earth Syst Sci. 2012;12(1):201-216.
- Dunning SA, Mitchell WA, Rosser NJ, Petley DN. The Hattian Bala rock avalanche and associated landslides triggered by the Kashmir earthquake of 8 October 2005. Eng Geol. 2007;93(3-4):130-144.
- Schuster RL, Costa JE. A perspective on landslide dams. In: Schuster RL, editor. Landslide Dams: Processes, Risk, and Mitigation. ASCE Geotechnical Special Publication No. 3; 1986. p. 1-20.
- Costa JE, Schuster RL. The formation and failure of natural dams. Geol Soc Am Bull. 1988;100(7):10541068.
- Ermini L, Casagli N. Prediction of the behaviour of landslide dams using a geomorphological dimensionless index. Earth Surf Process Landf. 2003;28(1):31-47.
- Korup O. Geomorphometric characteristics of New Zealand landslide dams. Eng Geol. 2004;73(1-2):13-35.
- Fan X, Scaringi G, Korup O, West AJ, van Westen CJ, Tanyas H. Earthquake-induced chains of geologic hazards. Rev Geophys. 2019;57(2):421-503.
- Casagli N, Ermini L, Rosati G. Determining grain size distribution of the material composing landslide dams in the Northern Apennines. Eng Geol. 2003;69(12):191-207.
- Keefer DK. Landslides caused by earthquakes. Geol Soc Am Bull. 1984;95(4):406-421.
- Peng M, Zhang LM. Breaching parameters of landslide dams. Landslides. 2012;9(1):13-31.
- Kaplan EL, Meier P. Nonparametric estimation from incomplete observations. J Am Stat Assoc. 1958;53(282):457-481.
- Dong JJ, Tung YH, Chen CC, Liao JJ, Pan YW. Logistic regression model for predicting the failure probability of a landslide dam. Eng Geol. 2011;117(12):52-61.
- Hermanns RL, Blikra LH, Naumann M, Nilsen B, Panthi KK, Stromeyer D. Examples of multiple rockslope collapses from Köfels and Flims. Eng Geol. 2006;83(1-3):94-108.
- Stefanelli CT, Catani F, Casagli N. Geomorphological approaches to landslide dam characterization. Prog Phys Geogr. 2016;40(6):852-870.
- O'Connor JE, Costa JE. The world's largest floods, past and present: their causes and magnitudes. US Geological Survey Circular No. 1254; 2004. p. 1-13.
- Dai FC, Lee CF, Deng JH, Tham LG. The 1786 earthquake-triggered landslide dam and subsequent dam-break flood on the Dadu River. Geomorphology. 2005;65(3-4):205-221.
- Lacroix P, Handwerger AL, Bièvre G. Life and death of slow-moving landslides. Nat Rev Earth Environ. 2020;1(8):404-419.
- Delaney KB, Evans SG. The 2000 Yigong landslide, Tibet, China: formation and breaching of a landslide dam. Nat Hazards. 2015;76(1):191-217.