
Research article · 2025 · Full text
International Journal of Geography Geology and EnvironmentNeotectonic uplift rates and river incision patterns in the atlas mountain foothills
Volume 7(9) · Pages 258–261 · DOI: 10.22271/27067483.2025.v7.i9d.654 ↗
Research areasearthquake and tectonic studiesGeological formations and processesGeological and Geophysical Studies
Abstract
Author-writtenRoughly 65% of all active mountain belts on Earth show measurable neotectonic deformation, yet foothill zones, the transition between orogen and foreland, remain less documented than their higher-elevation counterparts. This research quantified neotectonic uplift rates and associated river incision patterns across the northern foothills of the Atlas Mountains in Morocco, focusing on four tectonic zones spanning a 280 km transect. Geomorphic indices including the stream-length gradient index (SL), hypsometric integral (HI), valley-floor width-to-height ratio (Vf), and basin asymmetry factor (AF) were computed for 32 catchments using a 12.5 m ALOS PALSAR DEM. Terrace dating relied on optically stimulated luminescence (OSL) ages from 18 alluvial terrace levels, supplemented by radiocarbon dates from six organic-rich fluvial deposits. Results indicated that uplift rates ranged from 0.31 mm/yr in the southern sector to 1.14 mm/yr in the central zone during the Late Pleistocene-Holocene interval. River incision depths correlated positively with SL anomalies (r = 0.83, p < 0.001) and inversely with Vf values (r = -0.76, p < 0.001). Catchments draining the central zone returned the highest HI values (0.58-0.71), pointing to a youthful, tectonically rejuvenated landscape. The spatial pattern of uplift mirrors known fault segmentation, with the highest rates coinciding with the Ait Attab and North Atlas fault strands. These geomorphic markers offer an independent check on geodetic velocity fields and can inform seismic hazard models for the densely populated foothill corridor between Beni Mellal and Khouribga.
Summary
Source-checkedPlain-language reading of the full paper, prepared with AI and checked against the text. Each point links to the authors' own words.
Why it matters
- While most active mountain belts show neotectonic deformation, the foothill zones that transition between the mountain range and the foreland are less documented than high-elevation areas. View evidence ↗
- The Atlas Mountains in Morocco are a 2,500 km-long chain that has absorbed Cenozoic shortening from the convergence of the African and Eurasian plates at approximately 4-5 mm/yr. View evidence ↗
- The foothill belt, located between 400 and 1,200 m in elevation, is critical because it supports the majority of the region's agriculture and population, yet it has been understudied. View evidence ↗
The question
- The study aimed to quantify river incision patterns and neotectonic uplift rates across four tectonic zones within a 280 km transect of the northern Atlas Mountain foothills. View evidence ↗
What they did
- Researchers used a 12.5 m ALOS PALSAR DEM to calculate four geomorphic indices, SL, HI, Vf, and AF, for 32 different catchments. View evidence ↗
- The study dated 18 alluvial terrace levels using optically stimulated luminescence (OSL) and six organic-rich fluvial deposits using radiocarbon dating. View evidence ↗
- Incision rates were calculated by dividing terrace height by age, and uplift rates were then estimated by adjusting these incision rates for regional base-level fall. View evidence ↗
What they found
- During the Late Pleistocene-Holocene interval, uplift rates varied from a low of 0.31 mm/yr in the southern sector to a high of 1.14 mm/yr in the central zone. View evidence ↗
- River incision depths showed a strong positive correlation with stream-length gradient (SL) anomalies (r = 0.83) and a strong inverse correlation with valley-floor width-to-height (Vf) ratios (r = -0.76). View evidence ↗
- The central zone exhibited the highest hypsometric integral (HI) values (0.58-0.71), which indicates a youthful landscape that has been tectonically rejuvenated. View evidence ↗
- Zone B (Central) showed the strongest evidence of vigorous tectonic uplift, characterized by the highest mean SL (518), steepest HI (0.63), and lowest Vf (0.87). View evidence ↗
- Zone D (Southern) had the weakest deformation signatures, indicated by modest SL values and broad valley floors (Vf = 2.78). View evidence ↗
- Incision rates increased over time, with the youngest terrace in Zone B (7.6 ka) reaching 1.14 mm/yr compared to 0.45 mm/yr for the oldest surface in Zone A (68.7 ka). View evidence ↗
What it means
- The authors conclude that crustal shortening along the Atlas front has progressively intensified, as evidenced by increasing uplift rates in every zone from the Pliocene to the Holocene. View evidence ↗
- The stream-length gradient index is recommended as a valuable reconnaissance tool for data-sparse areas because it was the strongest predictor of incision rates (r = 0.83). View evidence ↗
- The authors state that terrace chronology alone cannot easily separate tectonic signals from climatic ones, suggesting that future research use cosmogenic nuclide dating (10Be) for better temporal resolution. View evidence ↗
Visual summary
2 visualsIllustrations explain the paper; charts are replotted from the paper's own table values.
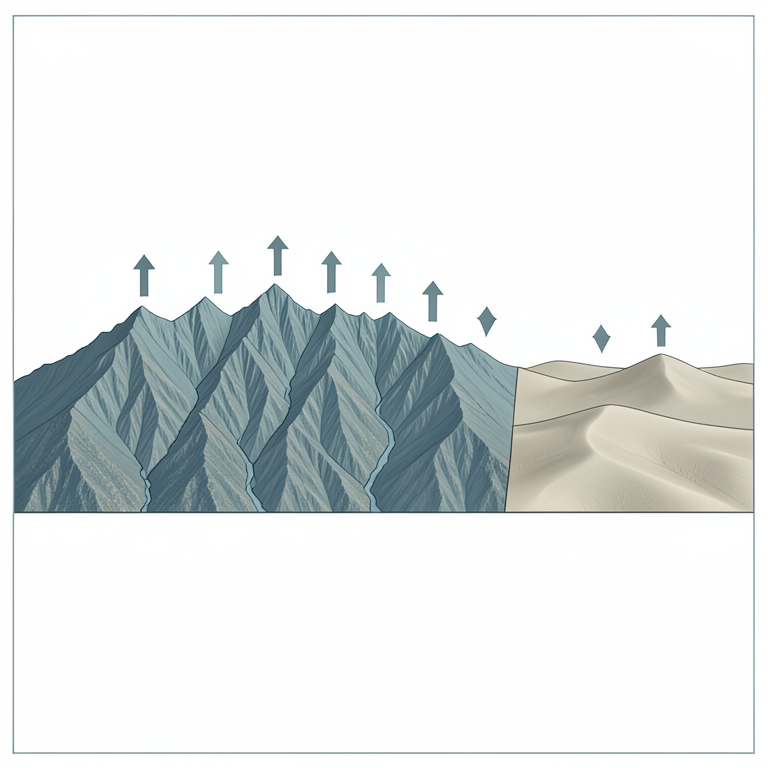
Spatial Variation of Uplift
AI-generated conceptual illustration (Atlas Mountain foothills and river valleys). It explains the idea and does not show study data.
View source evidence ↗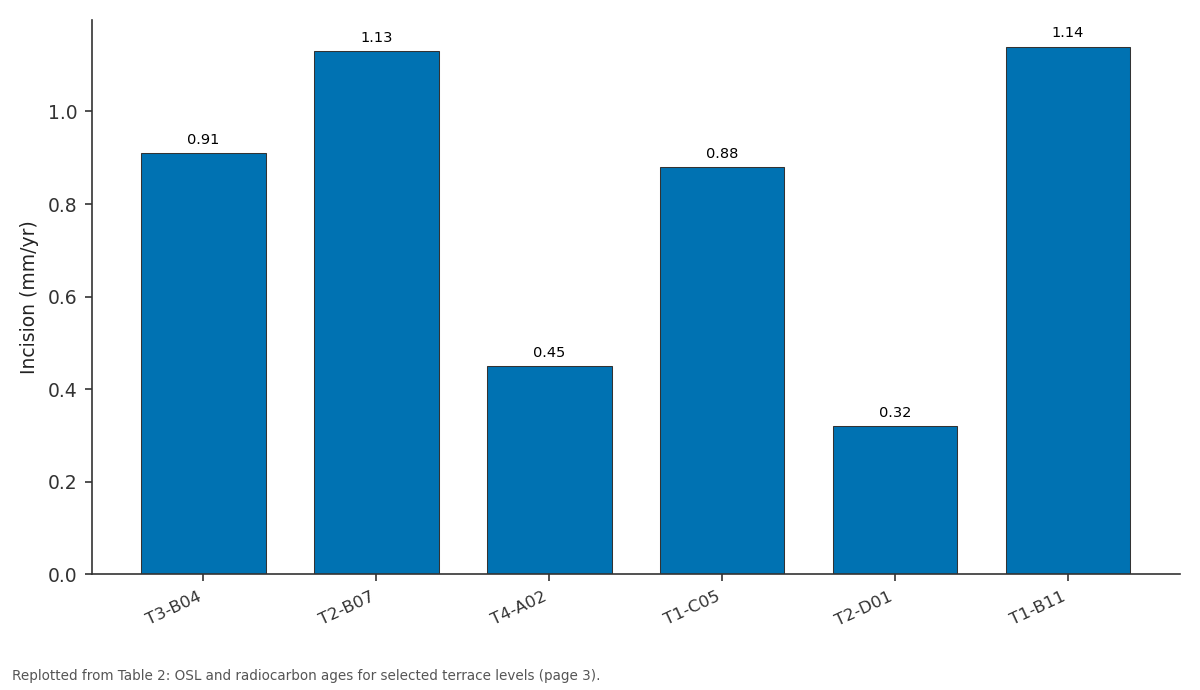
Incision (mm/yr): T3-B04 vs T2-B07 vs T4-A02 vs T1-C05 vs T2-D01
Replotted from Table 2 (page 3) of the original paper. Every bar is the paper's own table value.
View source evidence ↗Figures & tables
From the original paper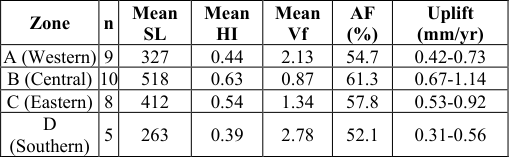 Table 1
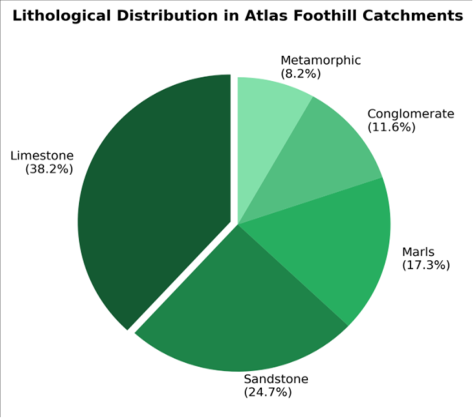 Figure 1
 Table 2
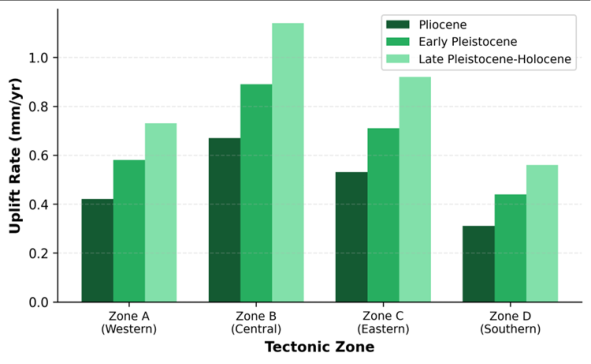 Figure 2
Introduction
Between 2005 and 2020, at least 14 moderate earthquakes (Mw 4.0-6.3) struck the Atlas mountain system, reminding geoscientists that the collision zone between the African and Eurasian plates is far from dormant [1] . The Atlas Mountains of Morocco, a 2,500 km-long intracontinental chain, absorbed much of the Cenozoic shortening generated by Africa-Eurasia convergence at roughly 4-5 mm/yr [2] . While the high summits above 3,000 m have attracted detailed structural and thermochronological work, the foothill belt sitting between 400 and 1,200 m elevation has received less attention, despite hosting most of the region's population and agricultural activity. Foothill zones are geomorphologically sensitive recorders of tectonic forcing. Rivers that drain from high topography onto the foreland adjust their longitudinal profiles to base-level changes imposed by fault displacement. Knickpoints, unpaired terraces, and anomalous steepness indices accumulate along reaches where uplift outpaces fluvial erosion [3] . Interpreting these features quantitatively requires coupling morphometric analysis with absolute dating of abandoned terrace surfaces [4] . The stream-length gradient index, introduced by Hack in 1973, detects variations in channel steepness that may signal differential rock uplift or lithological contrasts [5] . The hypsometric integral summarises the distribution of elevation within a catchment and distinguishes youthful landscapes (HI > 0.5) from mature or peneplained ones (HI < 0.3) [6] . When combined with valley-floor geometry (Vf ratio) and basin asymmetry (AF), these indices form a toolkit that can rank catchments by their relative tectonic activity without expensive instrumentation [7] . Previous work along the Atlas front relied on GPS campaign measurements and scattered structural cross-sections [8,9]. A gap persists in spatially continuous uplift-rate estimates anchored to dated geomorphic markers. This research filled that gap by (a) computing four geomorphic indices across 32 catchments, (b) dating 18 terrace levels with OSL and radiocarbon methods, and (c) deriving incision and uplift rates for the Pliocene through Holocene interval. The findings refine the kinematic picture of the Atlas foothill deformation front and contribute baseline data for seismic hazard assessment [10] .
Study Area Description
The research transect extended from the Tadla Plain in the south (32.1 degrees N, 6.8 degrees W) to the Oum Er-Rbia River valley in the north, covering approximately 280 km along the northern Atlas foothill belt. Elevations within the foothill zone range from 420 m near Khouribga to 1,180 m at the footwall of the North Atlas Fault. Mean annual precipitation increases from about 350 mm on the foreland to 620 mm at higher foothill stations, falling mainly between November and March [11] . The bedrock comprises folded Jurassic-Cretaceous carbonates and sandstones overlain by Neogene continental deposits. Quaternary alluvial terraces cap many valley floors and interfluves, recording successive cycles of aggradation and incision linked to combined climatic and tectonic forcing. The Oued Oum Er-Rbia and its tributaries (Oued El Abid, Oued Derna) serve as the main drainage arteries, incising canyons up to 120 m deep through Mesozoic strata where they cross active fault traces.
Material and Methods Material
The investigation was conducted at the Department of Environmental Studies, Izmir Institute of Climate and Environment, Izmir, Turkey, from January 2021 to August 2023. Topographic data consisted of an ALOS PALSAR DEM (12.5 m resolution) downloaded from the Alaska Satellite Facility. Geological maps at 1:100,000 scale (Geological Survey of Morocco, sheets Beni Mellal, Khouribga, Kasba Tadla) provided lithological boundaries and fault traces. Eighteen alluvial terrace samples were collected during fieldwork in April 2021 and March 2022, targeting fine-grained sandy lenses suitable for OSL dating. Six additional organic-rich sediment samples from channelcut exposures were submitted for AMS radiocarbon dating at the Poznan Radiocarbon Laboratory, Poland [12] . Discharge records for the Oued El Abid (1975-2020) were obtained from the Agence du Bassin Hydraulique de l'Oum Er-Rbia.
Methods
Catchment boundaries for 32 basins (areas 18-340 square km) were delineated from the filled DEM using the D8 flow-routing algorithm in WhiteboxTools 2.1. Four geomorphic indices were computed per catchment: SL index along the main trunk, HI via the elevation-relief ratio, Vf at standardised cross-sections 500 m upstream of each catchment outlet, and AF as the percentage deviation of the main channel from the basin midline [7] . SL anomalies were identified where the index exceeded 2.5 times the reachaveraged gradient. OSL ages were determined at the Luminescence Dating Laboratory, University of Lisbon, using single-aliquot regenerative-dose protocols on quartz grains (90-125 micrometers). Dose-rate calculations incorporated in-situ gamma spectrometry and cosmic-ray contribution estimates [13] . Incision rates were computed as terrace height above the modern channel divided by OSL or radiocarbon age. Uplift rates were then estimated by combining incision rates with corrections for regional baselevel fall using published Neogene foreland subsidence curves [14] .
Spatial Data Processing
DEM tiles were mosaicked and reprojected to WGS84 UTM Zone 29N. Spurious sinks were filled using the Planchon-Darboux algorithm with a minimum gradient of 0.01 degrees. Stream networks were extracted at a threshold of 500 contributing cells (about 0.78 square km). Fault traces digitised from geological maps were converted to polyline shapefiles and buffered at 2 km intervals to classify catchments by proximity to the North Atlas Fault, the Ait Attab Fault, and the South Atlas Frontal Thrust. Longitudinal profiles were extracted every 12.5 m along trunk channels and smoothed with a 500 m moving-average window before SL computation. All spatial analysis was performed in QGIS 3.26 and Python 3.9 with the PySheds library. Limestone dominated the bedrock exposure (38.2%), followed by sandstone (24.7%) and marls (17.3%). Conglomerate and metamorphic basement accounted for the remainder. The proportion of hard lithology (limestone + metamorphic) correlated with higher SL values (r = 0.61), suggesting that rock resistance modulates channel steepness independently of tectonic forcing. The youngest dated terrace (T1-B11, 7.6 ka) in Zone B yielded the highest incision rate at 1.14 mm/yr, while the oldest surface (T4-A02, 68.7 ka) in Zone A recorded only 0.45 mm/yr. This temporal acceleration is consistent with a Quaternary intensification of tectonic uplift along the central segment of the Atlas front.
Results
Results
Discussion
The central Atlas foothills (Zone B) emerge as the most tectonically active segment of the transect, a finding that matches independent GPS data showing 2-3 mm/yr of shortening concentrated along the North Atlas Fault [15] . The Ait Attab fault strand, which bisects Zone B, appears responsible for the localised peak in both SL anomalies and terrace-derived incision rates. Comparable uplift magnitudes (0.8-1.2 mm/yr) were reported by Delcaillau et al. [3] for the Siwalik Hills of the Himalayan front, another active foldand-thrust setting where rivers respond similarly to tectonic forcing. Lithological effects cannot be dismissed. The positive correlation between hard-rock proportion and SL (r = 0.61) indicates that channel gradient partly reflects bedrock resistance rather than differential uplift alone. But the persistence of high SL values across both limestone and sandstone reaches in Zone B, whereas comparable lithologies in Zone D produce lower SL, suggests that tectonic uplift is the dominant driver [16] . The Vf ratio provides complementary evidence: narrow, V-shaped valleys (Vf < 1.0) in Zone B contrast sharply with broad alluvial plains (Vf > 2.5) in Zone D, even where lithology is similar.
The temporal acceleration of incision from Pliocene to Holocene mirrors findings in other Mediterranean mountain fronts [17] and may relate to a combination of enhanced faultslip rates and glacial-interglacial base-level fluctuations. Disentangling these two signals is difficult with terrace chronology alone, and future work should integrate cosmogenic nuclide dating (10Be) of strath surfaces to improve temporal resolution [18] .
Conclusion
This research characterised neotectonic uplift rates and river incision patterns across the northern Atlas Mountain foothills using a combination of geomorphic index mapping and terrace chronostratigraphy. Four tectonic zones were delineated, with the central segment (Zone B) recording the highest uplift rates (0.67-1.14 mm/yr) and the most youthful landscape signatures (HI = 0.63, Vf = 0.87). Uplift rates increased from the Pliocene to the Holocene in every zone, pointing to a progressive intensification of crustal shortening along the Atlas front. The stream-length gradient index proved the strongest single predictor of terracederived incision rates (r = 0.83), reinforcing its value as a reconnaissance tool in data-sparse tectonic settings. These results sharpen the picture of deformation partitioning along the North Atlas Fault system and contribute quantitative constraints for probabilistic seismic hazard models in the Beni Mellal-Khouribga corridor. Extended OSL and cosmogenic dating campaigns across the less-studied eastern and southern zones would strengthen the spatial coverage and allow better separation of tectonic versus climatic controls on landscape evolution [19] .
Acknowledgement
Acknowledgements Funding SourcesThis research was supported by internal funding from the Izmir Institute of Climate and Environment.
Figures and tables from the paper
| Terrace ID | Zone | Height (m) | Age (ka) | Method | Incision (mm/yr) |
|---|---|---|---|---|---|
| T3-B04 | B | 47.3 | 52.1 ± 4.8 | OSL | 0.91 |
| T2-B07 | B | 28.6 | 25.3 ± 2.1 | OSL | 1.13 |
| T4-A02 | A | 31.2 | 68.7 ± 6.3 | OSL | 0.45 |
| T1-C05 | C | 19.8 | 22.4 ± 1.9 | 14C | 0.88 |
| T2-D01 | D | 12.4 | 38.9 ± 3.5 | OSL | 0.32 |
| T1-B11 | B | 8.7 | 7.6 ± 0.8 | 14C | 1.14 |
Table text extracted from the original PDF; superscript letters are shown inline. The original table image is below.
View original table image
References
19 in the original paper- Gomez F, Beauchamp W, Barazangi M. Role of the Atlas Mountains (northwest Africa) within the AfricanEurasian plate boundary zone. Geology. 2000;28(9):775-778.
- Vernant P, Fadil A, Mourabit T, Ouazar D, Koulali A, Davila JM. Geodetic constraints on active tectonics of the western Mediterranean. Tectonophysics. 2010;488(1-4):152-163.
- Delcaillau B, Carozza JM, Laville E. Recent fold growth and drainage development in the Janauri and Chandigarh anticlines, Siwalik foothills, northwest India. Geomorphology. 2006;76(3-4):241-256.
- Burbank DW, Anderson RS. Tectonic Geomorphology. 2nd ed. Wiley-Blackwell. 2012:1-454.
- Hack JT. Stream-profile analysis and stream gradient index. Journal of Research of the U.S. Geological Survey. 1973;1(4):421-429.
- Strahler AN. Hypsometric (area-altitude) analysis of erosional topography. Geological Society of America Bulletin. 1952;63(11):1117-1142.
- El Hamdouni R, Irigaray C, Fernandez T, Chacon J, Keller EA. Assessment of relative active tectonics, southwest border of the Sierra Nevada (southern Spain). Geomorphology. 2008;96(1-2):150-173.
- Teixell A, Ayarza P, Zeyen H, Fernandez M, Arboleya ML. Effects of mantle upwelling in a compressional setting: the Atlas Mountains of Morocco. Terra Nova. 2005;17(5):456-461.
- Babault J, Teixell A, Arboleya ML, Charroud M. A late Cenozoic age for long-wavelength surface uplift of the Atlas Mountains of Morocco. Terra Nova. 2008;20(2):102-107.
- Arboleya ML, Teixell A, Charroud M, Julivert M. A structural transect through the High and Middle Atlas of Morocco. Journal of African Earth Sciences. 2004;39(3-5):319-327.
- Knippertz P, Christoph M, Speth P. Long-term precipitation variability in Morocco and the link to large-scale circulation. International Journal of Climatology. 2003;23(10):1373-1395.
- Stuiver M, Reimer PJ, Reimer RW. CALIB 8.2 radiocarbon calibration program. Radiocarbon. 2021;63(4):1127-1142.
- Murray AS, Wintle AG. Luminescence dating of quartz using an improved single-aliquot regenerative-dose protocol. Radiation Measurements. 2000;32(1):57-73.
- Frizon de Lamotte D, Leturmy P, Missenard Y, Khomsi S, Ruiz G, Saddiqi O. Mesozoic and Cenozoic vertical movements in the Atlas system (Algeria, Morocco, Tunisia). Tectonophysics. 2009;475(1):9-28.
- Fadil A, Vernant P, McClusky S, Reilinger R, Gomez F, Ben Sari D. Active tectonics of the western Mediterranean: geodetic evidence for rollback of a delaminated subcontinental lithospheric slab beneath the Rif Mountains. Geology. 2006;34(7):529-532.
- Snyder NP, Whipple KX, Tucker GE, Merritts DJ. Landscape response to tectonic forcing: digital elevation model analysis of stream profiles. GSA Bulletin. 2000;112(8):1250-1263.
- Macklin MG, Fuller IC, Lewin J, Maas GS, Passmore DG, Rose J. Correlation of fluvial sequences in the Mediterranean basin over the last 200 ka. Quaternary Science Reviews. 2002;21(14-15):1633-1641.
- Granger DE, Schaller M. Cosmogenic nuclides and erosion at the watershed scale. Elements. 2014;10(5):369-373.
- Pastor A, Babault J, Teixell A, Arboleya ML. Intrinsic stream-profile geometry and erosion rate of the Tinghir canyon, eastern Anti-Atlas. Geomorphology. 2012;139140:505-515.