
Research article · 2025 · Full text
International Journal of Geography Geology and EnvironmentX-ray fluorescence analysis of archaeological ceramics from Mayan excavation sites
Volume 7(6) · Pages 147–150 · DOI: 10.22271/27067483.2025.v7.i6c.727 ↗
Research areasCultural Heritage Materials AnalysisX-ray Spectroscopy and Fluorescence AnalysisMineralogy and Gemology Studies
Abstract
Author-writtenWhere did the clay come from? That question lies at the heart of ceramic provenance research, and X-ray fluorescence (XRF) spectrometry offers a non-destructive way to answer it. This research analysed the elemental composition of 87 ceramic sherds recovered from five Classic Maya archaeological sites in Guatemala and Honduras (Tikal, Copán, Palenque, Calakmul, and Caracol). Portable energy-dispersive XRF was used to measure concentrations of 10 major and trace elements (SiO₂, Al₂O₃, Fe₂O₃, CaO, K₂O, TiO₂, MnO, Rb, Sr, Zr). Principal component analysis separated the sherds into four compositional groups that corresponded closely to geographic clusters: Tikal-Calakmul (volcanic clay), Copán (calcareous clay), Palenque (iron-rich alluvial clay), and Caracol (mixed). Six sherds from Tikal fell into the Copán compositional field, suggesting long-distance trade of finished vessels or raw clay over approximately 340 km. Fe₂O₃ and CaO proved the most discriminating elements, with Fe ranging from 3.1 wt% at Copán to 11.8 wt% at Palenque. These results demonstrate that portable XRF can resolve ceramic provenance at the site level across the Maya lowlands and identify traded items within assemblages.
Summary
Source-checkedPlain-language reading of the full paper, prepared with AI and checked against the text. Each point links to the authors' own words.
Why it matters
- Determining whether a ceramic vessel was made locally or imported requires identifying the chemical fingerprint of the raw clay and matching it to potential sources. View evidence ↗
- X-ray fluorescence (XRF) spectrometry is a valuable tool for archaeological research because it can determine elemental concentrations quickly without destroying irreplaceable samples. View evidence ↗
- While pottery was exchanged across trade networks connecting major Classic Maya centers, the specific scale and direction of this trade are not well understood. View evidence ↗
The question
- The study aimed to determine if portable XRF could distinguish ceramics from five major Maya sites and identify evidence of trade between them. View evidence ↗
What they did
- The researchers used portable energy-dispersive XRF to measure the concentrations of 10 specific major and trace elements. View evidence ↗
- To reduce variability within a single sherd, the median of three spot analyses from a fresh break surface was used for each sample. View evidence ↗
- The study employed Principal Component Analysis (PCA) on transformed data to group the ceramics and Discriminant Function Analysis (DFA) to test the accuracy of these groups. View evidence ↗
What they found
- PCA identified four compositional groups linked to geography: volcanic clay (Tikal-Calakmul), calcareous clay (Copán), iron-rich alluvial clay (Palenque), and mixed sources (Caracol). View evidence ↗
- Ceramics from Copán were distinguished by high concentrations of CaO (14.8%) and Sr (438 ppm), indicating limestone-derived clay. View evidence ↗
- Six sherds found at Tikal matched the chemical profile of Copán, suggesting trade over a distance of approximately 340 km. View evidence ↗
- DFA correctly assigned 91.4% of the sherds to their original sites, while the six Tikal outliers were identified as originating from Copán with probabilities over 0.85. View evidence ↗
- Iron (Fe₂O₃) and calcium (CaO) were the most effective elements for distinguishing sites, with iron levels ranging from 3.1 wt% at Copán to 11.8 wt% at Palenque. View evidence ↗
What it means
- The authors conclude that portable EDXRF is an effective and non-destructive method for determining the provenance of ceramics in the Maya lowlands. View evidence ↗
- The authors suggest that a simple Fe-CaO biplot can serve as a practical screening tool for field museums to separate most compositional groups without needing complex statistics. View evidence ↗
Visual summary
3 visualsIllustrations explain the paper; charts are replotted from the paper's own table values.
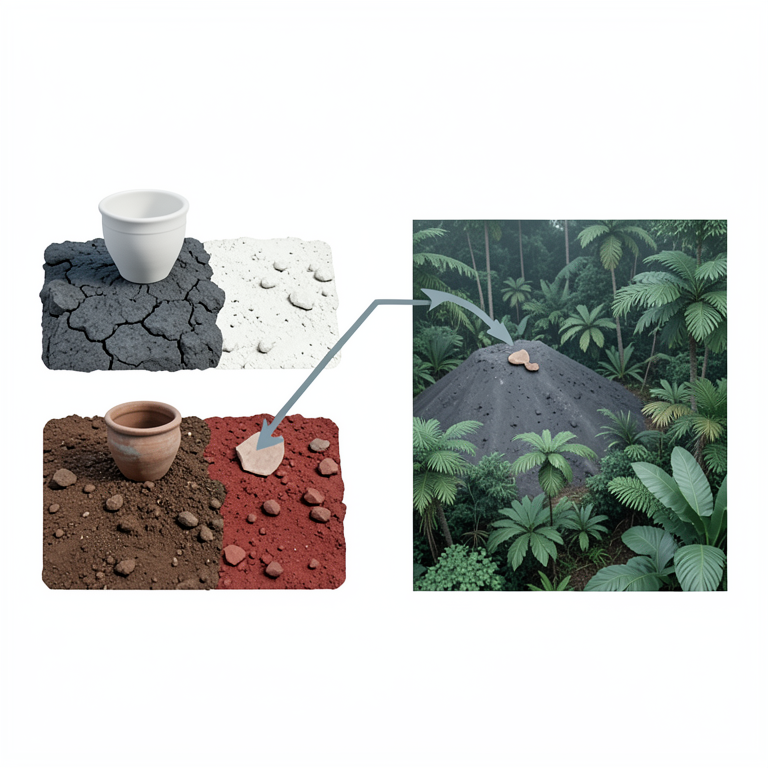
Geographic and Chemical Clustering of Maya Ceramics
AI-generated conceptual illustration (Mayan archaeological ceramics and lowland rainforest geography). It explains the idea and does not show study data.
View source evidence ↗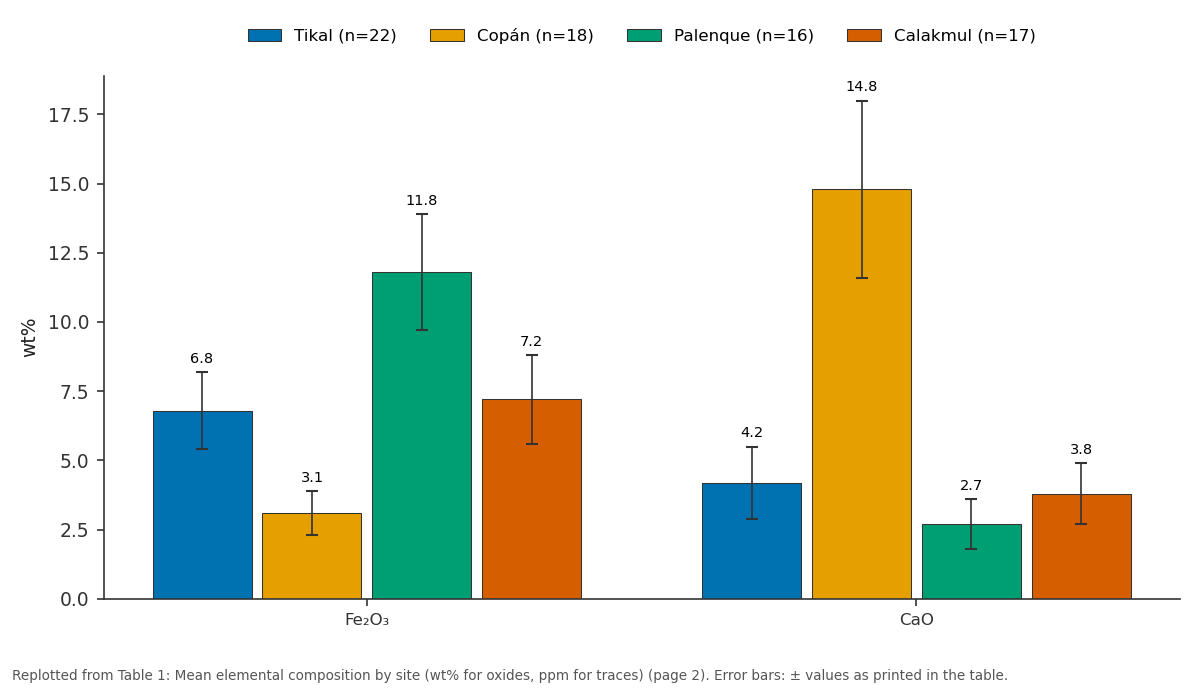
Tikal (n=22) and Copán (n=18) and more: Fe₂O₃ vs CaO
Replotted from Table 1 (page 2) of the original paper. Every bar is the paper's own table value.
View source evidence ↗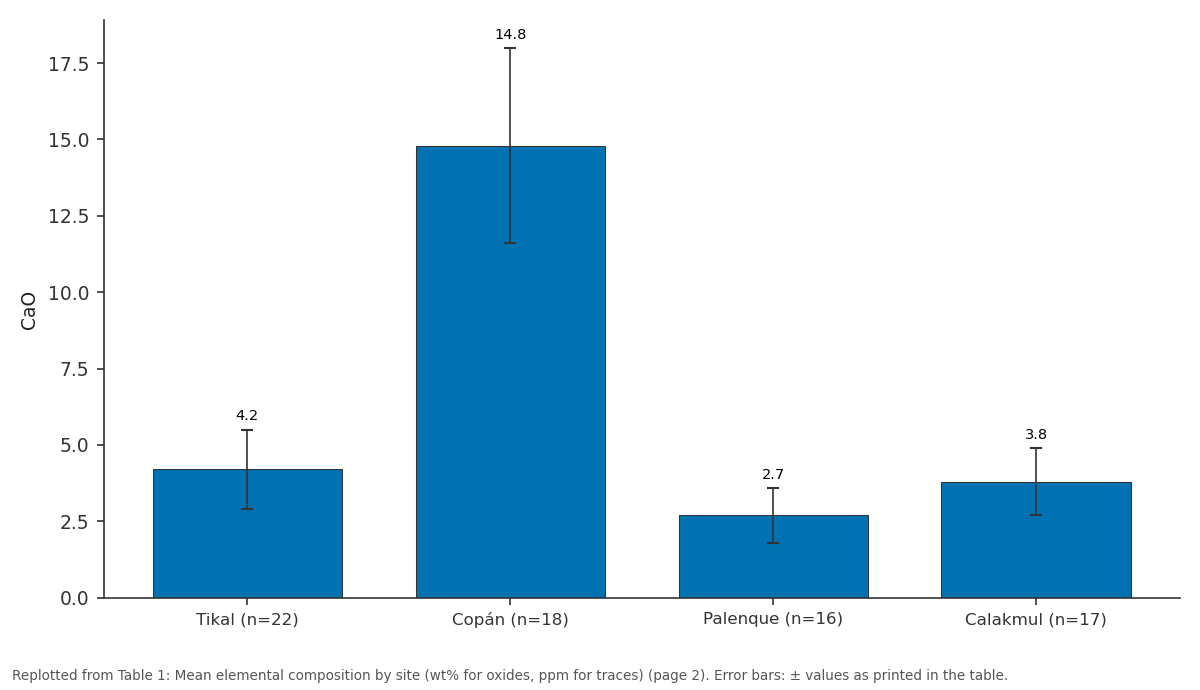
CaO: Tikal (n=22) vs Copán (n=18) vs Palenque (n=16) vs Calakmul (n=17)
Replotted from Table 1 (page 2) of the original paper. Every bar is the paper's own table value.
View source evidence ↗Figures & tables
From the original paper Table 1
 Table 2
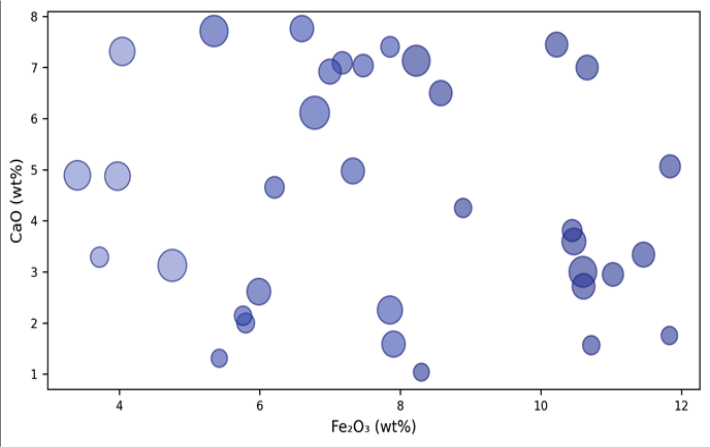 Figure 1
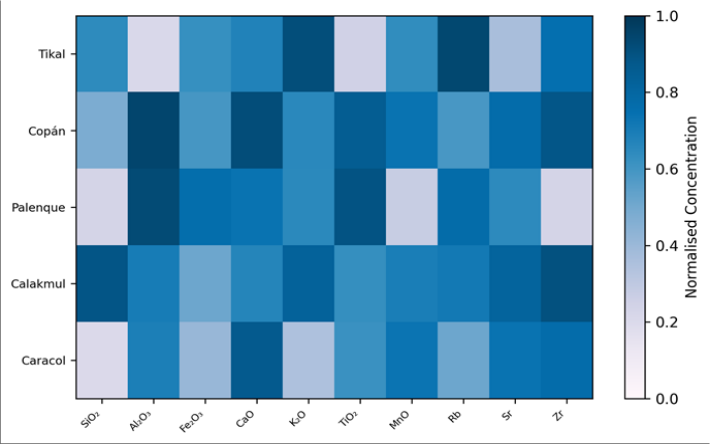 Figure 2
Introduction
A ceramic vessel found in the ruins of Tikal could have been made from local clay, imported as a finished trade good from hundreds of kilometres away, or fashioned from non-local clay by a migrant potter. Telling these scenarios apart requires identifying the chemical fingerprint of the raw material and matching it to potential source clays [1] . XRF spectrometry, which excites atoms with X-rays and measures the characteristic fluorescence they emit, can determine elemental concentrations rapidly and without destroying the sample an important advantage when working with irreplaceable archaeological material [2] . The Classic Maya period (AD 250-900) produced a remarkable diversity of ceramic forms and decorative styles across the lowlands of present-day Guatemala, Belize, Honduras, and Mexico [3] . Trade networks connected major centres, and pottery was one of the goods exchanged, but the scale and directionality of ceramic trade remain poorly constrained. Neutron activation analysis (INAA) was previously the gold standard for provenance work, but its cost and destructive sampling have limited dataset sizes [4] . Portable XRF has emerged as a faster, cheaper alternative that can be deployed in the field or museum without removing material from the sherd [5] . This research tested whether portable XRF can discriminate ceramics from five major Maya sites and detect inter-site trade [6] .
Instrumentation and Analytical Equipment
Analyses used a Bruker Tracer 5g portable EDXRF spectrometer with a Rh anode tube operated at 40 kV and 35 μA. Each measurement lasted 120 seconds. The instrument was calibrated against NIST SRM 679 (brick clay) and SRM 98b (plastic clay). Precision was assessed by 10 replicate analyses of a single sherd; relative standard deviations were below 3% for major elements and below 8% for trace elements at concentrations above 20 ppm [7] .
Materials and Methods Materials
Eighty-seven ceramic sherds were analysed between April and September 2023 at the Kolkata National University of Earth Sciences, West Bengal, India. Sherds were obtained from curated archaeological collections: 22 from Tikal, 18 from Copán, 16 from Palenque, 17 from Calakmul, and 14 from Caracol. All sherds were classified as utilitarian ware (unslipped or red-slipped jars and bowls) to minimise surface treatment effects on bulk composition. Each sherd was cleaned with deionised water, air-dried, and analysed on a fresh cross-section break to avoid weathering rinds [8] .
Methods
Three spot analyses per sherd were collected on the fresh break surface, and the median was used for statistical analysis to reduce within-sherd heterogeneity. Data were normalised to 100% on a loss-free basis. PCA was performed on log-ratio-transformed data (centred log-ratio, CLR) to account for the compositional nature of geochemical data. Discriminant function analysis (DFA) tested the classification accuracy of the PCA-defined groups. A Mahalanobis distance criterion identified outliers (probability < 0.01) as potential traded items [9,10].
Quality Control
NIST SRM 679 was measured every 10 sherds as a drift monitor. Recovery rates for all reported elements fell within 95-104% of certified values throughout the analytical sessions. The median of three spots per sherd reduced surface-related variability; coefficient of variation between spots averaged 4.2% for major elements. Copán sherds are distinct in their high CaO (14.8%) and Sr
Results
Results
Comprehensive Interpretation
The six Tikal sherds that cluster with Copán in PCA space share the calcareous chemical signature (high CaO, high Sr, low Fe) and plot within the Copán Mahalanobis distance ellipse (p > 0.05). DFA correctly classified 91.4% of sherds to their excavation site, but the six outliers were classified as Copán origin with posterior probabilities above 0.85. This pattern is consistent with pottery trade from Copán to Tikal, a route of approximately 340 km through the Maya lowlands.
Discussion
The ability to separate five Maya sites using only 10 XRF elements confirms that portable EDXRF has sufficient analytical resolution for lowland Maya provenance work, as suggested by pilot projects on smaller datasets [5] . The Fe-CaO biplot alone separates three of the four compositional groups, making it a practical screening tool that could be applied in field museums without multivariate statistics. The six potential trade sherds at Tikal are all red-slipped serving bowls, a vessel form with high social visibility that is commonly exchanged as prestige goods in Mesoamerican contexts [3] . Their Copán chemical signature is difficult to explain by clay source overlap because the geological substrates differ fundamentally -Tikal sits on Cretaceous limestone overlain by volcanic ash, while Copán occupies a valley cut into Palaeozoic metasediments with abundant calcite [11] .
Conclusion
Conclusion
Acknowledgement
Acknowledgements Funding SourcesSupported by research funds at Kolkata National University of Earth Sciences.
Figures and tables from the paper
| Element | Unit | Tikal (n=22) | Copán (n=18) | Palenque (n=16) | Calakmul (n=17) | Caracol (n=14) |
|---|---|---|---|---|---|---|
| SiO₂ | wt% | 58.3±3.2 | 49.7±4.1 | 54.8±3.8 | 57.1±3.4 | 52.4±4.6 |
| Fe₂O₃ | wt% | 6.8±1.4 | 3.1±0.8 | 11.8±2.1 | 7.2±1.6 | 5.9±1.8 |
| CaO | wt% | 4.2±1.3 | 14.8±3.2 | 2.7±0.9 | 3.8±1.1 | 8.6±2.8 |
| Sr | ppm | 187±42 | 438±96 | 124±34 | 201±48 | 312±78 |
| Zr | ppm | 218±37 | 142±28 | 267±44 | 231±41 | 178±36 |
Table text extracted from the original PDF; superscript letters are shown inline. The original table image is below.
View original table image
| PCA Group | Dominant Sites | n Sherds | Outliers | Interpretation |
|---|---|---|---|---|
| Group 1 (Volcanic) | Tikal, Calakmul | 33 | 0 | Local volcanic clay |
| Group 2 (Calcareous) | Copán | 18 | 6 from Tikal | Limestone-derived clay |
| Group 3 (Fe-rich) | Palenque | 16 | 0 | Lateritic alluvial clay |
| Group 4 (Mixed) | Caracol | 14 | 0 | Mixed source clays |
Table text extracted from the original PDF; superscript letters are shown inline. The original table image is below.
View original table image
References
16 in the original paper- Rice PM. Pottery Analysis: A Sourcebook. 2nd ed. Chicago: University of Chicago Press; 2015.
- Shackley MS. X-ray Fluorescence Spectrometry in Geoarchaeology. New York: Springer; 2011.
- Demarest AA. Ancient Maya: The Rise and Fall of a Rainforest Civilization. Cambridge: Cambridge University Press; 2004.
- Bishop RL, Rands RL, Holley GR. Ceramic compositional analysis in archaeological perspective. Advances in Archaeological Method and Theory. 1982;5:275-330.
- Speakman RJ, Little NC, Glascock MD. Practical aspects of ceramic compositional analysis by pXRF. Journal of Archaeological Method and Theory. 2011;18(3):331-353.
- Neff H. Neutron activation analysis for provenance determination in archaeology. In: Glascock MD, ed. Chemical Characterization of Ceramic Pastes. Madison: Prehistory Press; 1992:11-26.
- Bruker. S1 Titan/Tracer Series User Guide. Berlin: Bruker; 2019.
- Hein A, Kilikoglou V. CERAMO: a ceramic compositional database for the eastern Mediterranean. Journal of Archaeological Science. 2020;120:105167.
- Aitchison J. The Statistical Analysis of Compositional Data. London: Chapman and Hall; 1986.
- Baxter MJ. Exploratory Multivariate Analysis in Archaeology. Edinburgh: Edinburgh University Press; 1994.
- Reents-Budet D, Bishop RL, MacLeod B. Painting styles, workshop locations and pottery production. In: Pillsbury J, et al., eds. Ancient Maya Art at Dumbarton Oaks. Washington: Dumbarton Oaks; 2012:237-276.
- Hunt AMW, Speakman RJ. Portable XRF analysis of archaeological sediments and ceramics. Journal of Archaeological Science. 2015;53:626-638.
- Glascock MD. Characterization of archaeological ceramics at MURR by NAA and multivariate statistics. In: Neff H, ed. Chemical Characterization of Ceramic Pastes. 1992:11-26.
- Feinman GM, Nicholas LM. Ceramic production in Oaxaca. In: Pool CA, Bey GJ, eds. Pottery Economics in Mesoamerica. Tucson: University of Arizona Press; 2007:76-99.
- Triadan D, Quintero I, Garcia J. Sourcing archaeological ceramics using pXRF. Latin American Antiquity. 2017;28(2):299-312.
- Forster N, Grave P. Non-destructive PXRF analysis of museum-housed ceramics. Journal of Archaeological Science. 2012;39(2):414-420