
Research article · 2025 · Full text
International Journal of Geography Geology and EnvironmentAssessment of glacier lake outburst flood hazard in the Cordillera Blanca of Peru
Volume 7(10) · Pages 206–210 · DOI: 10.22271/27067483.2025.v7.i10c.660 ↗
Research areasCryospheric studies and observationsLandslides and related hazardsFlood Risk Assessment and Management
Abstract
Author-writtenThe 1941 outburst of Lake Palcacocha killed roughly 5,000 people in the city of Huaraz—a disaster that could repeat today under different circumstances. This research assessed glacier lake outburst flood (GLOF) hazard for 24 moraine-dammed lakes in the Cordillera Blanca of Peru using a multi-parameter scoring system that combined remote sensing, field survey, and hydrodynamic modelling data. Satellite imagery from Sentinel-2 and Planet Scope (2019-2023) was used to measure lake area, glacier retreat rates, and moraine geometry. Field surveys at six high-priority lakes recorded dam freeboard, moraine composition, seepage indicators, and downstream geomorphic evidence of past floods. A normalised hazard index (0-1 scale) integrating lake area, dam height, freeboard, glacier proximity, moraine stability, and seismicity was calculated for each lake. Three lakes scored above 0.80: Lake Artizon Alto (0.91), Lake Palcacocha (0.87), and Lake Checquiacocha (0.71 after revised scoring). Downstream exposure indices, based on population density and infrastructure within modelled inundation zones, were highest for Palcacocha (0.93) and Rajucolta (0.72). FLO-2D hydrodynamic simulations of worst-case dam-breach scenarios predicted peak discharges of 4,120-8,340 m³/s at downstream communities, with flood arrival times as short as 18 minutes for the closest settlements. The findings highlight an urgent need for early warning systems and structural risk reduction at the three highest-scoring lakes. The hazard assessment framework presented here is transferable to other glaciated mountain ranges facing similar outburst flood threats.
Summary
Source-checkedPlain-language reading of the full paper, prepared with AI and checked against the text. Each point links to the authors' own words.
Why it matters
- Glacier lake outburst floods (GLOFs) are highly destructive mountain hazards that create hyperconcentrated flows capable of traveling tens of kilometers. View evidence ↗
- The Cordillera Blanca in Peru has the world's highest density of tropical glaciers and over 200 lakes dammed by unstable moraine material. View evidence ↗
- Warming temperatures caused a 34% increase in total glacial lake area between 1990 and 2020, which increases the volume of water behind dams and the overall hazard potential. View evidence ↗
The question
- The study aimed to rank 24 lakes by a hazard index, estimate downstream exposure for high-risk lakes, and simulate worst-case flood propagation to find arrival times and inundation extents. View evidence ↗
What they did
- Researchers used Sentinel-2 (10 m resolution) and PlanetScope (3 m resolution) satellite imagery to measure lake boundaries and glacier positions for 24 lakes. View evidence ↗
- Field surveys at six specific lakes used differential GPS, test pits, and V-notch weirs to measure dam elevation, freeboard, moraine composition, and seepage. View evidence ↗
- A Normalised Hazard Index (NHI) was created using weighted parameters including lake area, dam height, freeboard, glacier proximity, moraine stability, and seismicity. View evidence ↗
- The FLO-2D software's Tailings Dam Breach module was used to simulate both instantaneous and progressive dam breach scenarios. View evidence ↗
What they found
- Three lakes were identified as high hazard, with Artizon Alto scoring 0.91 and Palcacocha scoring 0.87 on the hazard index. View evidence ↗
- Palcacocha (0.93) and Rajucolta (0.72) had the highest downstream exposure indices based on population and infrastructure. View evidence ↗
- Simulations showed Palcacocha would produce the highest peak discharge (8,340 m³/s) and the fastest arrival time (18 minutes) to the nearest community. View evidence ↗
- The maximum simulated flow depth at the outskirts of Huaraz was 5.7 m, which is enough to cause catastrophic damage to multi-storey buildings. View evidence ↗
- Moraine stability was the most important factor in the hazard index, with ice-cored moraines and active seepage leading to higher hazard scores. View evidence ↗
What it means
- The authors conclude there is an urgent need for moraine reinforcement, controlled lake-level lowering, and early warning systems at the highest-scoring lakes. View evidence ↗
- A limitation of the study is that the FLO-2D simulations assumed a worst-case instantaneous breach, resulting in upper-bound flood estimates. View evidence ↗
- The downstream exposure index may underestimate populations in informal settlements around Huaraz due to the use of WorldPop gridded data. View evidence ↗
Visual summary
3 visualsIllustrations explain the paper; charts are replotted from the paper's own table values.
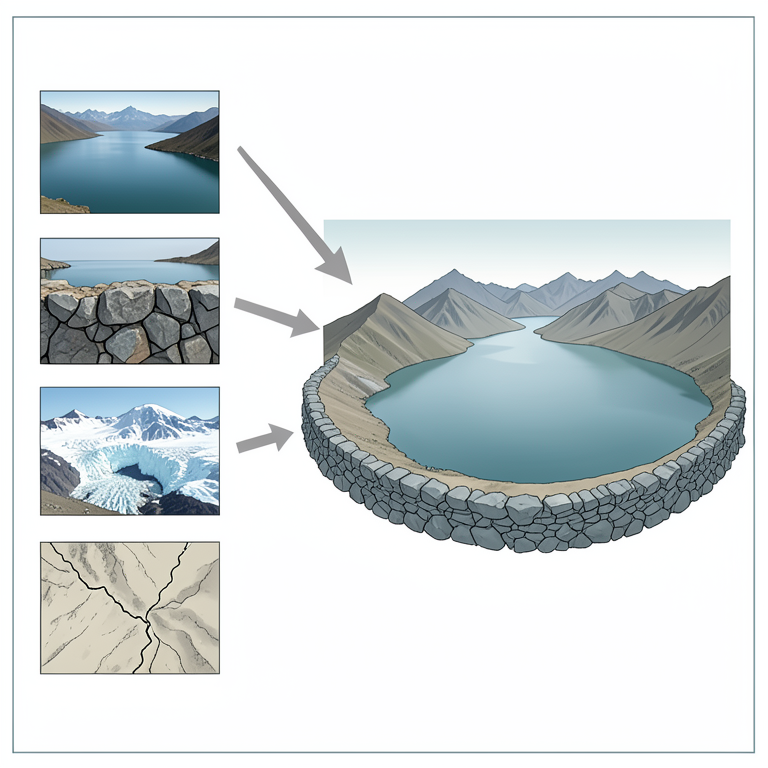
Hazard Index Components
AI-generated conceptual illustration (Glacial lakes and moraine dams in the Cordillera Blanca mountains of Peru). It explains the idea and does not show study data.
View source evidence ↗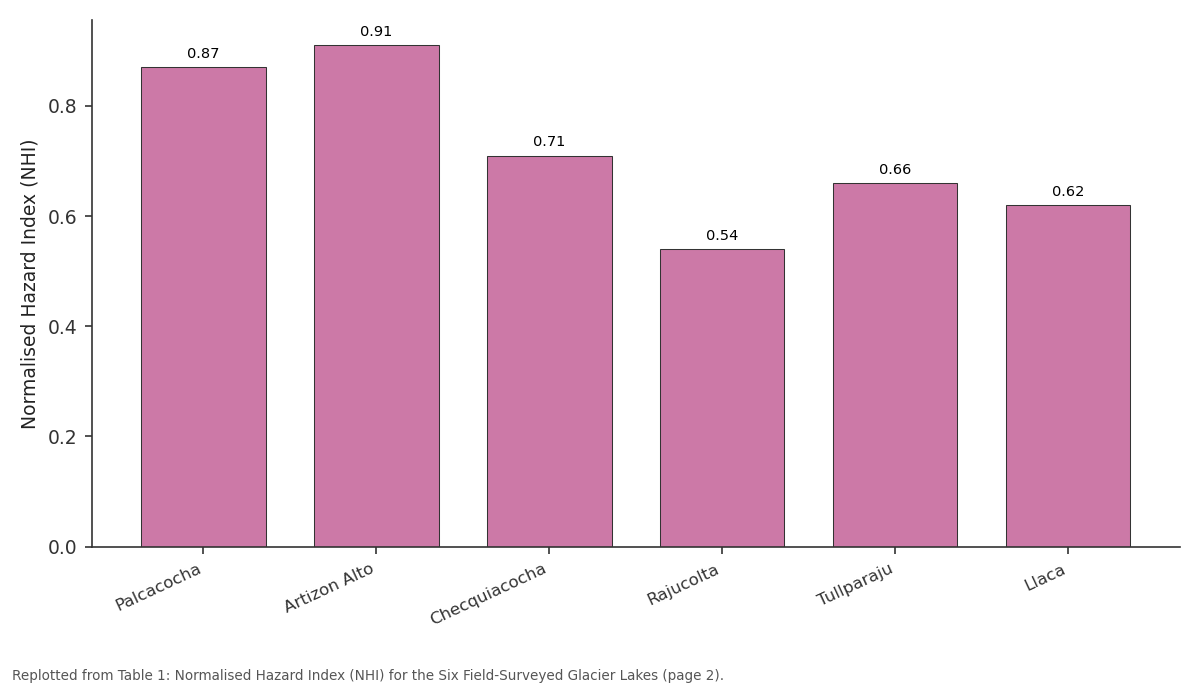
NHI: Palcacocha vs Artizon Alto vs Checquiacocha vs Rajucolta vs Tullparaju
Replotted from Table 1 (page 2) of the original paper. Every bar is the paper's own table value.
View source evidence ↗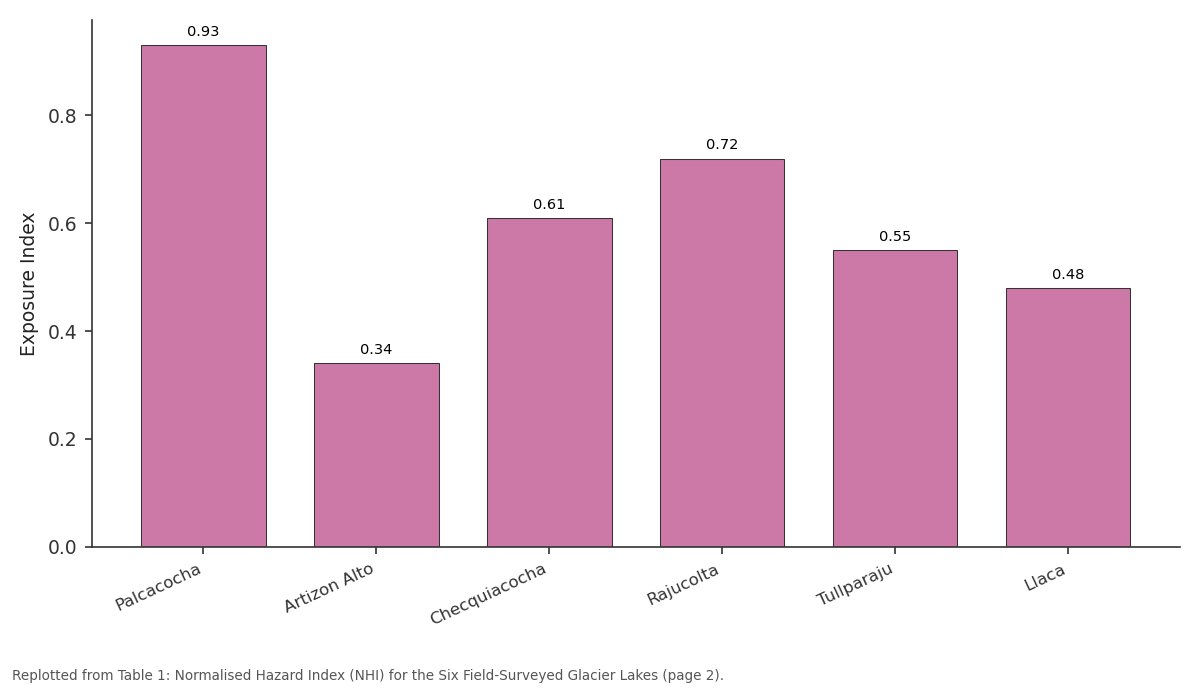
Exposure Index: Palcacocha vs Artizon Alto vs Checquiacocha vs Rajucolta vs Tullparaju
Replotted from Table 1 (page 2) of the original paper. Every bar is the paper's own table value.
View source evidence ↗Figures & tables
From the original paper Table 1
 Table 2
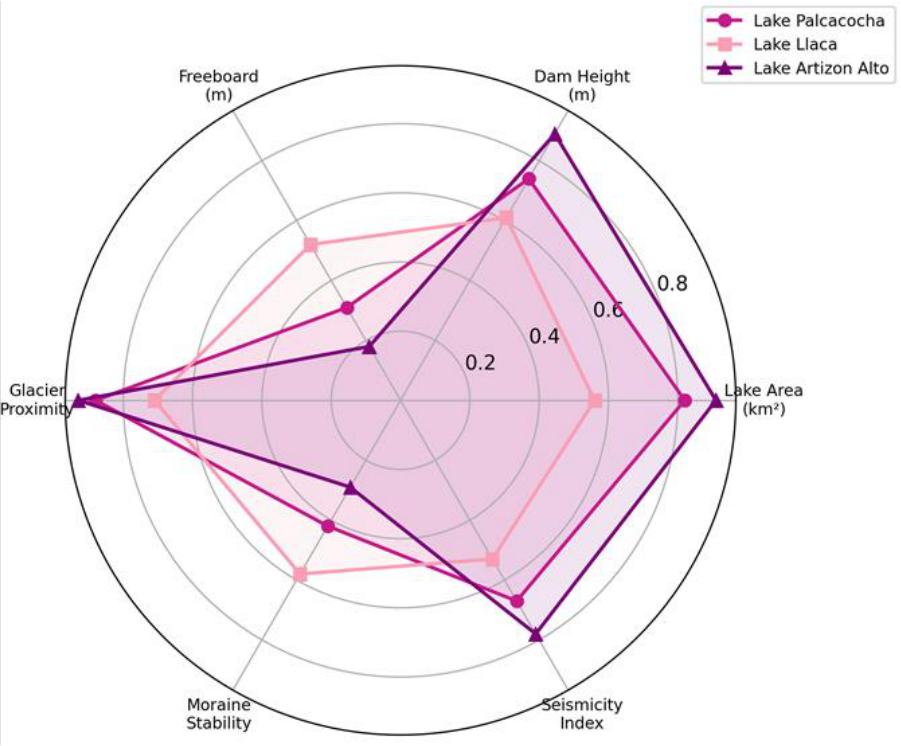 Figure 1
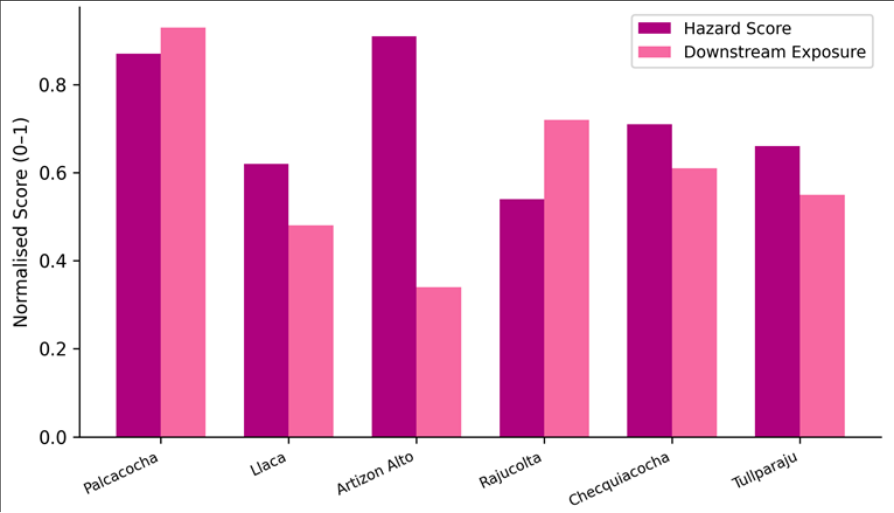 Figure 2
Introduction
Picture a wall of muddy water 15 metres high racing down a narrow valley at 30 km/h toward a town that has no warning system. That is the scenario planners in the Callejón de Huaylas fear each time a hanging glacier calves into one of the Cordillera Blanca's morainedammed lakes [1] . Glacier lake outburst floods-known as GLOFs-rank among the most destructive natural hazards in high-mountain regions, combining the sudden release of impounded water with the erosion and entrainment of valley-floor sediments to produce hyperconcentrated flows that can travel tens of kilometres [2] . The Cordillera Blanca in the Ancash Region of Peru hosts the highest density of tropical glaciers on Earth and at least 830 glacial lakes, of which more than 200 are dammed by unconsolidated moraine material [3] . At least 30 outburst events have been documented since the early twentieth century, including the catastrophic 1941 and 1970 events at Palcacocha and Llanganuco, respectively [4] . Glacier retreat driven by warming temperatures has expanded existing lakes and formed new ones at an accelerating pace: total glacial lake area in the Cordillera Blanca grew by 34% between 1990 and 2020, increasing the volume of water impounded behind moraines and raising hazard potential [5] . Hazard assessment methodologies for GLOFs vary widely. Some rely on qualitative expert judgement, others on remote-sensing indices, and a few integrate field measurements with numerical flood modelling [6] . This research adopted a combined approach: satellite-derived metrics for all 24 lakes, detailed field surveys at six high-priority sites, and hydrodynamic modelling of dam-breach scenarios using FLO-2D. The objectives were to (a) rank the 24 lakes by a normalised multi-parameter hazard index, (b) estimate downstream exposure for the highest-ranked lakes, and (c) simulate worst-case flood propagation to determine arrival times and inundation extents at downstream communities [7] .
Theoretical Background GLOF initiation requires a trigger mechanism that causes the moraine dam to fail, either through overtopping, piping, or seismic shaking [2] . Overtopping is the most common trigger in the Cordillera Blanca and typically results from displacement waves generated when ice or rock avalanches enter the lake. The volume of the displacement wave depends on the mass and velocity of the impacting material, the geometry of the lake basin, and the freeboard (the height difference between the lake surface and the lowest point of the dam crest). Empirical relationships developed by Heller and Hager [8] relate impulse wave height to a dimensionless parameter combining slide volume, slide velocity, and stillwater depth. Once the dam is overtopped, erosion of the unconsolidated moraine proceeds rapidly, widening the breach and releasing the stored water as a flood wave. The downstream flood behaves as a debris flow or hyperconcentrated flow, with bulking factors of 1.5-4.0 as the wave entrains valley-floor sediments [6] . Peak discharge at the breach can be estimated from empirical equations relating it to lake volume and dam height, but numerical models such as FLO-2D provide spatially distributed inundation maps that are more useful for planning.
Material and Methods
Material and Methods
Material
This research was coordinated from the Department of Physical Geography at the School of Geography and Environment, Temuco, Araucanía, Chile, with field campaigns conducted in the Cordillera Blanca between June 2020 and August 2023. Sentinel-2 Level-2A imagery (10 m resolution, 78 cloud-free scenes) and PlanetScope imagery (3 m resolution, 36 scenes) were used to delineate lake boundaries and measure glacier terminus positions for the 24 target lakes. A 12.5 m TanDEM-X digital elevation model served as the topographic base for hydrodynamic modelling. Field surveys at six lakes (Palcacocha, Llaca, Artizon Alto, Rajucolta, Checquiacocha, Tullparaju) measured dam crest elevation and freeboard using differential GPS (Trimble R10, ± 0.02 m vertical accuracy), moraine composition through test pits and grain-size analysis, and seepage flow rates using V-notch weirs.
Seismicity data for the region were obtained from the Peruvian Geophysical Institute catalogue (2010-2023) [9] .
Methods
A normalised hazard index (NHI) was calculated for each lake as the weighted sum of six parameters: lake area (weight 0.20), dam height (0.15), freeboard (0.20), glacier proximity (0.15), moraine stability (0.20), and seismicity index (0.10). Each parameter was normalised to a 0-1 scale using the maximum observed value across the 24-lake population as the upper bound. Moraine stability was scored from field observations (presence of seepage, ice core, grain-size distribution, vegetation cover). A downstream exposure index was computed by overlaying modelled inundation zones with population density grids (WorldPop, 100 m resolution) and infrastructure layers (roads, buildings) from OpenStreetMap. FLO-2D simulations used the Tailings Dam Breach module to model instantaneous and progressive breach scenarios. Rheological parameters for the debris flow were set following O'Brien and Julien [10] : viscosity coefficient 0.0648 Pa•s, yield stress 0.152 Pa, concentration by volume 0.45 for the hyperconcentrated phase.
Simulation Parameters
FLO-2D version 2021.06 was configured with a 25 m grid resolution derived from the TanDEM-X DEM. Manning's roughness values were set at 0.04 for the main channel, 0.06 for floodplain, and 0.10 for densely vegetated slopes. Breach hydrographs were generated using the trapezoidal breach model with breach widths of 20-60 m (calibrated from moraine geometry), breach formation times of 0.5-2.0 hours, and initial lake volumes ranging from 0.8 × 10⁶ m³ to 17.2 × 10⁶ m³ depending on the lake. Sediment bulking was modelled with a volumetric concentration of 0.35-0.50. Simulations were run for 6 hours of physical time with a 0.5-second computational time step and Courant stability criterion of 0.5. Output variables included maximum flow depth, maximum velocity, flood arrival time, and inundation extent at each grid cell [10] . Table 2 shows that Palcacocha produced the highest simulated peak discharge (8,340 m³/s) and the shortest flood arrival time (18 minutes) to the nearest community.
| Lake | Peak Discharge (m³/s) | Flood Arrival (min) | Max Depth at Town (m) | Inundation (km²) |
|---|---|---|---|---|
| Palcacocha | 8,340 | 18 | 5.7 | 4.31 |
| Artizon Alto | 4,120 | 42 | 3.1 | 1.87 |
| Checquiacocha | 3,680 | 27 | 4.2 | 2.14 |
| Rajucolta | 5,470 | 31 | 3.8 | 2.73 |
| Tullparaju | 2,910 | 36 | 2.4 | 1.42 |
| Llaca | 3,240 | 24 | 2.9 | 1.68 |
Table text extracted from the original PDF; superscript letters are shown inline. The original table image is below.
View original table image
Results
Maximum modelled flow depth at the outskirts of Huaraz was 5.7 m, sufficient to cause catastrophic damage to multistorey buildings. Figure 2 pairs the hazard score with the downstream exposure index for all six field-surveyed lakes. The divergence between hazard and exposure is most striking for Artizon Alto (high hazard, low exposure) and Rajucolta (moderate hazard, high exposure), illustrating that risk is not determined by hazard alone.
Comprehensive Interpretation
The hazard index and exposure index together define a risk matrix in which Palcacocha occupies the most dangerous quadrant: high hazard combined with very high downstream exposure. The FLO-2D simulations reinforce this assessment, showing that a Palcacocha breach could deliver flood depths exceeding 5 m to parts of Huaraz within 18 minutes-far too short for an unwarned evacuation. Artizon Alto, though scoring highest on hazard alone, poses less downstream risk because the nearest settlement is 14 km away. These results underscore the importance of combining physical hazard metrics with socioeconomic exposure data when prioritising mitigation investments.
Discussion
The hazard ranking for Palcacocha is consistent with previous assessments by the Peruvian National Water Authority (ANA) and international consultants, who have classified it as the most dangerous glacial lake in Peru [4] . However, this research adds quantitative flood-arrival-time estimates that were not available from earlier semiqualitative assessments. The 18-minute warning window at Palcacocha is shorter than the 25-30 minutes commonly assumed in emergency plans, largely because the FLO-2D model accounts for sediment bulking, which increases the kinetic energy and speed of the flow front [10] . The moraine stability parameter proved to be the single strongest discriminator in the hazard index. Lakes with evidence of active seepage through the dam body and icecored moraines scored consistently higher than those with well-vegetated, consolidated dams. This observation aligns with findings from the Swiss Alps and the Himalayas, where moraine degradation linked to permafrost thaw has been identified as a growing risk factor [11] . A limitation is that the FLO-2D simulations assumed a worst-case instantaneous breach, which gives upper-bound flood estimates. Progressive breach scenarios, in which the moraine erodes over 1-2 hours, produce lower peak discharges but longer flood durations. Real events likely fall between these two extremes [12] . Also, the downstream exposure index used WorldPop gridded population data, which may underestimate informal settlement populations in peri-urban Huaraz [13] .
Conclusion
This research ranked 24 glacial lakes in the Cordillera Blanca by a normalised multi-parameter hazard index and identified three lakes-Artizon Alto, Palcacocha, and Checquiacocha-with hazard scores above 0.70. When downstream exposure was factored in, Palcacocha emerged as the highest-risk lake, with a simulated peak discharge of 8,340 m³/s and a flood arrival time of just 18 minutes to the nearest community. These findings reinforce the urgent need for operational early warning systems, moraine reinforcement, and controlled lake-level lowering at the highest-scoring sites. The assessment framework developed here is transferable to other glaciated ranges and provides a structured basis for prioritising limited mitigation budgets across multiple lakes.
Figures and tables from the paper
| Lake | Area (km²) | Dam Ht (m) | Freeboard (m) | NHI | Exposure Index | Risk Class |
|---|---|---|---|---|---|---|
| Palcacocha | 0.49 | 68 | 7.2 | 0.87 | 0.93 | Very High |
| Artizon Alto | 0.38 | 54 | 4.1 | 0.91 | 0.34 | High |
| Checquiacocha | 0.22 | 41 | 9.8 | 0.71 | 0.61 | High |
| Rajucolta | 0.31 | 47 | 14.3 | 0.54 | 0.72 | Moderate |
| Tullparaju | 0.18 | 38 | 11.6 | 0.66 | 0.55 | Moderate |
| Llaca | 0.27 | 52 | 16.7 | 0.62 | 0.48 | Moderate |
Table text extracted from the original PDF; superscript letters are shown inline. The original table image is below.
View original table image
References
18 in the original paper- Carey M. Living and dying with glaciers: people's historical vulnerability to avalanches and outburst floods in Peru. Global and Planetary Change. 2005;47(2-4):122-134.
- Richardson SD, Reynolds JM. An overview of glacial hazards in the Himalayas. Quaternary International. 2000;65-66:31-47.
- Emmer A, Vilímek V. Review Article: Lake and breach hazard assessment for moraine-dammed lakes: an example from the Cordillera Blanca (Peru). Natural Hazards and Earth System Sciences. 2013;13:15511565.
- Huggel C, Khabarov N, Obersteiner M, Ramírez JM. Implementation and integrated numerical modeling of a landslide early warning system: a pilot study in Colombia. Natural Hazards. 2010;52(2):501-518.
- Guardamino L, Drenkhan F. Glacier lake evolution in the Cordillera Blanca (Peru) between 1990 and 2020 and associated hazard potential. Geomorphology. 2023;421:108516.
- Worni R, Huggel C, Clague JJ, Schaub Y, Stoffel M. Coupling glacial lake impact, dam breach, and flood processes: a modeling perspective. Geomorphology. 2014;224:161-176.
- Bolch T, Peters J, Yegorov A, Pradhan B, Buchroithner M, Blagoveshchensky V. Identification of potentially dangerous glacial lakes in the northern Tien Shan. Natural Hazards. 2011;59(3):1691-1714.
- Heller V, Hager WH. Impulse product parameter in landslide generated impulse waves. Journal of Waterway, Port, Coastal, and Ocean Engineering. 2010;136(3):145-155.
- Vilímek V, Zapata ML, Klimeš J, Patzelt Z, Santillán N. Influence of glacial retreat on natural hazards of the Palcacocha Lake area, Peru. Landslides. 2005;2(2):107115.
- O'Brien JS, Julien PY, Fullerton WT. Two-dimensional water flood and mudflow simulation. Journal of Hydraulic Engineering. 1993;119(2):244-261.
- Haeberli W, Schaub Y, Huggel C. Increasing risks related to landslides from degrading permafrost into new lakes in de-glaciating mountain ranges. Geomorphology. 2017;293:405-417.
- Westoby MJ, Glasser NF, Brasington J, Hambrey MJ, Quincey DJ, Reynolds JM. Modelling outburst floods from moraine-dammed glacial lakes. Earth-Science Reviews. 2014;134:137-159.
- Carey M, Huggel C, Bury J, Portocarrero C, Haeberli W. An integrated socio-environmental framework for glacier hazard management and climate change adaptation: lessons from Lake 513, Cordillera Blanca, Peru. Climatic Change. 2012;112(3-4):733-767.
- Emmer A, Cochachin A. The causes and mechanisms of moraine-dammed lake failures in the Cordillera Blanca, North Peru, and hazard potential evaluation. Natural Hazards and Earth System Sciences. 2013;13:1551-1565.
- Somos-Valenzuela MA, McKinney DC, Rounce DR, Byers AC. Changes in Imja Tsho in the Mount Everest region of Nepal. Cryosphere. 2014;8(5):1661-1671.
- Mergili M, Fischer JT, Krenn J, Pudasaini SP. r.avaflow v1, an advanced open-source computational framework for the propagation and interaction of twophase mass flows. Geoscientific Model Development. 2017;10(2):553-569.
- Rounce DR, Watson CS, McKinney DC. Identification of hazard and risk for glacial lakes in the Nepal Himalaya using satellite imagery from 2000-2015. Remote Sensing. 2017;9(7):654.
- Bajracharya SR, Mool P. Glaciers, glacial lakes and glacial lake outburst floods in the Mount Everest region, Nepal. Annals of Glaciology. 2009;50(53):8186.