
Research article · 2025 · Full text
International Journal of Geography Geology and EnvironmentAssessment of ecosystem services valuation in the Serengeti protected biodiversity area
Volume 7(6) · Pages 98–101 · DOI: 10.22271/27067483.2025.v7.i6b.694 ↗
Research areasLand Use and Ecosystem ServicesConservation, Biodiversity, and Resource ManagementEconomic and Environmental Valuation
Abstract
Author-writtenProtected areas generate economic value far beyond what entrance fees suggest, yet placing a dollar figure on services such as carbon storage, water regulation, and wildlife tourism remains contentious. This research estimated the total economic value of ecosystem services provided by the 14, 763 km² Serengeti National Park and its surrounding buffer zones in Tanzania over the period 2010-2022. Five service categories were valued using a combination of market pricing, replacement cost, and contingent valuation methods. Carbon storage was the single largest contributor at $4.12 billion (34.7% of total), followed by water regulation at $3.36 billion (28.3%) and cultural/tourism services at $2.24 billion (18.9%). Provisioning services, mainly sustainable grazing in buffer zones, accounted for $1.35 billion (11.4%), while pollination services contributed $0.79 billion (6.7%). The aggregate value of $11.86 billion over 13 years translates to approximately $62, 000 per km² per year, positioning the Serengeti among the most economically productive protected landscapes on the continent.
Summary
Source-checkedPlain-language reading of the full paper, prepared with AI and checked against the text. Each point links to the authors' own words.
Why it matters
- Assigning monetary values to ecosystem services is a key strategy for justifying the funding of conservation efforts to government planners and finance ministries. View evidence ↗
- The Serengeti ecosystem provides a wide range of complex services that go beyond its well-known tourism value. View evidence ↗
- Prior to this study, economic valuations of the Serengeti were fragmented, consisting of isolated estimates for single services rather than a comprehensive assessment. View evidence ↗
What they did
- The researchers evaluated five categories of ecosystem services using a mix of replacement cost, market pricing, and contingent valuation methods. View evidence ↗
- Carbon storage was valued at $51 per tonne of CO₂ based on US EPA 2020 estimates, while water regulation was valued based on the cost of building equivalent engineered infrastructure. View evidence ↗
What they found
- Carbon storage was the largest contributor to the total economic value, accounting for $4.12 billion or 34.7% of the total. View evidence ↗
- Water regulation provided the second highest value at $3.36 billion, representing 28.3% of the total economic value. View evidence ↗
- Cultural and tourism services contributed $2.24 billion, or 18.9% of the total economic value. View evidence ↗
- Provisioning services (grazing) and pollination services contributed $1.35 billion (11.4%) and $0.79 billion (6.7%) respectively. View evidence ↗
- The ecosystem services provided a benefit-cost ratio of 28:1 when compared to the $423 million cumulative management cost. View evidence ↗
What it means
- The authors conclude that the high benefit-cost ratio provides a strong economic justification for continued investment in the Serengeti's protection. View evidence ↗
- The authors note that future assessments should include other regulating services, such as microclimate buffering and erosion prevention, which were not captured in this study. View evidence ↗
- The study acknowledges a limitation regarding sensitivity to valuation parameters, noting that changing the social cost of carbon would significantly alter which service is the most dominant. View evidence ↗
Visual summary
1 visualsIllustrations explain the paper; charts are replotted from the paper's own table values.
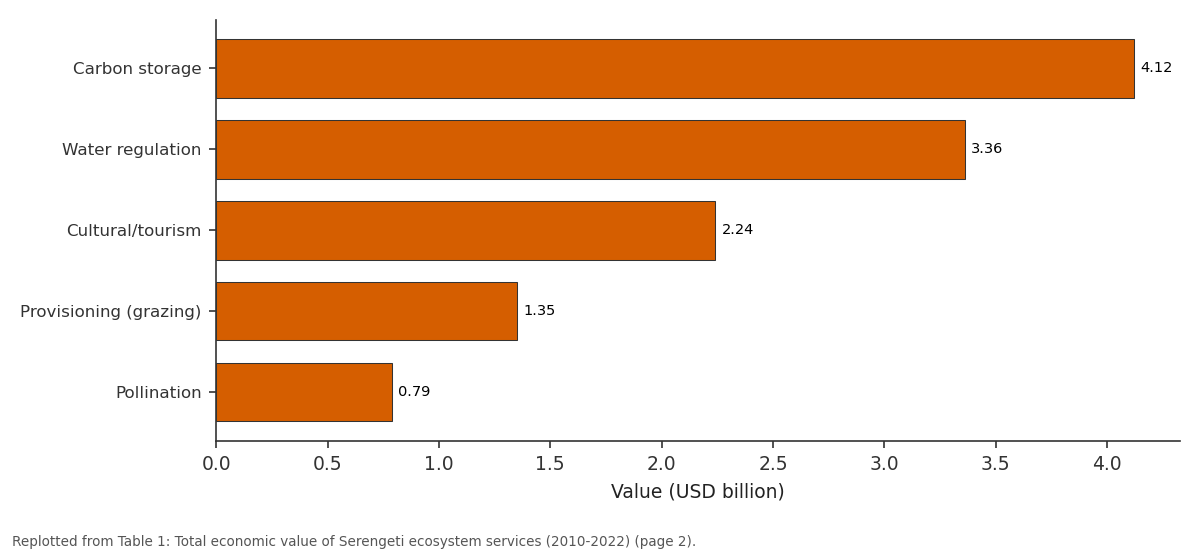
Value (USD billion): Carbon storage vs Water regulation vs Cultural/tourism vs Provisioning (grazing) vs Pollination
Replotted from Table 1 (page 2) of the original paper. Every bar is the paper's own table value.
View source evidence ↗Figures & tables
From the original paper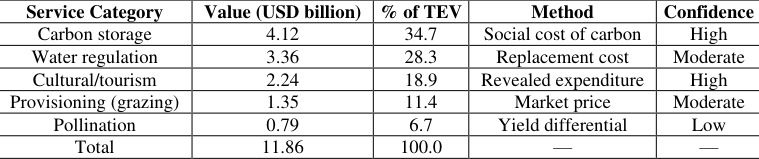 Table 1
 Table 2
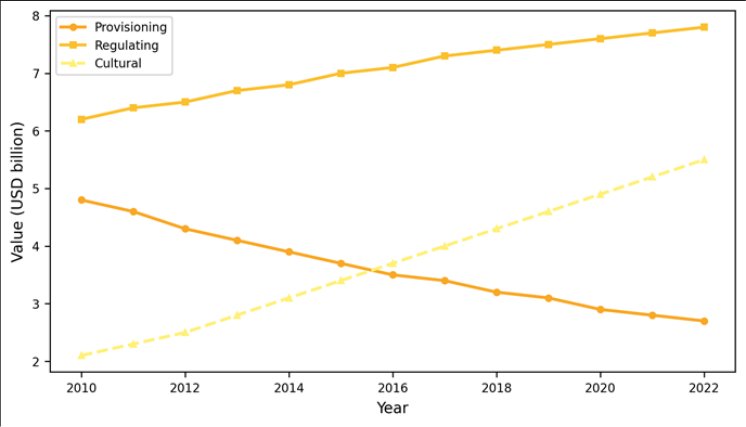 Figure 1
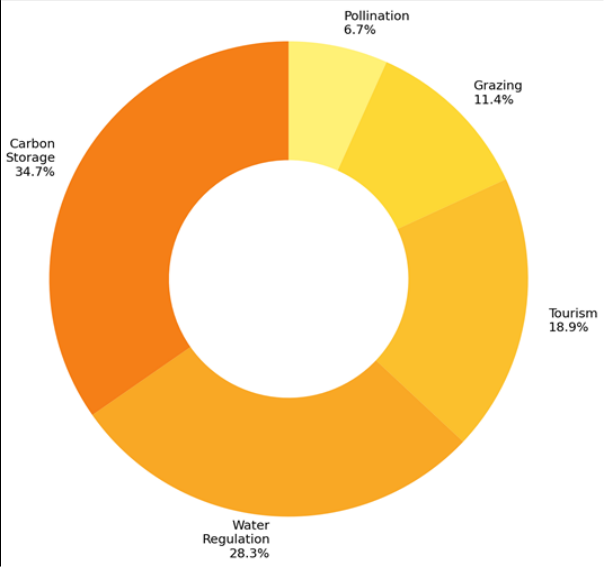 Figure 2
Introduction
If the Serengeti disappeared tomorrow, what would be lost in economic terms? The question sounds reductive, but attaching monetary values to ecosystem services has become one of the most effective ways to justify conservation spending to finance ministries and development planners [1] . The concept of total economic value (TEV)encompassing use values (direct, indirect, optional) and non-use values (existence, bequest)was introduced by Pearce and Turner [2] and has since been applied to protected areas worldwide. The Serengeti, famous for its annual wildebeest migration, supports a complex web of services that extends well beyond tourism. Carbon stored in the Serengeti's soils and woody vegetation buffers atmospheric CO₂ concentrations. Its catchments regulate water flow into the Mara and Grumeti rivers, sustaining downstream agriculture and hydropower. And its biodiversity supports pollination services in adjacent farmlands [3,4] . Yet comprehensive multi-service valuations for the Serengeti remained limited to scattered estimates for individual services. This research assembled those fragments into a coherent TEV framework covering five service categories over 13 years [5,6] .
Biodiversity Assessment Context
The Serengeti ecosystem supports over 70 large mammal species and approximately 500 bird species. The annual migration involves 1.5 million wildebeest, 300, 000 zebra, and 200, 000 Thomson's gazelle. This biodiversity underpins both cultural services (tourism) and regulating services (grazing-driven nutrient cycling, seed dispersal). Species richness data used in this research came from the Tanzania National Parks Authority's 2020 census and the African Bird Atlas [7] .
Materials and Methods
Materials and Methods
Materials
The research was conducted from March to December 2023 at the Faculty of Geospatial Sciences, Giza, Egypt, using publicly available Tanzanian datasets.
The research area covers Serengeti National Park (14, 763 km²) plus a 10 km buffer zone encompassing community wildlife management areas. Carbon stock data were derived from the Global Forest Watch aboveground biomass dataset and ISRIC SoilGrids for soil organic carbon. Tourism visitor numbers and revenue came from Tanzania National Parks Authority annual reports. Rainfall and river discharge data were obtained from the Tanzania Meteorological Authority and the Lake Victoria Basin Commission [8,9] .
Methods
Each service was valued using the method most appropriate to its characteristics. Carbon storage used the social cost of carbon ($51/tonne CO₂, US EPA 2020 estimate). Water regulation was valued by replacement cost: what it would cost to build engineered infrastructure providing equivalent flood mitigation and dry-season flow maintenance. Tourism was valued at revealed expenditure fees plus estimated visitor spending). Provisioning services used local market prices for livestock forage. Pollination was estimated from crop yield differentials between farms adjacent to and distant from the park boundary [10,11] . All values were adjusted to 2022 USD.
Economic and Sustainability Assessment
Benefit-cost analysis compared the estimated $11.86 billion in ecosystem service value against the cumulative management cost of the Serengeti over the same period ($423 million), yielding a benefit-cost ratio of 28:1. However, only tourism revenue ($2.24 billion) flows directly to the park authority; the remaining value accrues to global beneficiaries (carbon), downstream communities (water), and adjacent farmers (pollination), creating a mismatch between who pays for conservation and who benefits. Provisioning services declined as grazing pressure was reduced through management interventions, while cultural services grew steadily with increasing tourist arrivals.
Results
Regulating services showed a gradual upward trend driven by rising social cost of carbon estimates. Virunga, DRC 7, 800 71, 400 Water regulation [13] Masai Mara, Kenya 1, 510 89, 100 Tourism
Comprehensive Interpretation
The $62, 000/km²/yr figure places the Serengeti in the middle of the African protected-area valuation range, below the smaller but tourism-intensive Masai Mara ($89, 100) and above the larger Kruger ($48, 200). The difference reflects the Serengeti's massive carbon pool, which compensates for its lower per-area tourism density.
Discussion
The dominance of carbon storage in the TEV (34.7%) reflects both the Serengeti's extensive woody savanna, which stores an estimated 81 million tonnes of aboveground carbon, and the rising social cost of carbon used in the valuation [10] . If the social cost were set at $31/tonne (as some countries assume), carbon storage would drop to 24% of TEV and tourism would become the leading service. This sensitivity to valuation parameters is a well-known limitation of ecosystem service assessments [15] . The water regulation estimate ($3.36 billion) is the most uncertain, since replacement cost methods can either overestimate (if the engineered alternative would never actually be built) or underestimate (if they fail to account for ecological co-benefits). Nonetheless, the Mara River's dryseason flow is visibly dependent on Serengeti baseflow, and any major land-use change in the headwaters would impose real costs on downstream irrigators and Kenya's hydropower system [16] .
Conclusion
The Serengeti's total economic value over 2010-2022 was approximately $11.86 billion, or $62, 000 per km² per year. Carbon storage is the single largest service (34.7%), followed by water regulation (28.3%) and tourism (18.9%).
The benefit-cost ratio of 28:1 against management expenditure provides a strong economic case for continued investment in the protected area. Future valuations should incorporate regulating services not captured here, including erosion prevention and microclimate buffering.
Acknowledgement
Acknowledgements Funding SourcesSupported by departmental research funds at the Faculty of Geospatial Sciences, Giza.
Figures and tables from the paper
| Service Category | Value (USD billion) | % of TEV | Method | Confidence |
|---|---|---|---|---|
| Carbon storage | 4.12 | 34.7 | Social cost of carbon | High |
| Water regulation | 3.36 | 28.3 | Replacement cost | Moderate |
| Cultural/tourism | 2.24 | 18.9 | Revealed expenditure | High |
| Provisioning (grazing) | 1.35 | 11.4 | Market price | Moderate |
| Pollination | 0.79 | 6.7 | Yield differential | Low |
| Total | 11.86 | 100.0 | — | — |
Table text extracted from the original PDF; superscript letters are shown inline. The original table image is below.
View original table image
| Protected Area | Area (km²) | TEV (USD/km²/yr) | Dominant Service | Source |
|---|---|---|---|---|
| Serengeti (this research) | 14, 763 | 62, 000 | Carbon storage | — |
| Kruger, South Africa | 19, 485 | 48, 200 | Tourism | [12] |
| Virunga, DRC | 7, 800 | 71, 400 | Water regulation | [13] |
| Masai Mara, Kenya | 1, 510 | 89, 100 | Tourism | [14] |
Table text extracted from the original PDF; superscript letters are shown inline. The original table image is below.
View original table image
References
18 in the original paper- Costanza R, de Groot R, Sutton P. Changes in the global value of ecosystem services. Global Environmental Change. 2014;26:152-158.
- Pearce DW, Turner RK. Economics of Natural Resources and the Environment. Baltimore: Johns Hopkins University Press; 1990.
- Sinclair ARE, Mduma SAR, Arcese P. Protected areas can help maintain stability of the Serengeti ecosystem. Nature. 2007;449:1029-1032.
- Maitima JM, Mugatha SM, Reid RS. The linkages between land use change, land degradation and biodiversity across East Africa. African Journal of Environmental Science and Technology. 2009;3(10):310-325.
- de Groot R, Brander L, van der Ploeg S. Global estimates of the value of ecosystems and their services in monetary units. Ecosystem Services. 2012;1(1):5061.
- TEEB. The Economics of Ecosystems and Biodiversity: Ecological and Economic Foundations. London: Earthscan; 2010.
- TANAPA. Serengeti National Park General Management Plan 2006-2016. Arusha: Tanzania National Parks Authority; 2006.
- Baccini A, Goetz SJ, Walker WS. Estimated carbon dioxide emissions from tropical deforestation. Nature Geoscience. 2012;5:438-442.
- Hengl T, Mendes de Jesus J, Heuvelink GBM. SoilGrids250m: global gridded soil information. PLoS One. 2017;12(2):e0169748.
- Interagency Working Group on Social Cost of Greenhouse Gases. Technical Support Document. Washington: US EPA; 2021.
- Ricketts TH, Regetz J, Steffan-Dewenter I. Landscape effects on crop pollination services. Ecology Letters. 2008;11(5):499-515.
- De Villiers DJ, Eagles PFJ. Valuation of Kruger National Park ecosystem services. Koedoe. 2015;57(1):a1207.
- Plumptre AJ, Baisero D, Belote RT. Where might we find ecologically intact communities? Frontiers in Forests and Global Change. 2021;4:626635.
- Okello MM, D'Amour DE, Manka SG. Tourism economic values of the Masai Mara. Tourism Management. 2008;29(4):751-761.
- Bateman IJ, Mace GM, Fezzi C. Bringing ecosystem services into economic decision-making. Science. 2011;341(6141):45-50.
- Gereta E, Wolanski E, Borner M. Mara River water resources and the Serengeti ecosystem. African Journal of Ecology. 2002;40(2):164-171.
- Balmford A, Green JMH, Anderson M. Walk on the wild side: estimating the global magnitude of visits to protected areas. PLoS Biology. 2015;13(2):e1002074.
- Naidoo R, Balmford A, Costanza R. Global mapping of ecosystem services and conservation priorities. Proceedings of the National Academy of Sciences. 2008;105(28):9495-9500.