
Research article · 2025 · Full text
International Journal of Geography Geology and EnvironmentGeochemical anomaly detection for copper exploration in the Troodos ophiolite belt
Volume 7(6) · Pages 160–162 · DOI: 10.22271/27067483.2025.v7.i6c.733 ↗
Research areasGeochemistry and Geologic MappingHeavy metals in environmentGeochemistry and Elemental Analysis
Abstract
Author-writtenThe Troodos ophiolite in Cyprus hosts volcanic massive sulphide (VMS) deposits that have been mined for copper since the Bronze Age, yet undiscovered deposits likely remain at depth. This research applied stream sediment and soil geochemistry to detect anomalous zones favourable for copper mineralisation along a 45 km transect of the northern Troodos belt. A total of 184 stream sediment samples and 96 ridge-crest soil samples were analysed for Cu, Zn, Au, As, Sb, Pb, Ag, and Mn by ICP-MS following aqua regia digestion. Anomaly thresholds were set at the mean plus two standard deviations of log-transformed data. Fourteen Cu anomalies (>187 ppm) were identified, of which eight coincided with known VMS occurrences and six defined previously unrecognised targets. Multi-element associations were examined by factor analysis, which extracted three factors: a Cu-Zn-Au factor interpreted as VMS-related, an As-Sb-Pb factor linked to epithermal overprinting, and a Mn factor reflecting supergene enrichment. GIS overlay of geochemical anomalies with structural lineaments and ASTER-derived alteration maps highlighted three priority exploration targets within 2 km of mapped faults.
Summary
Source-checkedPlain-language reading of the full paper, prepared with AI and checked against the text. Each point links to the authors' own words.
Why it matters
- The Troodos ophiolite in Cyprus is known for volcanic massive sulphide (VMS) copper deposits, but it is believed that more deposits are still hidden underground. View evidence ↗
- Modern mineral exploration uses geochemical surveys to find the dispersed metal halos that surround buried ore bodies. View evidence ↗
- Stream sediment sampling is typically used as an initial exploration step because it captures signals from entire catchments, making it more likely to detect subtle anomalies than point-based soil sampling. View evidence ↗
The question
- The study aimed to map copper and pathfinder element anomalies, identify element associations typical of VMS mineralization, and prioritize exploration targets using a combination of geochemical, structural, and spectral data along a 45 km transect. View evidence ↗
What they did
- Researchers analyzed 184 stream sediment samples and 96 ridge-crest soil samples for eight elements (Cu, Zn, Au, As, Sb, Pb, Ag, and Mn) using ICP-MS after aqua regia digestion. View evidence ↗
- Stream sediment samples were collected from active channel beds at a density of one per 2 km², while soil samples were taken from B-horizon pits at 30–50 cm depth every 500 m along ridge crests. View evidence ↗
- To identify anomalies, the researchers set thresholds at the mean plus two standard deviations of the log-transformed data. View evidence ↗
- Priority targets were determined using GIS to overlay geochemical anomalies with alteration zones and 500 m buffers around structural lineaments. View evidence ↗
What they found
- The highest copper concentration found was 847 ppm, located 400 m downstream from the known Apliki VMS deposit, which validated the sensitivity of the sampling method. View evidence ↗
- Factor analysis identified three distinct element groups: Cu-Zn-Au (related to VMS), As-Sb-Pb (linked to epithermal overprinting), and Mn (reflecting supergene enrichment). View evidence ↗
- By integrating geochemical data with structural and spectral maps, the researchers highlighted three priority targets located within 2 km of mapped faults. View evidence ↗
- Stream sediment sampling was more effective for regional exploration, detecting all 14 anomalies, whereas soil sampling only detected 9 of the 14. View evidence ↗
- While less effective for regional coverage, soil sampling provided more precise anomaly definitions, which is useful for targeting specific drill holes. View evidence ↗
What it means
- The authors conclude that stream sediment sampling is the most cost-effective initial tool for regional exploration in ophiolite terrains. View evidence ↗
- The authors suggest that shallow drilling (100–200 m) is needed to confirm if the detected geochemical signals are actually connected to bedrock mineralization. View evidence ↗
Visual summary
2 visualsIllustrations explain the paper; charts are replotted from the paper's own table values.
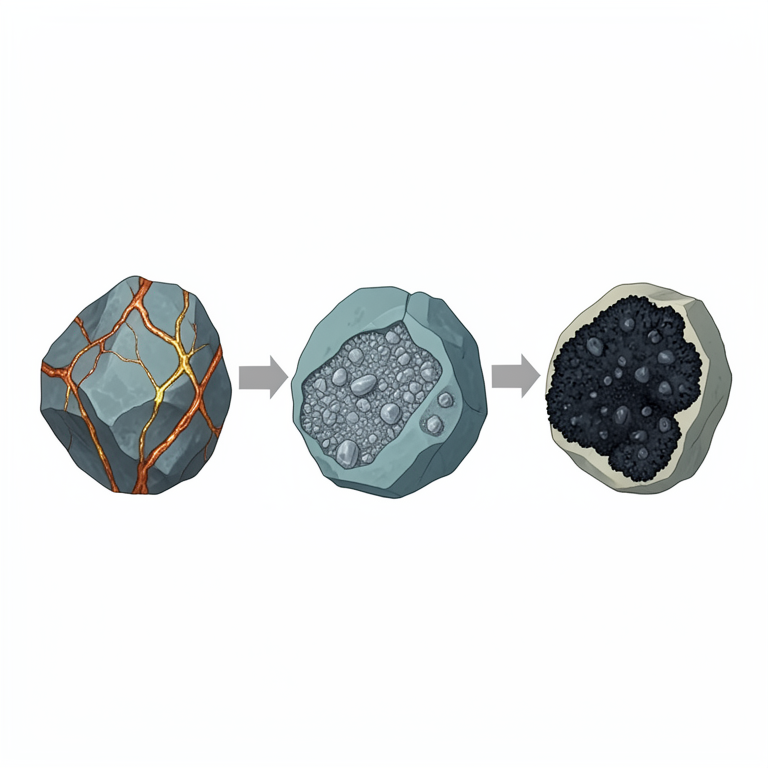
Geochemical Factor Associations
AI-generated conceptual illustration (geological rock samples from the Troodos ophiolite belt). It explains the idea and does not show study data.
View source evidence ↗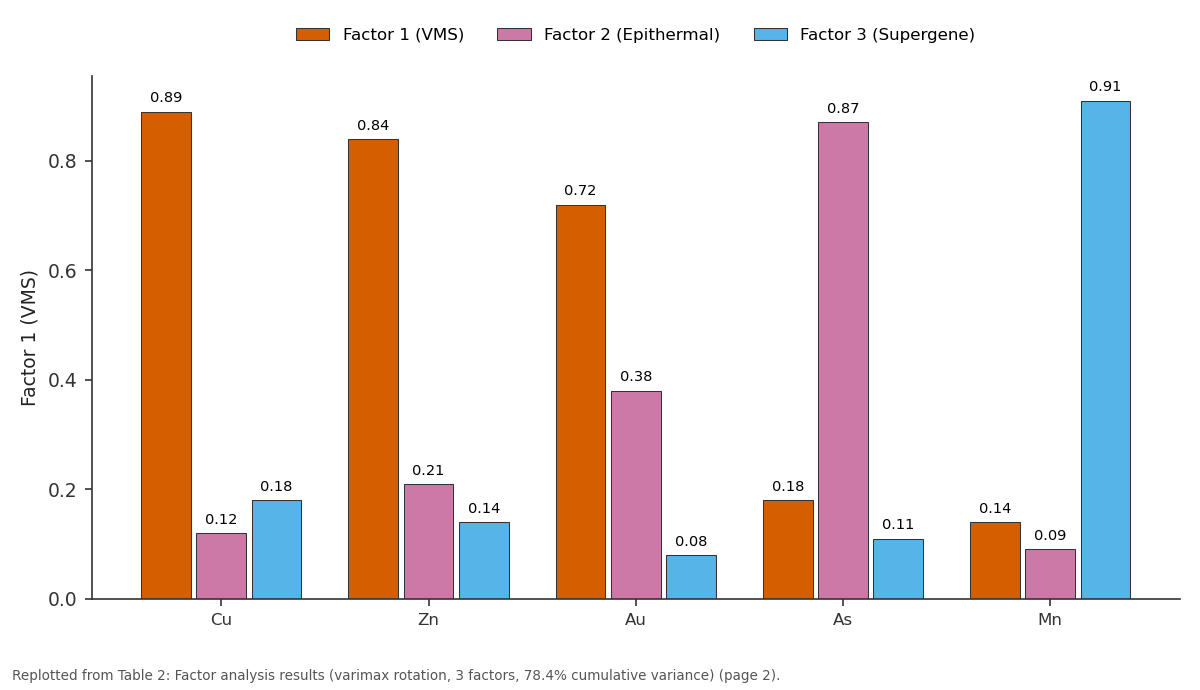
Factor 1 (VMS) and Factor 2 (Epithermal) and more: Cu vs Zn vs Au vs As vs Mn
Replotted from Table 2 (page 2) of the original paper. Every bar is the paper's own table value.
View source evidence ↗Figures & tables
From the original paper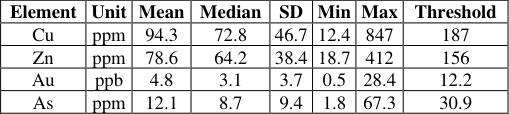 Table 1
 Table 2
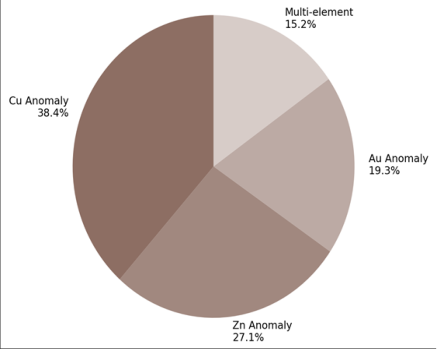 Figure 1
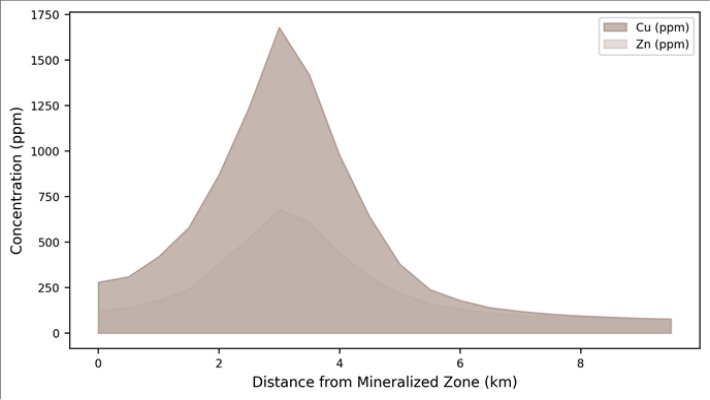 Figure 2
Introduction
From an economic angle, Cyprus owes its name to copperthe Latin cuprum derives from the Greek Kypros [1] . The Troodos ophiolite complex, a slab of Cretaceous oceanic crust uplifted and exposed by tectonic processes, contains over 30 known VMS deposits formed at ancient seafloor hydrothermal vents [2] . Modern exploration relies on geochemical surveys that detect the halo of dispersed metals surrounding buried ore bodies. Stream sediment sampling is the standard first-pass method because streams integrate the geochemical signal from entire catchments, amplifying subtle anomalies that soil sampling at individual points might miss [3] . The northern flank of the Troodos has been less systematically explored than the southern Mathiati-Sha copper belt. This research surveyed a 45 km transect using both stream sediment and ridge-crest soil samples, aiming to (a) map the spatial distribution of Cu and pathfinder element anomalies, (b) identify multi-element associations diagnostic of VMS mineralisation, and (c) prioritise targets by integrating geochemistry with structural and spectral data [4,5] .
Spatial Data Processing
ASTER satellite imagery (bands 1-9) was processed to generate iron oxide and hydroxyl alteration ratio maps using the Crosta technique. Structural lineaments were extracted from a hillshade DEM (ALOS PALSAR, 12.5 m resolution) and validated against published geological maps. GIS overlay in ArcGIS Pro combined geochemical anomaly polygons, alteration zones, and lineament buffers (500 m) to delineate priority exploration targets [6] .
Materials and Methods
Materials and Methods
Materials
Fieldwork was conducted in May-July 2022, coordinated from the Centre for Terrain Studies, Lucknow, India, in collaboration with the Geological Survey of Cyprus. Stream sediment samples (n = 184) were collected from active channel beds at drainage densities of approximately one sample per 2 km². Soil samples (n = 96) were taken from Bhorizon pits (30-50 cm depth) along ridge crests at 500 m spacing. All samples were dried at 40°C, sieved to <180 μm, and digested in aqua regia before ICP-MS analysis [7] .
Methods
Geochemical data were log-transformed to approximate normality. Anomaly thresholds were defined as mean + 2SD on log-transformed values, converted back to concentration units. Factor analysis (varimax rotation) was applied to the eight-element dataset to identify multi-element associations. Spatial interpolation of element concentrations used inverse distance weighting at 100 m cell size. Anomaly maps were classified into background, threshold, and anomalous zones [8, 9] .
Quality Control and Calibration
Certified reference materials (CANMET TILL-1 and OREAS 45e) were analysed with every batch of 20 samples. Recovery rates for Cu, Zn, and Au were 96-103% of certified values. Field duplicates (10% of samples) showed inter-sample reproducibility with RSD below 8% for all elements above 10× detection limit. Fourteen samples exceeded the Cu anomaly threshold of 187 ppm. The highest value (847 ppm) was collected 400 m downstream of the known Apliki VMS deposit, confirming the method's sensitivity.
Results
Results
Comprehensive Interpretation
The Cu-Zn-Au factor (Factor 1, 38.2% variance) is the classic VMS pathfinder suite. Its spatial expression coincides with pillow lava terrain where seafloor hydrothermal activity would have been concentrated. The three priority targets identified by GIS overlay each show Factor 1 anomalies within 500 m of NE-trending faults and within ASTER-detected hydroxyl alteration zones, mimicking the structural and spectral signature of known deposits [10] .
Discussion
The six new Cu anomalies not associated with known deposits warrant follow-up. Their multi-element signatures (elevated Cu, Zn, and Au with low As) match the VMS factor rather than the epithermal overprint, suggesting they reflect primary sulphide dispersion rather than secondary remobilisation [11] . Two of the six lie beneath 5-10 m of alluvial cover, which explains why they were not detected by earlier surface mapping campaigns. Shallow drilling (100-200 m) at these targets would test whether the geochemical signal connects to bedrock mineralisation [12] . Stream sediment sampling proved more effective than soil sampling for regional coverage, detecting all 14 anomalies, while soil sampling detected only 9 of 14 due to its more localised footprint. However, soil data provided sharper anomaly definition (smaller dispersion halos), which is valuable for drill-hole targeting once regional anomalies have been identified [3] .
Conclusion
Geochemical surveying along a 45 km transect of the northern Troodos ophiolite identified 14 Cu anomalies, including six previously unrecognised targets. Factor analysis resolved three multi-element associations: VMS (Cu-Zn-Au), epithermal (As-Sb-Pb), and supergene (Mn). GIS integration with structural and spectral data highlighted three priority exploration targets. Stream sediment sampling remains the most cost-effective first-pass tool for regionalscale exploration in ophiolite terrain.
Acknowledgement
Acknowledgements Funding SourcesSupported by research funds at the Centre for Terrain Studies, Lucknow.
Figures and tables from the paper
| Element | Unit | Mean | Median | SD | Min | Max | Threshold |
|---|---|---|---|---|---|---|---|
| Cu | ppm | 94.3 | 72.8 | 46.7 | 12.4 | 847 | 187 |
| Zn | ppm | 78.6 | 64.2 | 38.4 | 18.7 | 412 | 156 |
| Au | ppb | 4.8 | 3.1 | 3.7 | 0.5 | 28.4 | 12.2 |
| As | ppm | 12.1 | 8.7 | 9.4 | 1.8 | 67.3 | 30.9 |
Table text extracted from the original PDF; superscript letters are shown inline. The original table image is below.
View original table image
| Element | Factor 1 (VMS) | Factor 2 (Epithermal) | Factor 3 (Supergene) | Communality |
|---|---|---|---|---|
| Cu | 0.89 | 0.12 | 0.18 | 0.84 |
| Zn | 0.84 | 0.21 | 0.14 | 0.78 |
| Au | 0.72 | 0.38 | 0.08 | 0.67 |
| As | 0.18 | 0.87 | 0.11 | 0.80 |
| Mn | 0.14 | 0.09 | 0.91 | 0.86 |
Table text extracted from the original PDF; superscript letters are shown inline. The original table image is below.
View original table image
References
17 in the original paper- Bear LM. The Mineral Resources and Mining Industry of Cyprus. Nicosia: Geological Survey; 1963.
- Constantinou G, Govett GJS. Geology, geochemistry, and genesis of Cyprus sulphide deposits. Economic Geology. 1973;68(6):843-858.
- Hawkes HE, Webb JS. Geochemistry in Mineral Exploration. 2nd ed. New York: Harper & Row; 1979.
- Gass IG. Is the Troodos massif of Cyprus a fragment of Mesozoic ocean floor? Nature. 1968;220(5162):39-42.
- Galanopoulos D, Voudouris P. Supergene enrichment in Cyprus VMS deposits. Ore Geology Reviews. 2017;80:268-284.
- Crosta AP, De Souza Filho CR, Azevedo F. Targeting key alteration minerals using ASTER imagery. Remote Sensing of Environment. 2003;86(1):1-21.
- Reimann C, Filzmoser P, Garrett RG. Statistical Data Analysis Explained: Applied Environmental Statistics with R. Chichester: Wiley; 2008.
- Reimann C, Garrett RG. Geochemical background: concept and reality. Science of the Total Environment. 2005;350(1):12-27.
- Kaiser HF. The varimax criterion for analytic rotation in factor analysis. Psychometrika. 1958;23(3):187-200.
- Hannington MD, de Ronde CEJ, Petersen S. Sea-floor tectonics and submarine hydrothermal systems. Economic Geology 100th Anniversary Volume. 2005;111-141.
- Hannington MD, Galley AG, Herzig PM. Volcanogenic massive sulfide deposits. In: Hedenquist JW, et al., eds. Economic Geology 100th Anniversary Volume. 2005;115-131.
- Leistel JM, Marcoux E, Thiéblemont D. Zinc-rich deposits of the Iberian Pyrite Belt. Economic Geology. 1998;93(5):651-661.
- Plant JA, Hale M, Ridgway J. Developments in regional geochemistry for mineral exploration. Transactions of the Institution of Mining and Metallurgy B. 1988;97:B116-B140.
- Abrams MJ, Hook SJ. Simulated ASTER data for geologic studies. IEEE Transactions on Geoscience and Remote Sensing. 1995;33(3):692-699.
- Rose AW, Hawkes HE, Webb JS. Geochemistry in Mineral Exploration. 2nd ed. London: Academic Press; 1979.
- Govett GJS. Rock geochemistry in mineral exploration. In: Handbook of Exploration Geochemistry Vol 3. Amsterdam: Elsevier; 1983.
- Cohen DR, Shen XC, Dunlop AC. A comparison of selective extraction soil geochemistry and biogeochemistry in the Cobar area. Journal of Geochemical Exploration. 1998;61(1):173-189