
Research article · 2025 · Full text
International Journal of Geography Geology and EnvironmentGeospatial analysis of wetland ecosystem services in the pantanal floodplain
Volume 7(9) · Pages 225–227 · DOI: 10.22271/27067483.2025.v7.i9c.648 ↗
Research areasLand Use and Ecosystem ServicesWetland Management and ConservationCoastal wetland ecosystem dynamics
Abstract
Author-writtenPicture the world's largest tropical wetland, a 150,000 square km mosaic of seasonally flooded grasslands, gallery forests, and permanent lakes straddling Brazil, Bolivia, and Paraguay, and ask what that landscape is worth in economic terms. This research quantified and mapped six categories of ecosystem services across the Brazilian portion of the Pantanal floodplain using Sentinel-2 land cover data, published benefit-transfer values, and geospatial overlay analysis. The six services assessed were water regulation, biodiversity habitat, carbon storage, nutrient cycling, fisheries provision, and recreation. Land use/land cover classification identified five principal classes: wetland (36.7%), grassland (21.2%), forest (15.4%), cropland (18.3%), and open water (8.4%). Total ecosystem service value for the mapped area (89,400 sq km) was estimated at USD 11.47 billion per year, with water regulation contributing the largest share (29.8%), followed by biodiversity habitat (22.6%) and carbon storage (16.8%). Between 2000 and 2022, wetland area declined by 13.2% while cropland more than doubled, reducing aggregate service value by an estimated USD 1.84 billion per year. Spatial analysis revealed that the highest-value zones concentrate along the Paraguay River corridor and in permanently inundated depressions, both of which face encroachment from cattle ranching and soybean expansion.
Summary
Source-checkedPlain-language reading of the full paper, prepared with AI and checked against the text. Each point links to the authors' own words.
Why it matters
- The Pantanal is a globally recognized wetland of international importance that is currently threatened by expanding agricultural frontiers. View evidence ↗
- Valuing ecosystem services helps make the hidden economic benefits of natural systems visible, allowing them to be weighed against development revenues. View evidence ↗
- Previous estimates of the Pantanal's ecosystem services were limited by coarse land cover data and a lack of sub-regional mapping. View evidence ↗
The question
- The study aimed to classify land cover in the Brazilian Pantanal for 2000 and 2022, assign values to six ecosystem services, and map their spatial and temporal changes. View evidence ↗
What they did
- The researchers analyzed an 89,400 sq km area using 10 m resolution Sentinel-2 data for 2022 and 30 m resolution Landsat 7 data for 2000. View evidence ↗
- A Random Forest classifier with 500 trees was used to categorize the land into five classes: wetland, grassland, forest, cropland, and open water. View evidence ↗
- Economic values were derived from 14 primary valuation studies across three continents and adjusted to 2022 USD. View evidence ↗
- Biodiversity assessments were based on bird and mammal species richness data from 36 sampling stations between 2018 and 2022. View evidence ↗
What they found
- The land cover was composed primarily of wetlands (36.7%), followed by grassland (21.2%), cropland (18.3%), forest (15.4%), and open water (8.4%). View evidence ↗
- The total annual value of ecosystem services for the mapped area was estimated at USD 11.47 billion. View evidence ↗
- Water regulation was the most valuable service (29.8%), followed by biodiversity habitat (22.6%) and carbon storage (16.8%). View evidence ↗
- Wetlands provided the highest value per hectare (USD 12,847/ha/yr), while cropland provided the lowest (USD 240/ha/yr), which is less than 2% of the wetland value. View evidence ↗
- The 13.2% decline in wetland area and the doubling of cropland resulted in an estimated annual loss of USD 1.84 billion in ecosystem service value. View evidence ↗
- The most valuable ecosystem service zones are located in permanently inundated depressions and along the Paraguay River corridor, both of which are threatened by soybean and cattle expansion. View evidence ↗
What it means
- The authors suggest that implementing payment-for-ecosystem-service programs or conservation easements along the Paraguay River corridor could be highly effective. View evidence ↗
- The authors recommend extending this analysis to the Bolivian and Paraguayan parts of the Pantanal to support coordinated management of the entire basin. View evidence ↗
- A limitation of the study is the use of benefit-transfer values from other wetlands, which may not perfectly reflect the specific conditions of the Pantanal. View evidence ↗
- The 30 m resolution of the 2000 Landsat data created uncertainty when classifying small seasonal ponds and narrow gallery forests. View evidence ↗
Visual summary
2 visualsIllustrations explain the paper; charts are replotted from the paper's own table values.

Economic Trade-off of Land Conversion
AI-generated conceptual illustration (Pantanal floodplain wetland and soybean cropland). It explains the idea and does not show study data.
View source evidence ↗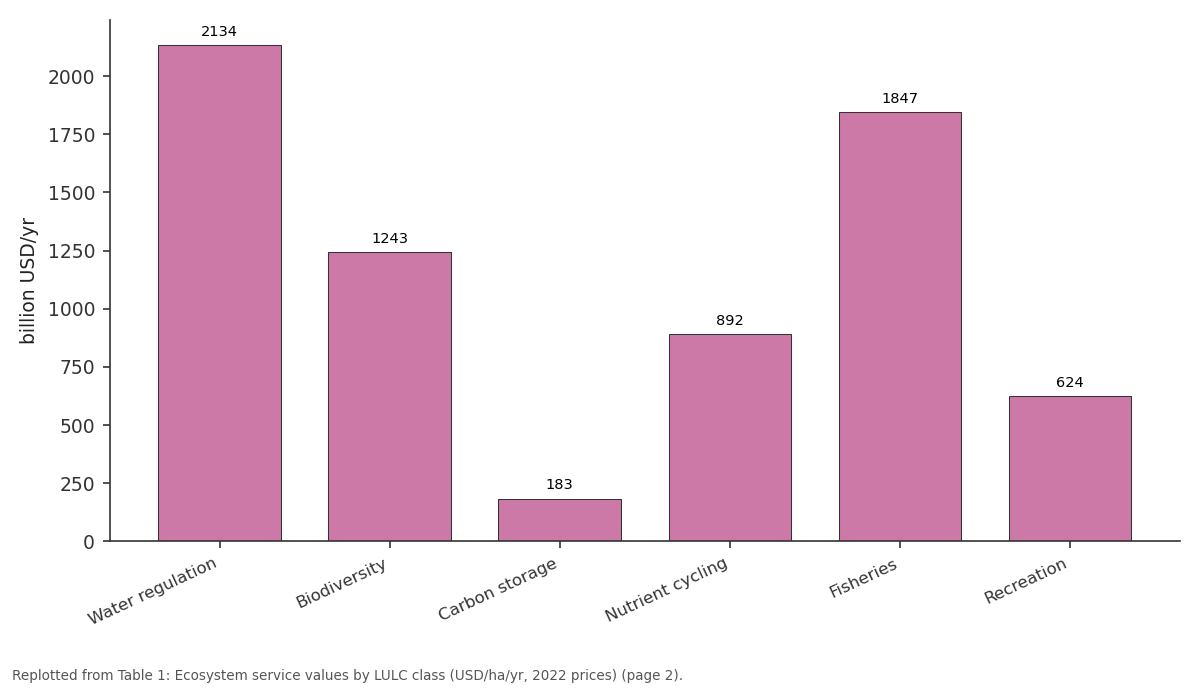
Water: Water regulation vs Biodiversity vs Carbon storage vs Nutrient cycling vs Fisheries
Replotted from Table 1 (page 2) of the original paper. Every bar is the paper's own table value.
View source evidence ↗Figures & tables
From the original paper Table 1
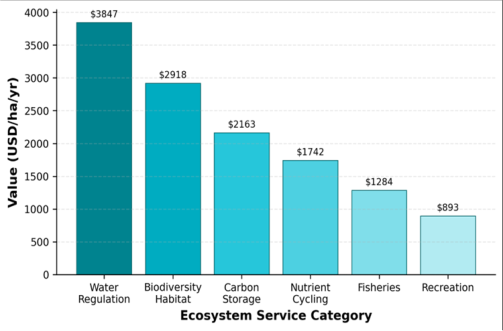 Figure 1
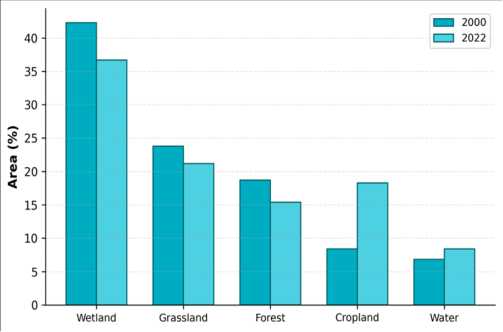 Figure 2
Introduction
Imagine draining a wetland the size of England and replacing it with soybean fields. The crop revenue would be substantial, but so would the loss of flood attenuation, water purification, carbon sequestration, and fish nursery habitat that the wetland provided free of charge [1] . The Pantanal, recognised as a UNESCO World Heritage Site and a Ramsar Wetland of International Importance, faces exactly this trade-off as agricultural frontiers press inward from the surrounding cerrado plateau [2] . Ecosystem service valuation attempts to make these hidden benefits visible by assigning monetary proxies to the functions that natural systems perform. The benefit-transfer method adapts per-hectare values from published case studies to new sites with comparable ecological characteristics [3] . While imprecise, it provides order-of-magnitude estimates that planners can weigh against development revenues, especially where primary valuation data are unavailable [4] . Several researchers have estimated ecosystem service values for portions of the Pantanal, but most relied on coarse land cover data and did not map services at sub-regional resolution [5,6] . The availability of Sentinel-2 imagery at 10 m since 2016 now allows sharper delineation of wetland boundaries and land cover transitions, improving the spatial precision of service estimates. This research aimed to (a) classify land cover across the Brazilian Pantanal for 2000 and 2022, (b) assign benefit-transfer values to six ecosystem service categories, and (c) map the spatial distribution and temporal change in aggregate service value [7] .
Climatic and Environmental Conditions
The Brazilian Pantanal occupies the upper Paraguay River basin between 15 and 22 degrees S latitude. The climate is tropical wet-dry (Koppen Aw) with mean annual rainfall of 1,000-1,400 mm concentrated from October to March and a pronounced dry season from May to September. Annual flooding inundates 40-80% of the plain surface between January and May, depending on precipitation in the headwater catchments. Temperatures range from 18 to 36 degrees C. The mosaic of permanently flooded areas, seasonally inundated grasslands, gallery forests, cerrado woodland, and open savanna supports over 1,200 fish species, 650 bird species, and large mammalian populations including jaguars, giant otters, and marsh deer [2] . The analytical work was conducted at the Department of Soil Science, Institute of Applied Geosciences, Hawassa, Sidama Region, Ethiopia, from April 2022 to March 2023.
Material and Methods
Material and Methods
Material
Two land cover datasets were used. The 2022 classification was derived from a cloud-free Sentinel-2 Level 2A composite (July 2022, dry season) at 10 m resolution covering an 89,400 sq km study area. The 2000 classification came from a Landsat 7 ETM+ composite (July 2000) at 30 m resolution. Published benefit-transfer values for tropical wetland ecosystem services were compiled from 14 primary valuation studies across South America, Africa, and Southeast Asia, adjusted to 2022 USD using consumer price indices and purchasing power parity factors [3,8]. Borehole and river discharge data from the Brazilian National Water Agency (ANA) supplemented the hydrological characterisation.
Methods
Both composites were classified into five LULC classes (wetland, grassland, forest, cropland, open water) using a Random Forest classifier with 500 trees, trained on 400 reference polygons per epoch. Overall accuracy was 90.1% for 2022 and 84.7% for 2000, with kappa values of 0.87 and 0.80 respectively. Ecosystem service values (USD/ha/yr) were assigned to each class for six services, following the typology of Costanza et al. [9] . The per-pixel service value was computed as the product of pixel area and the classspecific unit value, and aggregated spatially using zonal statistics. Change detection compared the two classified maps to quantify area gains and losses by class and the associated change in service value [10] .
Biodiversity Assessment
Bird and mammal species richness data were compiled from the Pantanal Biodiversity Monitoring Network (2018-2022) for 36 sampling stations distributed across the study area. Species richness per station was interpolated using inversedistance weighting to produce a continuous surface. Stations in permanently flooded wetlands and gallery forest averaged 127 bird species and 24 mammal species, compared with 68 bird and 11 mammal species in cropland-dominated stations [11] . This gradient guided the assignment of biodiversity habitat values, with higher unit values applied to areas of greater species richness. Table 1 shows that wetland land cover generates the highest per-hectare value (USD 12,847/ha/yr), driven by water regulation and biodiversity services. Cropland contributes the lowest per-hectare value (USD 240), less than 2% of the wetland equivalent. The total estimated service value for the study area is USD 11.47 billion per year. Figure 2 illustrates the LULC shift over 22 years. Wetland declined from 42.3% to 36.7%, while cropland surged from 8.4% to 18.3%. Forest and grassland also contracted. Open water expanded modestly, possibly reflecting new reservoir construction and thermokarst-like processes in some subbasins.
| Service | Wetland | Grass | Forest | Crop | Water | Total (billion USD/yr) |
|---|---|---|---|---|---|---|
| Water regulation | 3847 | 412 | 687 | 48 | 2134 | 3.42 |
| Biodiversity | 2918 | 623 | 1847 | 87 | 1243 | 2.59 |
| Carbon storage | 2163 | 347 | 1284 | 62 | 183 | 1.93 |
| Nutrient cycling | 1742 | 284 | 541 | 31 | 892 | 1.55 |
| Fisheries | 1284 | 68 | 124 | 0 | 1847 | 1.14 |
| Recreation | 893 | 187 | 342 | 12 | 624 | 0.84 |
| Total | 12847 | 1921 | 4825 | 240 | 6923 | 11.47 |
Table text extracted from the original PDF; superscript letters are shown inline. The original table image is below.
View original table image
Results
Results
Discussion
The aggregate value of USD 11.47 billion per year positions the Pantanal among the most valuable wetland systems globally on a per-area basis. For comparison, Costanza et al. [9] estimated global wetland services at an average of USD 25,681/ha/yr in 2011 dollars; the Pantanal's wetland-class value of USD 12,847/ha/yr falls within the same order of magnitude, reflecting both the floodplain's immense hydrological regulation capacity and its biodiversity richness [12] . The USD 1.84 billion annual loss attributable to LULC change between 2000 and 2022 likely underestimates the true impact because benefit-transfer methods do not capture threshold effects, such as the collapse of fisheries when wetland connectivity drops below a critical level [13] . The Paraguay River corridor emerged as the zone of highest combined service value per hectare and, simultaneously, the area facing the greatest encroachment pressure. Targeted conservation easements or payment-for-ecosystem-service programmes along this corridor could yield outsized returns relative to their spatial footprint [14] . A limitation of this research is the reliance on benefittransfer values from other wetlands, which may not perfectly match Pantanal conditions. Primary economic valuation, particularly contingent valuation of willingness to pay for biodiversity and recreation, would sharpen the estimates. Additionally, the 30 m Landsat resolution for the 2000 baseline introduces classification uncertainty for narrow gallery forests and small seasonal ponds [15,16] .
Conclusion
This research mapped and valued six categories of ecosystem services across the Brazilian Pantanal using Sentinel-2 land cover data and benefit-transfer valuation. The total estimated service value was USD 11.47 billion per year, with water regulation, biodiversity habitat, and carbon storage contributing the largest shares. Between 2000 and 2022, wetland area declined by 13.2% and cropland more than doubled, reducing aggregate service value by an estimated USD 1.84 billion annually. The highest-value zones coincide with the Paraguay River corridor and permanently inundated depressions, both of which face agricultural encroachment. These spatial estimates can guide conservation planning by identifying where the opportunity cost of land conversion is highest. Extending the analysis to include the Bolivian and Paraguayan portions of the Pantanal would complete the transboundary picture and support coordinated basin-wide management.
Acknowledgement
Acknowledgements Funding SourcesThis research was funded through departmental grants at the Institute of Applied Geosciences, Hawassa. Institutional SupportThe Department of Soil Science provided GIS computing resources and remote sensing software. Contributions Not Qualifying for AuthorshipThe authors thank the Pantanal Biodiversity Monitoring Network for sharing species richness records.
Figures and tables from the paper
References
16 in the original paper- Mitsch WJ, Gosselink JG. Wetlands. 5th ed. John Wiley and Sons. 2015:1-736.
- Junk WJ, Nunes da Cunha C, Wantzen KM, Petermann P, Strussmann C, Marques MI. Biodiversity and its conservation in the Pantanal of Mato Grosso, Brazil. Aquatic Sciences. 2006;68(3):278-309.
- Brander LM, Florax RJGM, Vermaat JE. The empirics of wetland valuation: a comprehensive summary and a meta-analysis of the literature. Environmental and Resource Economics. 2006;33(2):223-250.
- Plummer ML. Assessing benefit transfer for the valuation of ecosystem services. Frontiers in Ecology and the Environment. 2009;7(1):38-45.
- Seidl AF, Moraes AS. Global valuation of ecosystem services: application to the Pantanal da Nhecolandia, Brazil. Ecological Economics. 2000;33(1):1-6.
- Ioris AAR. The political ecology of the Pantanal wetland. Political Geography. 2013;34:68-78.
- Maes J, Egoh B, Willemen L, Liquete C, Vihervaara P, Schagner JP. Mapping ecosystem services for policy support and decision making in the European Union. Ecosystem Services. 2012;1(1):31-39.
- de Groot R, Brander L, van der Ploeg S, Costanza R, Bernard F, Braat L. Global estimates of the value of ecosystems and their services in monetary units. Ecosystem Services. 2012;1(1):50-61.
- Costanza R, de Groot R, Sutton P, van der Ploeg S, Anderson SJ, Kubiszewski I. Changes in the global value of ecosystem services. Global Environmental Change. 2014;26:152-158.
- Congalton RG, Green K. Assessing the Accuracy of Remotely Sensed Data. 3rd ed. CRC Press. 2019:1-346.
- Alho CJR. Biodiversity of the Pantanal: response to seasonal flooding regime and to environmental degradation. Brazilian Journal of Biology. 2008;68(4 Suppl):957-966.
- Barbier EB, Acreman M, Knowler D. Economic Valuation of Wetlands: A Guide for Policy Makers and Planners. Ramsar Convention Bureau. 1997:1-127.
- Catella AC, Mascarenhas RA, Albuquerque SP, Albuquerque FF, Theodoro ER. Fisheries in the Pantanal of Mato Grosso do Sul: an overview. Pesquisa Agropecuaria Brasileira. 2014;49(10):803-812.
- Wunder S. Payments for environmental services: some nuts and bolts. CIFOR Occasional Paper No. 42. 2005:1-24.
- Padovani CR, Pontara V, Catian G, Sousa CDS. Multitemporal Landsat assessment of flooding extent in the Pantanal upper Paraguay River. Remote Sensing Applications: Society and Environment. 2018;11:70-83.
- Assine ML, Merino ER, Pupim FN, Macedo HA, Santos MGM. The Quaternary alluvial systems tract of the Pantanal Basin, Brazil. Brazilian Journal of Geology. 2015;45(3):475-489.