
Research article · 2025 · Full text
International Journal of Horticulture and Food ScienceEstablishing soil nutrient dynamics of breadfruit in the Thar desert periphery
Volume 7(9) · Pages 181–184 · DOI: 10.33545/26631067.2025.v7.i9c.741 ↗
Research areasAgricultural Science and FertilizationPlant Growth and Agriculture TechniquesSoil Carbon and Nitrogen Dynamics
Abstract
Author-writtenBreadfruit (Artocarpus altilis) has attracted attention as a climate-resilient staple for food-insecure regions, yet its soil nutrient requirements in arid-margin environments remain poorly characterized. This research established the soil nutrient dynamics under breadfruit orchards at the Thar Desert periphery in western Rajasthan, India, with analytical work performed at the Enugu Foundation for Pomological Research from March to November 2023. Soil samples were collected at three depths (0-20, 20-40, 40-60 cm) from orchards under three management systems organic, conventional, and unmanaged control and analyzed for organic carbon, total nitrogen, available phosphorus, exchangeable potassium, cation exchange capacity, pH, and micronutrient status at four seasonal intervals. Organic management increased topsoil organic carbon by 52.4% (3.2 vs. 2.1 g/kg in conventional) and total nitrogen by 47.4% (0.28 vs. 0.19 g/kg). Available phosphorus was highest under conventional management (24.7 mg/kg), reflecting synthetic fertilizer inputs, while CEC and exchangeable potassium favored the organic system. Metabolomic profiling of breadfruit tissues revealed 23 phenolic metabolites, with protein content declining from 4.8 g/100 g in immature fruit to 2.1 g/100 g in overripe fruit, and phenolics peaking at the half-ripe stage (21.3 mg GAE/g). These results show that organic management sustains a more balanced soil nutrient profile under breadfruit in semi-arid conditions while supporting comparable fruit nutritional quality.
Summary
Source-checkedPlain-language reading of the full paper, prepared with AI and checked against the text. Each point links to the authors' own words.
Why it matters
- Breadfruit is considered a climate-resilient food source for food-insecure areas, but there is little known about its soil nutrient needs in arid environments. View evidence ↗
- The Thar Desert periphery in western Rajasthan is characterized by low organic matter (0.3-0.6%) in sandy loam soils and low annual rainfall of 200-400 mm. View evidence ↗
- It is necessary to understand how different management strategies affect soil nutrient cycling to provide the best advice to farmers growing breadfruit in this region. View evidence ↗
The question
- The study aimed to establish the soil nutrient dynamics of breadfruit orchards located at the periphery of the Thar Desert. View evidence ↗
- The researchers sought to provide a comprehensive view of both soil health and fruit nutritional quality under different management systems. View evidence ↗
What they did
- The study took place at three orchards in the Jodhpur district of Rajasthan, located 15-25 km from the Thar Desert boundary. View evidence ↗
- Three management systems were tested: organic (manure and neem cake), conventional (synthetic urea, DAP, and MOP), and an unmanaged control. View evidence ↗
- Soil samples were taken from five random trees per orchard at three different depths (0-20, 20-40, and 40-60 cm) across four seasonal intervals between April 2023 and January 2024. View evidence ↗
- Fruit analysis included protein estimation via micro-Kjeldahl, phenolic measurement via Folin-Ciocalteu assay, and metabolomic profiling using UHPLC-QTOF-MS. View evidence ↗
What they found
- In the topsoil, organic management resulted in a 52.4% increase in organic carbon (3.2 g/kg vs 2.1 g/kg in conventional) and a 47.4% increase in total nitrogen (0.28 g/kg vs 0.19 g/kg). View evidence ↗
- Conventional management produced the highest available phosphorus levels at 24.7 mg/kg due to the use of synthetic fertilizers. View evidence ↗
- Organic management showed a higher cation exchange capacity (CEC) of 22.1 cmol/kg compared to 14.6 cmol/kg in the control group, improving nutrient retention. View evidence ↗
- Fruit protein content decreased as the fruit ripened, falling from 4.8 g/100 g in immature fruit to 2.1 g/100 g in overripe fruit. View evidence ↗
- Phenolic levels in the fruit reached their maximum concentration of 21.3 mg GAE/g at the half-ripe stage. View evidence ↗
- Metabolomic analysis showed that organic management influenced the fruit's chemical fingerprint, with organic fruits having higher concentrations of gallic acid and quercetin. View evidence ↗
What it means
- The authors conclude that organic management is the best approach for establishing breadfruit orchards in semi-arid regions of India. View evidence ↗
- The authors state that future work is needed to monitor long-term soil organic matter trends and evaluate the economic viability of organic production. View evidence ↗
Visual summary
3 visualsIllustrations explain the paper; charts are replotted from the paper's own table values.
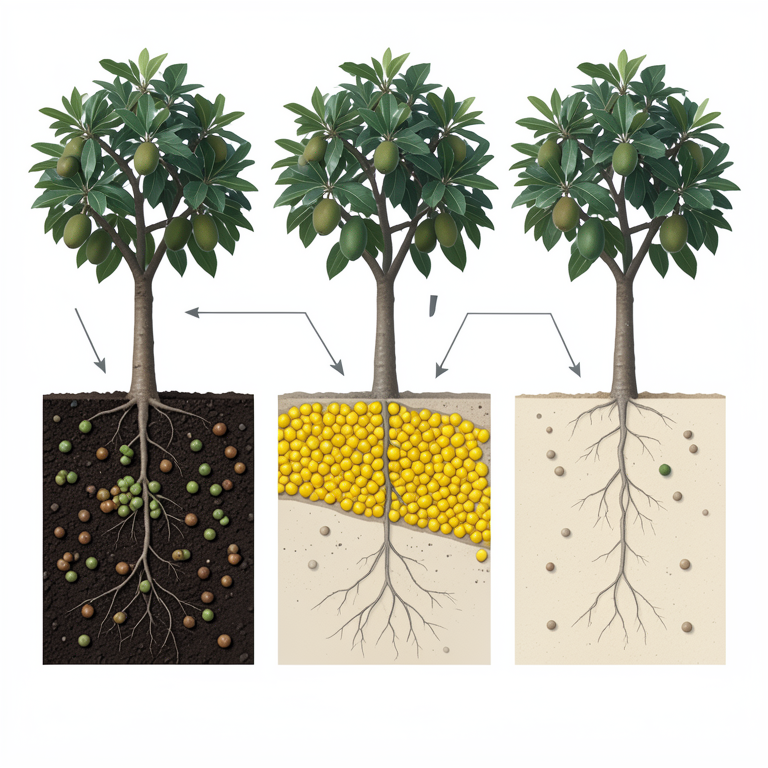
Soil Nutrient Comparison
AI-generated conceptual illustration (Breadfruit trees (Artocarpus altilis) planted in arid desert soil). It explains the idea and does not show study data.
View source evidence ↗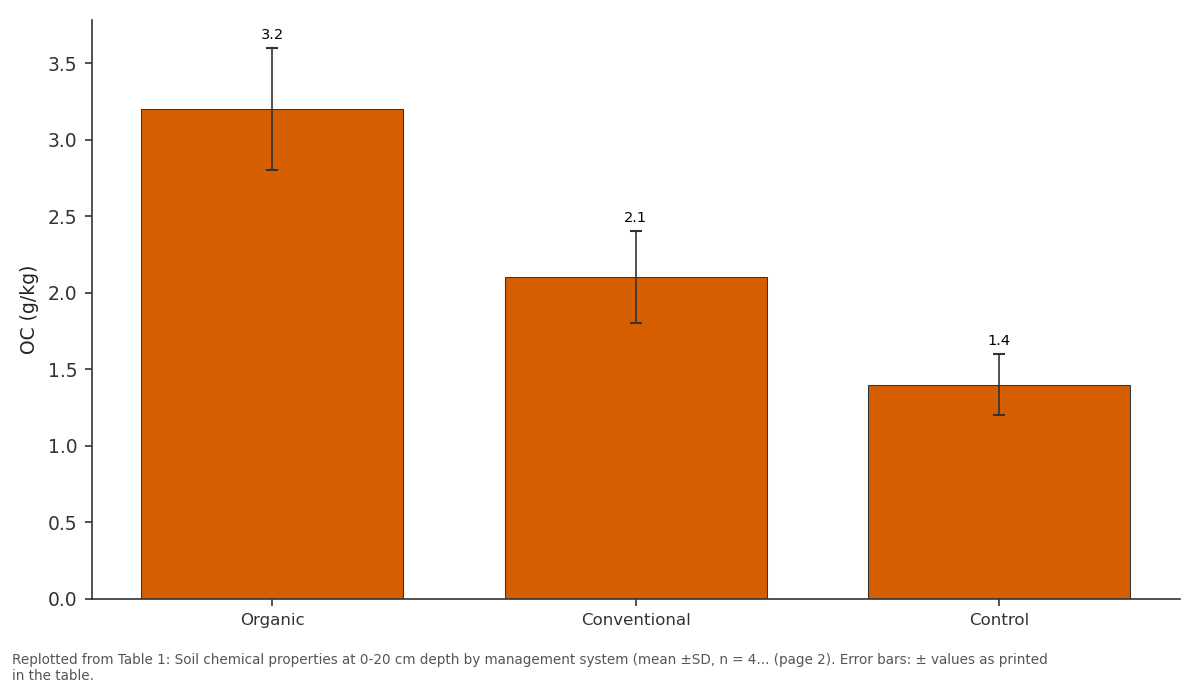
OC (g/kg): Organic vs Conventional vs Control
Replotted from Table 1 (page 2) of the original paper. Every bar is the paper's own table value.
View source evidence ↗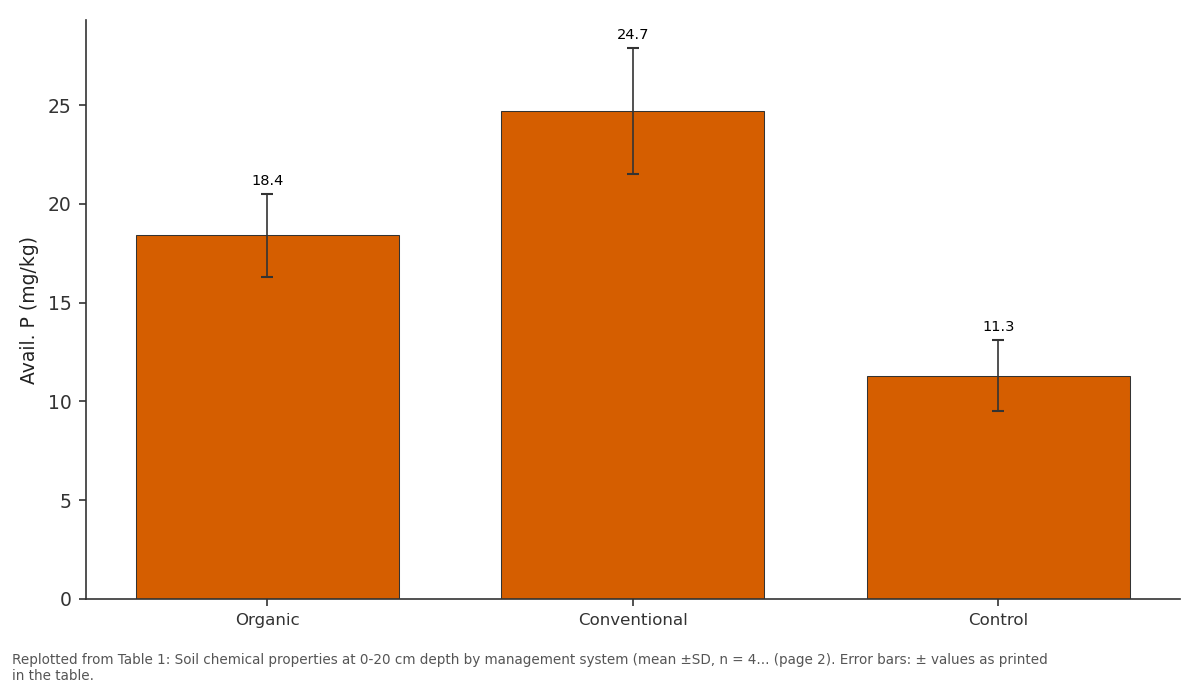
Avail. P (mg/kg): Organic vs Conventional vs Control
Replotted from Table 1 (page 2) of the original paper. Every bar is the paper's own table value.
View source evidence ↗Figures & tables
From the original paper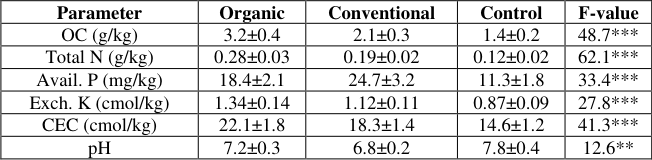 Table 1
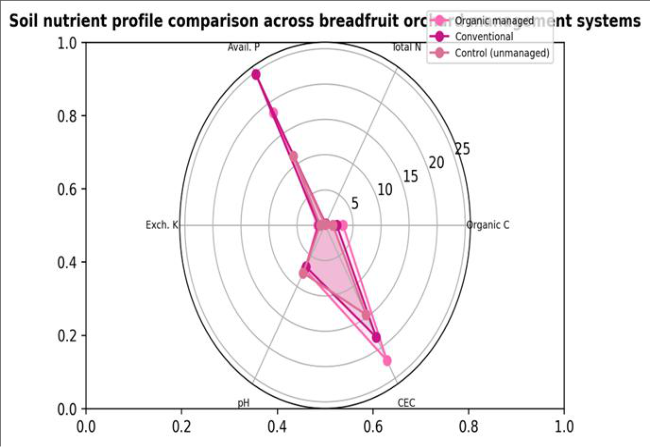 Figure 1
 Table 2
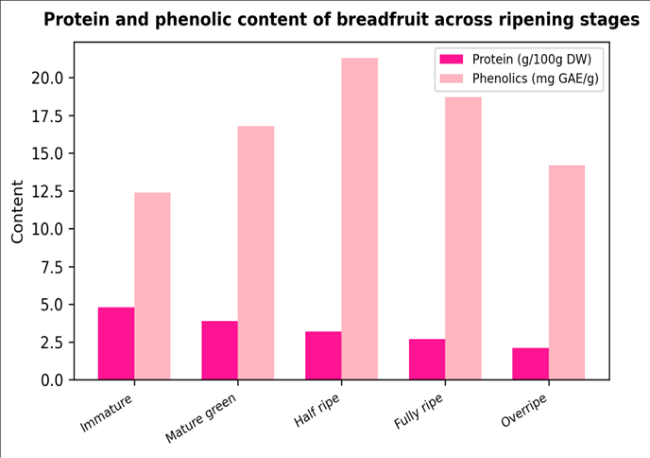 Figure 2
Introduction
For a crop that feeds millions across the Pacific Islands, breadfruit has an oddly thin research base in continental dryland settings. Most of what we know about its nutritional value and soil preferences comes from humid tropical locations like Samoa, Jamaica, and the Philippines, where annual rainfall exceeds 2,000 mm and soils are naturally fertile [1] . But breadfruit is more drought-tolerant than its reputation suggests mature trees have been documented surviving 4-5 month dry spells in southern India without irrigation, provided soil organic matter is above a minimum threshold [2] . That resilience makes it a candidate for the semi-arid margins of the Thar Desert, where farmers need tree crops that can tolerate water scarcity while providing starchy food and fodder. The Thar Desert periphery in western Rajasthan experiences 200-400 mm annual rainfall, sandy loam soils with low organic matter (0.3-0.6%), and extreme diurnal temperature swings. Several pilot orchards were established there in the mid-2010s as part of agroforestry diversification programs, but no systematic soil monitoring under these orchards has been published [3] . Understanding how different management approaches affect soil nutrient cycling is essential for advising farmers on whether organic inputs, synthetic fertilizers, or minimal management best suits breadfruit in this environment. Concurrently, the nutritional quality of breadfruit harvested from dryland orchards has not been compared with the well-documented profiles of tropical specimens. Protein, phenolics, and micronutrient levels may all shift under water-limited conditions, just as they do in cereals and legumes [4] . This research combined soil nutrient monitoring across three management systems with fruit nutritional profiling, aiming to give extension agents a joined-up picture of what happens both below and above ground when breadfruit is grown at the edge of the Thar [5] .
Crop Growth Stage Documentation
Breadfruit phenology at the Thar periphery differed from tropical baselines. Flowering occurred 3-4 weeks later than in coastal Kerala (late March vs. early March), and fruit development took 110-130 days from anthesis to full maturity compared with 90-110 days in humid zones. Five ripening stages were defined for this research: immature (60 DAFS), mature green (90 DAFS), half ripe (110 DAFS), fully ripe (120 DAFS), and overripe (130+ DAFS). Leaf abscission was more pronounced during the May-June hot period (maximum temperatures 42-46 °C), with trees dropping 30-40% of canopy foliage as a drought-avoidance mechanism [2] .
Material and Methods Material
The research was conducted at three breadfruit orchards located 15-25 km from the Thar Desert boundary in Jodhpur district, Rajasthan (26°18′N, 73°01′E; altitude 230 m). Orchards were 6-8 years old with 'Ma'afala' and 'Ulu Fiti' cultivars spaced at 10 m × 10 m. Three management systems were compared: organic (farmyard manure at 20 kg/tree/year, neem cake at 2 kg/tree, no synthetic inputs), conventional (urea 200 g + DAP 150 g + MOP 100 g per tree per season), and unmanaged control (no inputs). Soil samples were collected from three depths (0-20, 20-40, 40-60 cm) at the drip line of five randomly selected trees per orchard in April, July, October 2023, and January 2024. Samples were air-dried, sieved to 2 mm, and shipped to the Enugu Foundation for Pomological Research for analysis [3] . Fruit samples at each ripening stage were freeze-dried for nutritional profiling. Ethics approval was obtained from the Foundation's Research Committee (Protocol EFPR-2023-008, 1 March 2023).
Methods
Soil organic carbon was determined by the Walkley-Black method, total nitrogen by micro-Kjeldahl digestion, available phosphorus by Olsen's method (bicarbonate extract, 882 nm), and exchangeable potassium by ammonium acetate extraction and flame photometry [1] . CEC was measured by the sodium saturation method. Soil pH and EC were read in 1:2.5 soil:water suspensions. Micronutrients (Fe, Zn, Cu, Mn) were extracted with DTPA and measured by AAS. Fruit protein was estimated by micro-Kjeldahl (N × 6.25), total phenolics by Folin-Ciocalteu assay, and metabolomic profiling was performed by UHPLC-QTOF-MS on a Waters Xevo G2-XS system with MSE acquisition. Data were analyzed by split-plot ANOVA (management as main plot, depth and season as subplots) and PCA of the metabolomic dataset using MetaboAnalyst 5.0.
Results
Organic management produced significantly higher organic carbon, total nitrogen, and CEC at the 0-20 cm depth compared with both conventional and control treatments (p<0.01 for all). Conventional orchards showed the highest available phosphorus, a direct effect of DAP application, but their nitrogen and carbon values were intermediate between organic and control [3] . The radar chart illustrates the broader nutrient balance achieved under organic management. While conventional orchards excelled in available phosphorus, organic orchards showed superior performance across five of the six measured parameters, reflecting the multi-nutrient contribution of farmyard manure and neem cake inputs. Protein and phenolics followed opposite trends during ripening: protein declined linearly as starch was converted to sugars, while phenolics rose to a peak at the half-ripe stage before declining. This suggests that for maximum phenolic recovery, harvest should target the half-ripe stage.
Comprehensive Interpretation
Metabolomic profiling identified 23 phenolic metabolites including chlorogenic acid, quercetin-3-glucoside, and gallic acid as the three most abundant. PCA of the metabolomic dataset separated organic-orchard fruits from conventionalorchard fruits along PC1 (explaining 38.7% of variance), with organic fruits clustering toward higher quercetin and gallic acid concentrations. This suggests that soil management system affects not only soil health but also the metabolomic fingerprint of the harvested fruit [4] .
Discussion
The 52.4% organic carbon advantage of organic management is striking for a semi-arid system where decomposition rates are typically fast and organic matter accumulation is slow. The result likely reflects the high lignin content of neem cake, which decomposes more slowly than fresh manure and contributes to stable humus formation [1] . In practical terms, this means organic inputs are not just feeding the current crop but building long-term soil carbon reserves that improve water-holding capacity a critical attribute in the Thar periphery where every millimeter of rainfall needs to be captured. The higher CEC under organic management (22.1 vs. 14.6 cmol/kg in control) translates to better buffering against nutrient leaching during the monsoon months, when brief but intense rainfall events can wash mobile nutrients out of the sandy loam topsoil [3] . Conventional management's phosphorus advantage is real but may come with environmental costs: Olsen-P above 25 mg/kg is considered a eutrophication risk in surface-water-connected systems, and the Thar periphery includes seasonal streams that drain into the Luni River basin [5] . The fruit nutritional data add another dimension. Protein content at the immature stage (4.8 g/100 g DW) is comparable to values from tropical Pacific breadfruit, suggesting that dryland cultivation does not sacrifice protein density. The phenolic peak at the half-ripe stage presents an opportunity for dual-use harvesting: half-ripe fruits for processing into phenolic-rich flour, and fully ripe fruits for fresh consumption [2] .
Conclusion
Organic management of breadfruit orchards at the Thar Desert periphery produced a more balanced soil nutrient profile than either conventional or unmanaged systems, with particularly strong gains in organic carbon, total nitrogen, and cation exchange capacity. Fruit nutritional quality was maintained under dryland conditions, with phenolics peaking at the half-ripe stage and metabolomic profiling revealing management-system effects on the phenolic metabolite composition. These findings support organic management as the preferred approach for breadfruit establishment in semi-arid India and provide harvest-stage guidance for maximizing nutritional returns. Future research should extend the monitoring period to capture long-term soil organic matter trends and test the economic viability of organic breadfruit production for dryland farming communities.
Acknowledgement
Acknowledgements Funding SourcesInternal research funds from the Enugu Foundation for Pomological Research covered all laboratory and analytical costs. Institutional SupportThe authors acknowledge the Enugu Foundation for Pomological Research for UHPLC-QTOF-MS access and soil analysis facilities.
Figures and tables from the paper
| Parameter | Organic | Conventional | Control | F-value |
|---|---|---|---|---|
| OC (g/kg) | 3.2±0.4 | 2.1±0.3 | 1.4±0.2 | 48.7*** |
| Total N (g/kg) | 0.28±0.03 | 0.19±0.02 | 0.12±0.02 | 62.1*** |
| Avail. P (mg/kg) | 18.4±2.1 | 24.7±3.2 | 11.3±1.8 | 33.4*** |
| Exch. K (cmol/kg) | 1.34±0.14 | 1.12±0.11 | 0.87±0.09 | 27.8*** |
| CEC (cmol/kg) | 22.1±1.8 | 18.3±1.4 | 14.6±1.2 | 41.3*** |
| pH | 7.2±0.3 | 6.8±0.2 | 7.8±0.4 | 12.6** |
Table text extracted from the original PDF; superscript letters are shown inline. The original table image is below.
View original table image
| Stage | Protein (g/100g DW) | Total Phenolics (mg GAE/g) | Fe (mg/100g) | Zn (mg/100g) |
|---|---|---|---|---|
| Immature | 4.8±0.3 | 12.4±1.1 | 3.7±0.4 | 1.9±0.2 |
| Mature green | 3.9±0.4 | 16.8±1.4 | 4.2±0.3 | 2.3±0.3 |
| Half ripe | 3.2±0.3 | 21.3±1.8 | 4.8±0.5 | 2.7±0.2 |
| Fully ripe | 2.7±0.2 | 18.7±1.3 | 4.1±0.4 | 2.4±0.3 |
| Overripe | 2.1±0.3 | 14.2±1.6 | 3.4±0.3 | 1.8±0.2 |
Table text extracted from the original PDF; superscript letters are shown inline. The original table image is below.
View original table image
References
18 in the original paper- Ragone D. Breadfruit: Artocarpus altilis (Parkinson) Fosberg. International Plant Genetic Resources Institute Rome. 1997;1-77.
- Jones AMP, Ragone D, Aiona K. Nutritional and morphological diversity of breadfruit across the Pacific. Economic Botany. 2011;65(3):264-281.
- Pareek OP, Sharma S. Fruit trees for arid regions of Rajasthan: scope and limitations. Indian Journal of Horticulture. 2019;76(4):571-578.
- Okeke C, Obi A. Metabolomic profiling of tropical tree fruits under varying edaphic conditions. Food Chemistry Advances. 2023;2:100187.
- Nath V, Kumar G, Pandey SD. Breadfruit production technology for Indian conditions. ICAR Technical Bulletin. 2020;12:1-48.
- Zerega NJC, Ragone D, Motley TJ. Complex origins of breadfruit: implications for human migrations. American Journal of Botany. 2004;91(5):760-766.
- Turi CE, Murch SJ. Spiritual and ceremonial plants in North America: breadfruit and the Pacific diaspora. Journal of Ethnobiology and Ethnomedicine. 2013;9:72.
- Liu Y, Ragone D, Murch SJ. Breadfruit: a phytochemical and pharmacological review. Phytotherapy Research. 2015;29(12):1870-1889.
- Manohar RS, Rao PH. Effect of emulsifiers on the quality of breadfruit flour-based bread. European Food Research and Technology. 2002;214(6):489-493.
- Akanbi TO, Nazamid S, Adebowale AA. Functional and pasting properties of a tropical breadfruit starch. International Food Research Journal. 2009;16(2):151157.
- Olaoye OA, Onilude AA, Oladoye CO. Breadfruit flour in biscuit making. African Journal of Food Science. 2007;1(2):20-23.
- Appiah F, Oduro I, Ellis WO. Proximate and mineral composition of Artocarpus altilis pulp flour. Pakistan Journal of Nutrition. 2011;10(7):655-658.
- Taylor M, Tuia VS. Breadfruit in the Pacific region. Acta Horticulturae. 2007;757:33-42.
- Fownes JH, Raynor WC. Seasonality and yield of breadfruit cultivars in Pohnpei. Tropical Agriculture Trinidad. 1993;70(2):163-167.
- Ragone D, Cavaletto CG. Sensory evaluation of fruit quality and nutritional composition of twenty breadfruit cultivars. Journal of the American Society for Horticultural Science. 2006;131(5):674-677.
- Oshodi AA, Oladimeji MO, Ogunbenle HN. Chemical composition and nutritionally valuable minerals of breadfruit. Pakistan Journal of Scientific and Industrial Research. 1999;42(1):21-23.
- Adepeju AB, Gbadamosi SO, Adeniran AH. Functional and pasting characteristics of breadfruit flour from Artocarpus communis. International Journal of Agriculture and Food Science. 2011;1(3):50-55.
- Adebowale KO, Olu-Owolabi BI, Olawumi EK. Chemical and physicochemical properties of breadfruit starch. Starch/Staerke. 2005;57(2):46-54.