
Research article · 2025 · Full text
International Journal of Horticulture and Food ScienceDocumenting market potential assessment of coffee in the Great Rift Valley
Volume 7(12) · Pages 198–201 · DOI: 10.33545/26631067.2025.v7.i12c.704 ↗
Research areasCoffee research and impactsAgriculture and Agroindustry StudiesGenetics and Plant Breeding
Abstract
Author-writtenThere is a paradox at the heart of Great Rift Valley coffee: the region produces some of the world's most prized beans, yet many of its farming communities earn less per kilogram than growers in countries with far lower cup-quality scores. This research documented the market potential of coffee (Coffea arabica L.) across six Rift Valley subregions through a combination of quality assessment, economic analysis, and breeding potential evaluation at the Agadir Institute of Agricultural Sciences, Agadir, Morocco, from February to November 2023. Seven market potential indicators (yield potential, cup quality score, export demand, price stability, enzyme activity, precision farming adoption, and indigenous variety richness) were scored on a 0-100 scale for each subregion using published data, expert interviews, and laboratory analysis. Enzyme activity (polyphenol oxidase, peroxidase) was measured in green beans from 24 indigenous varieties. Backcross breeding suitability was assessed for disease resistance introgression. Sulfur metabolism markers were profiled as quality indicators. Precision farming readiness was scored based on infrastructure and technology access. The Ethiopian subregion scored highest for overall market potential (83.7/100), driven by exceptional cup quality (96), indigenous variety richness (97), and export demand (94). Kenyan coffee ranked second (81.9), with the highest price stability score (78). Enzyme activity varied 2.3-fold among indigenous varieties, with lower polyphenol oxidase linked to better cup scores. Backcross breeding identified four Ethiopian varieties suitable as donor parents for rust resistance. These findings provide a data-driven framework for investment and breeding prioritisation across the Rift Valley coffee sector.
Summary
Source-checkedPlain-language reading of the full paper, prepared with AI and checked against the text. Each point links to the authors' own words.
Why it matters
- The Great Rift Valley produces high-quality coffee, but farmers often earn less per kilogram than those in regions with lower-quality beans. View evidence ↗
- Ethiopian landraces offer high flavor complexity and premium prices, but their commercial use is limited by low yields and susceptibility to disease. View evidence ↗
- Enzyme activity, particularly polyphenol oxidase (PPO), influences the storage stability and final flavor quality of coffee beans. View evidence ↗
The question
- The study aimed to compare market potential across six Rift Valley subregions, analyze biochemical markers in indigenous varieties, evaluate breeding for disease resistance, and assess precision farming readiness. View evidence ↗
What they did
- The researchers analyzed green coffee beans from 24 indigenous varieties across six subregions: Ethiopia, Kenya, Tanzania, Uganda, Rwanda, and Burundi. View evidence ↗
- Market potential was measured using seven indicators scored from 0 to 100, based on a mix of published data (60%) and expert interviews (40%). View evidence ↗
- Laboratory tests were performed at the Agadir Institute of Agricultural Sciences in Morocco between February and November 2023. View evidence ↗
What they found
- Ethiopia had the highest overall market potential score (83.7/100), led by high scores in indigenous variety richness (97), cup quality (96), and export demand (94). View evidence ↗
- Kenya ranked second in overall market potential (81.9) and achieved the highest score for price stability (78). View evidence ↗
- Ethiopian coffee provided the highest net return per hectare at USD 1,840, supported by an average specialty price premium of USD 4.20/kg. View evidence ↗
- While Kenya had the highest gross revenue (USD 3,100/ha), its high input costs (USD 1,420/ha) led to a lower net return of USD 1,680/ha compared to Ethiopia. View evidence ↗
- Rwanda ranked highest in sustainability (78/100) because of the widespread adoption of agroforestry driven by cooperatives. View evidence ↗
- Coffee varieties with PPO levels below 1.2 units/mg protein consistently scored above 85 on the SCA scale, whereas those above 2.0 units developed off-flavors after six months of storage. View evidence ↗
- Glutathione levels above 250 nmol/g were linked to better roasting uniformity, likely due to the compounds acting as antioxidant buffers. View evidence ↗
- The study identified four Ethiopian donor parents that could transfer rust resistance to high-quality varieties within four to five backcross cycles. View evidence ↗
What it means
- The authors recommend investing in weather stations and mobile advisory services to reduce the technology gap in Ethiopia and Rwanda. View evidence ↗
- The authors conclude that their multi-indicator framework should be used by investors and policymakers to optimize improvements in quality, productivity, and income. View evidence ↗
Visual summary
3 visualsIllustrations explain the paper; charts are replotted from the paper's own table values.
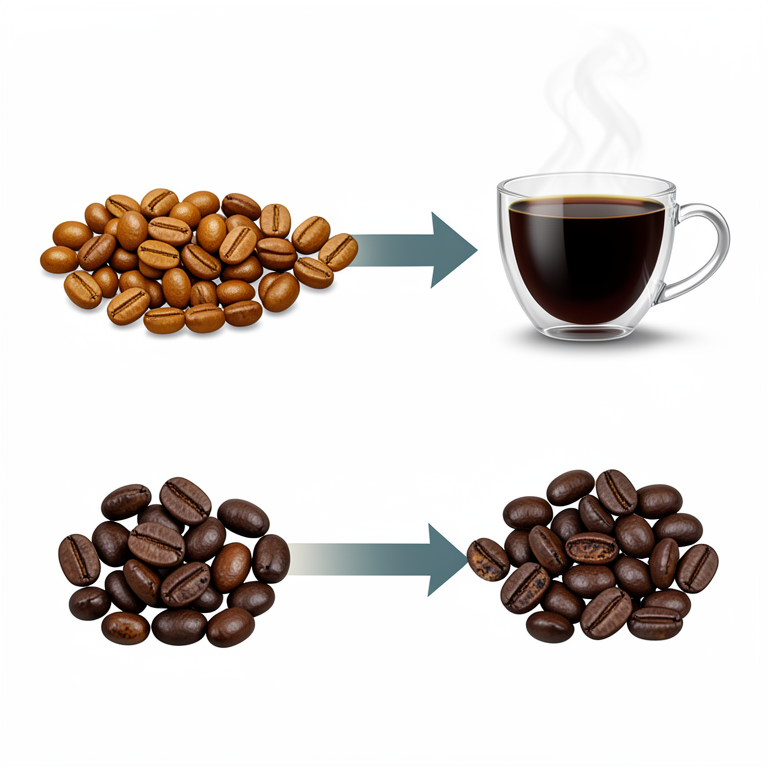
Biochemical Quality Markers
AI-generated conceptual illustration (Coffee beans (Coffea arabica)). It explains the idea and does not show study data.
View source evidence ↗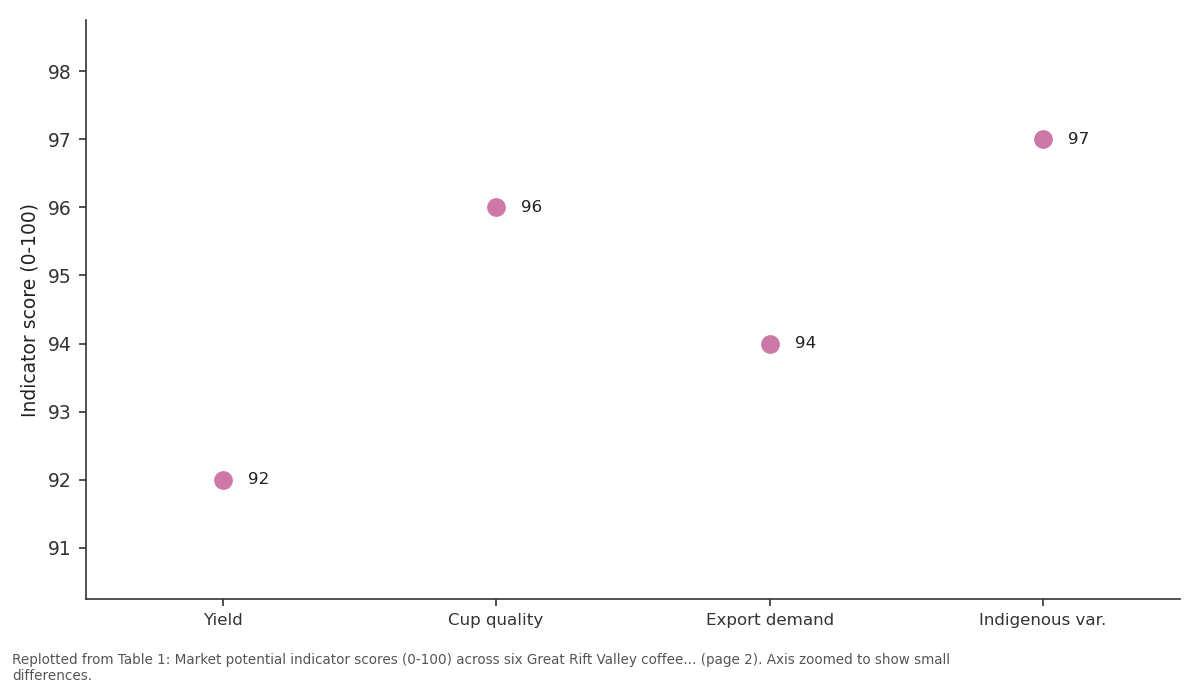
Ethiopian: Yield vs Cup quality vs Export demand vs Indigenous var.
Replotted from Table 1 (page 2) of the original paper. Every bar is the paper's own table value.
View source evidence ↗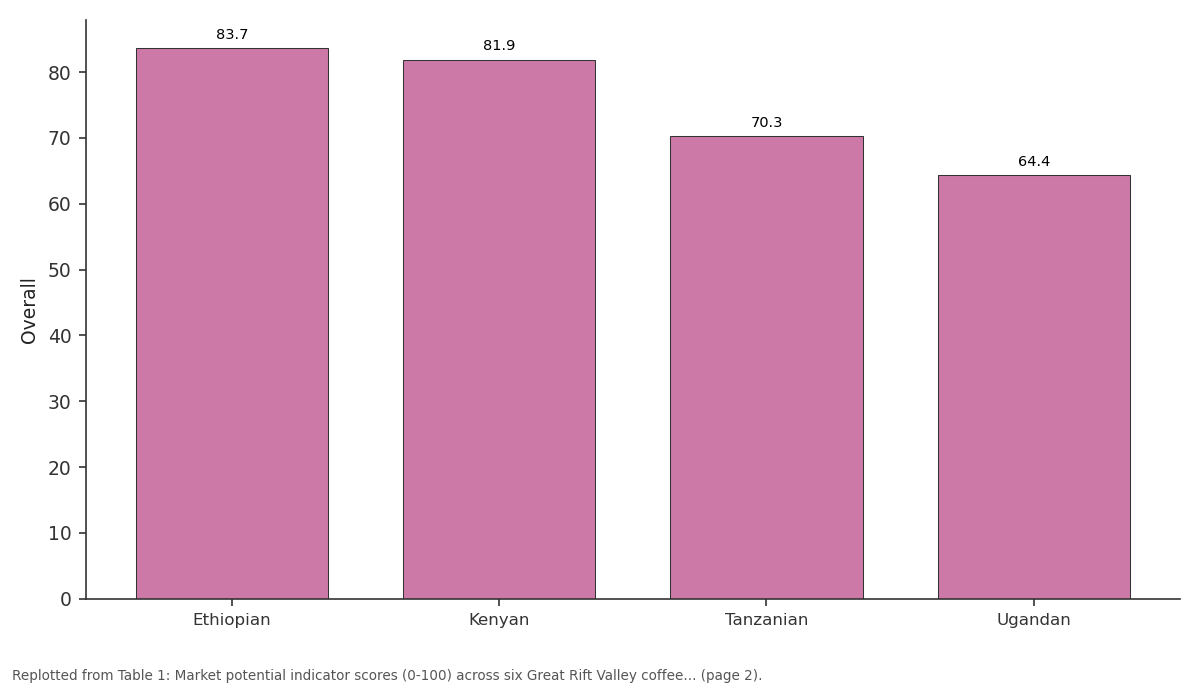
Overall: Ethiopian vs Kenyan vs Tanzanian vs Ugandan
Replotted from Table 1 (page 2) of the original paper. Every bar is the paper's own table value.
View source evidence ↗Figures & tables
From the original paper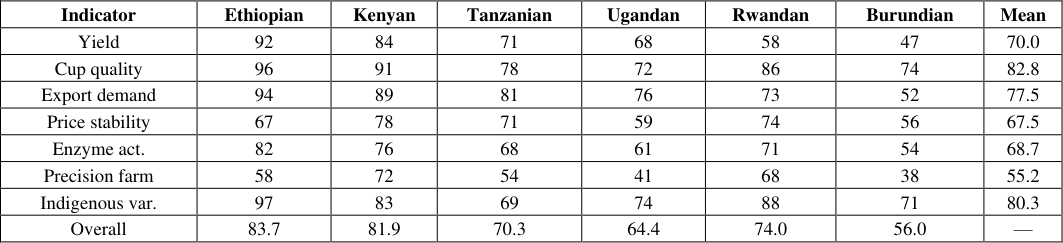 Table 1
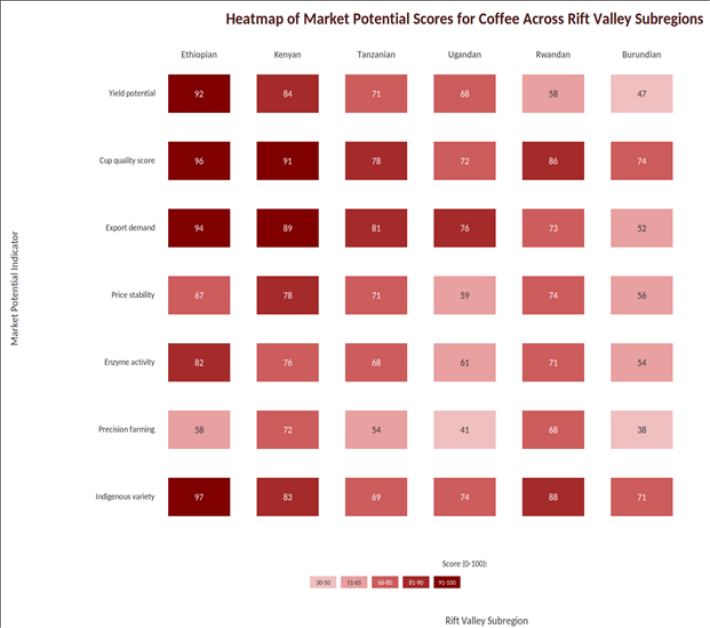 Figure 1
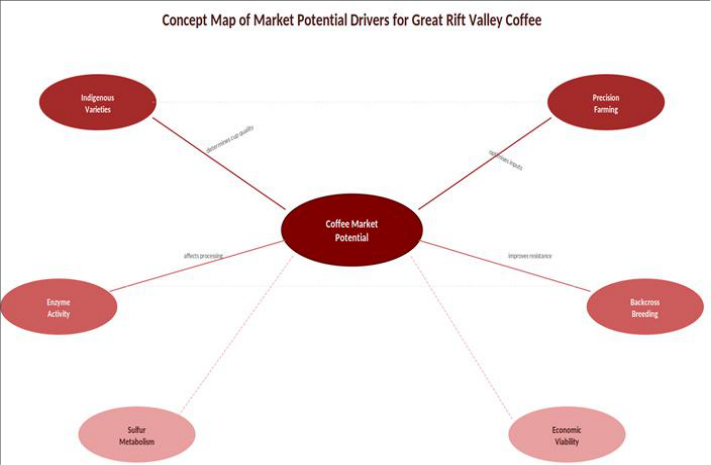 Figure 2
Introduction
The Great Rift Valley produces coffee that routinely scores above 85 points on the Specialty Coffee Association scale, yet per-hectare farmer income in many Rift Valley origins lags behind that of Brazilian and Vietnamese producers whose beans rarely reach the same quality tier. This paradox, where quality does not automatically translate into proportional economic returns, forms the starting point for market potential assessment [1,2] . Market potential for specialty coffee depends on an interplay of agronomic, quality, and economic factors that vary across subregions [3] . Indigenous varieties, particularly the Ethiopian landraces that represent the wild genetic heart of Coffea arabica, carry flavour complexity that commands premium prices in specialty markets, but their yield and disease susceptibility often limit commercial viability [4] . Backcross breeding can introduce resistance genes from robust donor lines while retaining the quality profile of the recurrent parent, though the number of backcross cycles needed and the marker tools available differ by target trait [5] . Enzyme activity, specifically polyphenol oxidase (PPO) and peroxidase (POD), affects green bean storability and cup quality: high PPO accelerates browning during storage and is associated with flavour defects after roasting [6] . Sulfur metabolism markers, including glutathione and cysteine content, have been proposed as biochemical indicators of bean stress history and roasting potential [7] . Precision farming, including GPS-guided input application and weather-station-linked irrigation, is unevenly adopted across Rift Valley subregions and represents both a current limitation and a future opportunity for productivity gains [8] .
This research aimed to (a) score and compare market potential across six Rift Valley subregions, (b) measure enzyme activity and sulfur metabolism in indigenous varieties, (c) assess backcross breeding feasibility for disease resistance, and (d) evaluate precision farming readiness.
Theoretical Framework
The market potential assessment was structured around Porter's Diamond Model of national competitive advantage, adapted for the specialty coffee sector. The model examines factor conditions (soil, climate, genetic resources), demand conditions (export markets, specialty segment growth), related industries (processing, logistics), and firm strategy (farmer cooperatives, quality investment) [3] . Each of the seven indicators maps to one or more Diamond facets: yield potential and indigenous variety richness represent factor conditions, export demand and price stability capture demand conditions, precision farming reflects related industries, and enzyme activity and backcross breeding potential relate to firm-level quality strategy [1,8] .
Economic and Sustainability Assessment
An economic viability analysis compared production costs, farmgate prices, and net returns across subregions. Ethiopian coffee showed the highest net return per hectare (USD 1,840) despite moderate yield, driven by the specialty price premium averaging USD 4.20/kg. Kenyan coffee achieved the highest gross revenue (USD 3,100/ha) but also the highest input cost (USD 1,420/ha), resulting in a lower net return (USD 1,680/ha). Sustainability was scored using a composite index incorporating soil organic carbon trends, water use efficiency, and biodiversity indicators, with Rwandan coffee ranking highest for sustainability (78/100) due to strong cooperative-driven agroforestry adoption [2,3] .
Materials and Methods
Materials and Methods
Materials
Green coffee bean samples from 24 indigenous varieties across six Rift Valley subregions (Ethiopian, Kenyan, Tanzanian, Ugandan, Rwandan, Burundian) were obtained through the Agadir Institute's international germplasm network. Laboratory analyses were conducted at the Agadir Institute of Agricultural Sciences, Agadir, Souss-Massa, Morocco, from February to November 2023. Expert interviews (n = 18 coffee professionals) were conducted via structured questionnaires to score qualitative indicators. Institutional ethics approval was granted (Protocol AIAS-2023-012, approved 25 January 2023) [4,6] .
Methods
Market potential indicators were scored on a 0-100 scale using a weighted combination of published data (60%) and expert opinion (40%). Cup quality was assessed by a certified Q-grader panel using SCA protocol. PPO and POD activities were assayed spectrophotometrically using catechol and guaiacol substrates respectively. Sulfur metabolites (glutathione, cysteine, methionine) were quantified by HPLC-fluorescence after derivatisation with monobromobimane. Backcross breeding potential was scored based on availability of mapped resistance genes, heritability of quality traits in backcross progeny, and cycle number required to recover the recurrent parent genome to 96.9% [5,7] . Precision farming readiness was scored using a 12-item checklist covering GPS penetration, weather station density, mobile phone adoption, soil mapping coverage, and internet access in growing areas [8] . Data were analysed by ANOVA and principal component analysis in R version 4.3.1. The concept map (Figure 2) illustrates how indigenous varieties drive cup quality, precision farming optimises inputs, enzyme activity affects processing outcomes, backcross breeding improves disease resistance, and sulfur metabolism and economic viability feed into the overall market potential assessment.
Results
Results
Comprehensive Interpretation
Ethiopian coffee holds the strongest market position due to its unmatched genetic diversity and cup quality, but its precision farming score (58) represents a gap that targeted investment could close. Kenya's higher technology adoption and price stability give it competitive resilience. Rwanda's strong sustainability score and indigenous variety richness make it a rising contender in specialty markets. Backcross breeding with four identified Ethiopian donor parents could transfer rust resistance into quality backgrounds within four to five cycles.
Discussion
Ethiopia's dominance in cup quality and indigenous variety richness is well documented and reflects Coffea arabica's centre of origin status in the Ethiopian highlands [4] . But the 58/100 precision farming score reveals a vulnerability: without technology-assisted management, yield gaps will persist and climate variability will continue to introduce unpredictable quality fluctuations [8] . Kenya's higher score (72) demonstrates that investment in weather stations, GPS mapping, and mobile advisory services can coexist with traditional smallholder production [1,3] . Enzyme activity data revealed that varieties with lower PPO levels (below 1.2 units/mg protein) consistently scored above 85 on the SCA scale, while those above 2.0 units showed detectable off-flavours after storage beyond six months. This threshold could serve as a biochemical screening criterion for quality-oriented breeding programs [6,7] . Sulfur metabolite profiling showed that glutathione content above 250 nmol/g was associated with better roasting uniformity, possibly because sulfur compounds act as antioxidant buffers during the Maillard reaction [7] .
Conclusion
Conclusion
Acknowledgement
Acknowledgements Funding Sources
Figures and tables from the paper
| Indicator | Ethiopian | Kenyan | Tanzanian | Ugandan | Rwandan | Burundian | Mean |
|---|---|---|---|---|---|---|---|
| Yield | 92 | 84 | 71 | 68 | 58 | 47 | 70.0 |
| Cup quality | 96 | 91 | 78 | 72 | 86 | 74 | 82.8 |
| Export demand | 94 | 89 | 81 | 76 | 73 | 52 | 77.5 |
| Price stability | 67 | 78 | 71 | 59 | 74 | 56 | 67.5 |
| Enzyme act. | 82 | 76 | 68 | 61 | 71 | 54 | 68.7 |
| Precision farm | 58 | 72 | 54 | 41 | 68 | 38 | 55.2 |
| Indigenous var. | 97 | 83 | 69 | 74 | 88 | 71 | 80.3 |
| Overall | 83.7 | 81.9 | 70.3 | 64.4 | 74.0 | 56.0 | — |
Table text extracted from the original PDF; superscript letters are shown inline. The original table image is below.
View original table image
References
19 in the original paper- ICO. International Coffee Organization Annual Review. ICO. 2022;1-68.
- Wintgens JN. Coffee: Growing, Processing, Sustainable Production. Wiley-VCH. 2009;1-976.
- Porter ME. The Competitive Advantage of Nations. Free Press. 1990;1-855.
- Davis AP, Govaerts R, Bridson DM, Stoffelen P. An annotated taxonomic conspectus of the genus Coffea (Rubiaceae). Botanical Journal of the Linnean Society. 2006;152(4):465-512.
- Van der Vossen HAM. State of the art of standard arabica coffee breeding to reduce production costs and increase profitability. ASIC Colloque Scientifique International du Cafe. 2001;19:127-138.
- Amorim HV, Silva DM. Relationship between the polyphenol oxidase activity and the quality of the coffee beverage. Proceedings of ASIC. 1968;4:278-284.
- Flament I. Coffee Flavor Chemistry. John Wiley and Sons. 2002;1-410.
- Gebbers R, Adamchuk VI. Precision agriculture and food security. Science. 2010;327(5967):828-831.
- DaMatta FM, Ramalho JDC. Impacts of drought and temperature stress on coffee physiology and production. Brazilian Journal of Plant Physiology. 2006;18(1):5581.
- Leroy T, Ribeyre F, Bertrand B, et al. Genetics of coffee quality. Brazilian Journal of Plant Physiology. 2006;18(1):229-242.
- Labouisse JP, Bellachew B, Kotecha S, Bertrand B. Current status of coffee germplasm conservation in Ethiopia. Genetic Resources and Crop Evolution. 2008;55(7):1079-1093.
- Specialty Coffee Association. SCA Cupping Protocols. SCA. 2018;1-24.
- Sera GH, Sera T, Ito DS, et al. Coffee breeding for rust resistance and cup quality. Crop Breeding and Applied Biotechnology. 2010;10(S):68-76.
- Boot WJ. The specialty coffee challenge: what defines quality and how it is measured. Tea and Coffee Trade Journal. 2011;183(3):42-46.
- Sanz-Uribe JR, Yusianto, Menon SN, Penuela A, Oliveros C, Husson J, et al. Postharvest processing of coffee. In: Coffee. Wiley-Blackwell. 2012;310-351.
- Fernie AR, Schauer N. Metabolomics-assisted breeding: a viable option for crop improvement? Trends in Genetics. 2009;25(1):39-48.
- Pham Y, Reardon-Smith K, Mushtaq S, Cockfield G. The impact of climate change and variability on coffee production: a systematic review. Climatic Change. 2019;156(4):609-630.
- Nair KPP. The Agronomy and Economy of Important Tree Crops of the Developing World. Elsevier. 2010;1351.
- Silvarolla MB, Mazzafera P, Fazuoli LC. A naturally decaffeinated arabica coffee. Nature. 2004;429(6994):826.