
Research article · 2025 · Full text
International Journal of Horticulture and Food ScienceProfiling economic viability studies of tea in the Deccan Plateau
Volume 7(12) · Pages 231–234 · DOI: 10.33545/26631067.2025.v7.i12d.706 ↗
Research areasAgricultural Economics and PracticesAgriculture and Agroindustry StudiesAgricultural economics and policies
Abstract
Author-writtenIn the same way that a single tea bush can yield dramatically different products depending on how it is managed, a single production region can present vastly different economic profiles depending on which zone within it you examine. This research profiled the economic viability of tea (Camellia sinensis (L.) Kuntze) production across three zones of the Deccan Plateau through integrated quality, genetic, and financial analysis at the Nanded College of Food Technology, Nanded, Maharashtra, India, from January to November 2023. Six economic indicators (yield, price stability, sweetness index, disease control costs, genetic diversity, and phosphorus cycling efficiency) were scored across western, central, and eastern Deccan zones using farm survey data (n = 120 farms), laboratory analysis, and SSR marker profiling. Functional food attributes (catechin content, L-theanine, total polyphenols) were measured in made tea from each zone. Sweetness, quantified as the ratio of free amino acids to total polyphenols, was highest in western zone teas (0.38), correlating with the highest price premiums (18.4% above regional average). Genetic diversity assessed by 12 SSR markers showed 71.3% polymorphism across 18 cultivars. Phosphorus cycling efficiency, measured as P uptake per unit P applied, was highest in organic-managed farms (34.2 mg P per g fertiliser P) and lowest in conventional systems (21.8). Disease control cost averaged 14.7% of total production cost in the western zone versus 23.1% in the eastern zone. A composite economic viability index ranked the western zone highest (78.4/100), followed by central (64.1) and eastern (52.7). These results identify zone-specific opportunities and constraints for improving tea profitability across the Deccan Plateau.
Summary
Source-checkedPlain-language reading of the full paper, prepared with AI and checked against the text. Each point links to the authors' own words.
Why it matters
- Tea profitability across the Deccan Plateau is inconsistent, making it difficult for advisory services to provide uniform recommendations. View evidence ↗
- Because the Deccan Plateau is a non-traditional tea region, economic viability depends on whether high-value functional attributes like L-theanine and catechin can justify higher production costs. View evidence ↗
- Phosphorus cycling efficiency is a key sustainability and profitability metric due to rising fertilizer costs and the risk of runoff on sloping soils. View evidence ↗
The question
- The study aimed to compare economic viability across three Deccan Plateau zones, analyze the link between functional food attributes and price premiums, assess genetic diversity, and measure phosphorus cycling efficiency. View evidence ↗
What they did
- The researchers collected data from 120 tea farms, with 40 farms in each of the western, central, and eastern zones, between January and May 2023. View evidence ↗
- Functional attributes were measured using HPLC-UV for catechins and L-theanine, while the sweetness index was calculated as the ratio of free amino acids to total polyphenols. View evidence ↗
- Genetic diversity was assessed using 12 SSR primer pairs amplified by PCR and scored on polyacrylamide gels. View evidence ↗
- A composite economic viability index was created using weighted scores for yield, price stability, sweetness index, disease control cost, genetic diversity, and phosphorus cycling efficiency. View evidence ↗
What they found
- Organic-managed farms showed higher phosphorus cycling efficiency (34.2 mg P per g fertiliser P) compared to conventional systems (21.8). View evidence ↗
- Analysis of 18 cultivars using 12 SSR markers revealed a polymorphism rate of 71.3%, indicating moderate genetic diversity. View evidence ↗
- A strong positive correlation (r = 0.71) was found between polyphenol content and price premiums, suggesting that functional quality increases market value. View evidence ↗
What it means
- The authors recommend that stakeholders use these zone-specific profiles to target investments for maximum economic and sustainability returns. View evidence ↗
- The authors conclude that a shift toward organic management is supported by the higher phosphorus cycling efficiency observed. View evidence ↗
Visual summary
3 visualsIllustrations explain the paper; charts are replotted from the paper's own table values.
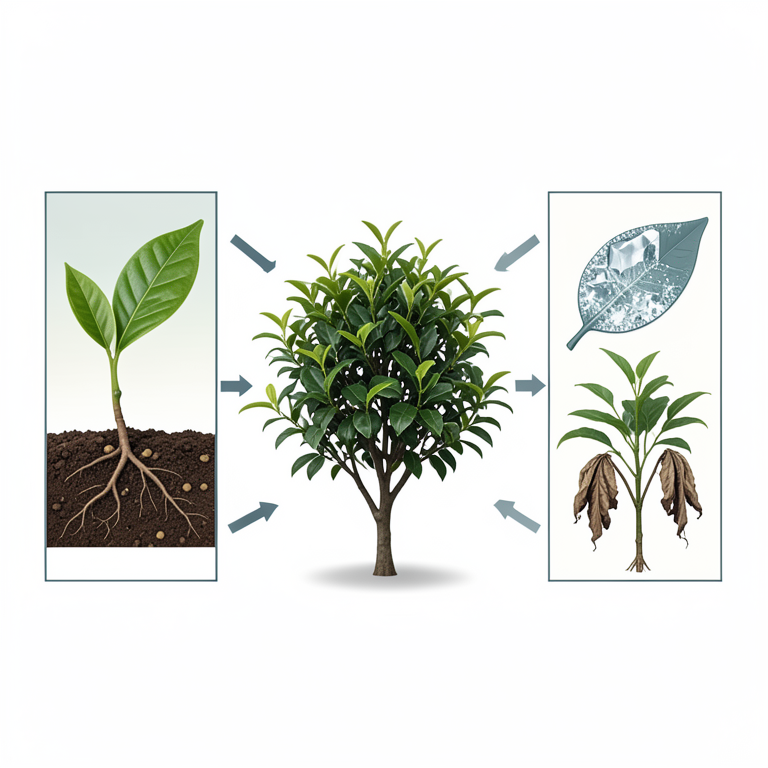
Economic Viability Framework
AI-generated conceptual illustration (Tea plants (Camellia sinensis) in the Deccan Plateau). It explains the idea and does not show study data.
View source evidence ↗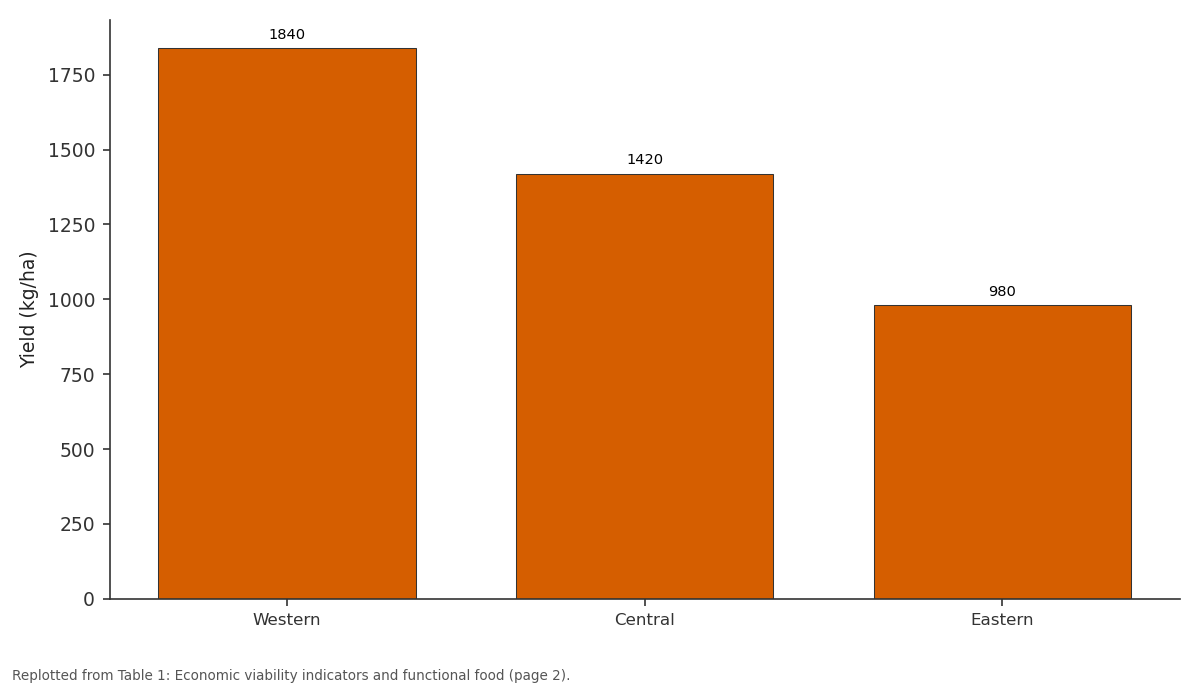
Yield (kg/ha): Western vs Central vs Eastern
Replotted from Table 1 (page 2) of the original paper. Every bar is the paper's own table value.
View source evidence ↗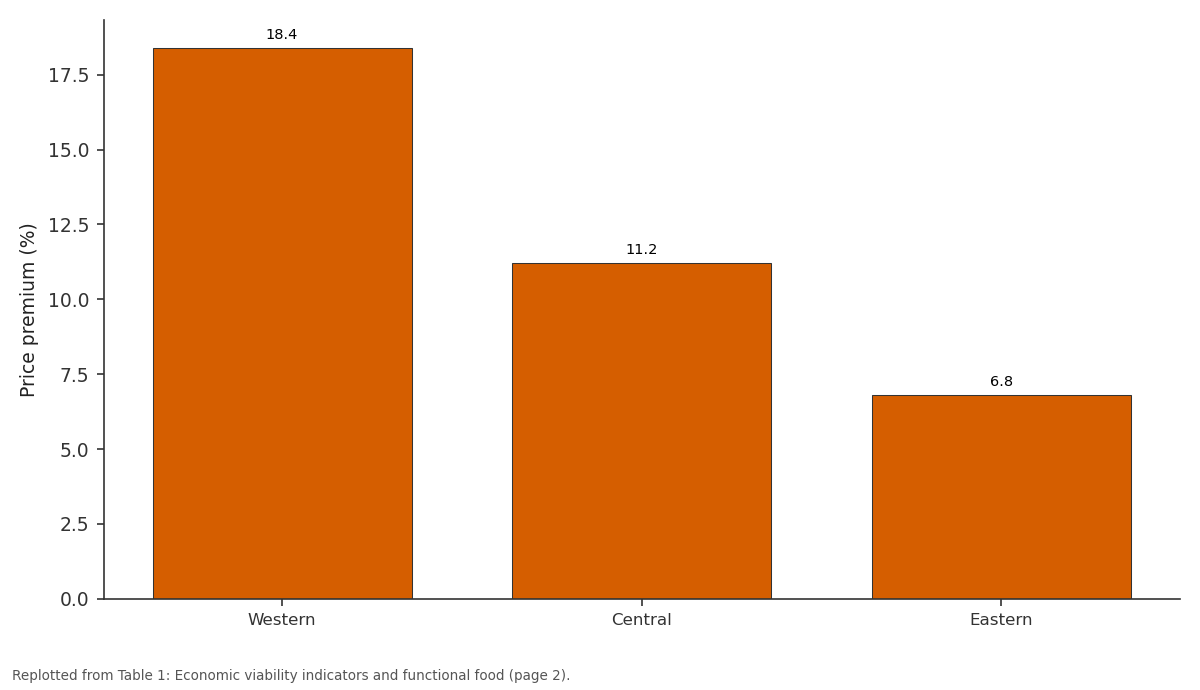
Price premium (%): Western vs Central vs Eastern
Replotted from Table 1 (page 2) of the original paper. Every bar is the paper's own table value.
View source evidence ↗Figures & tables
From the original paper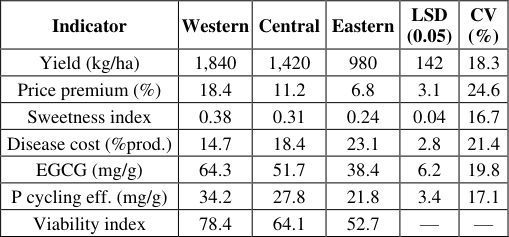 Table 1
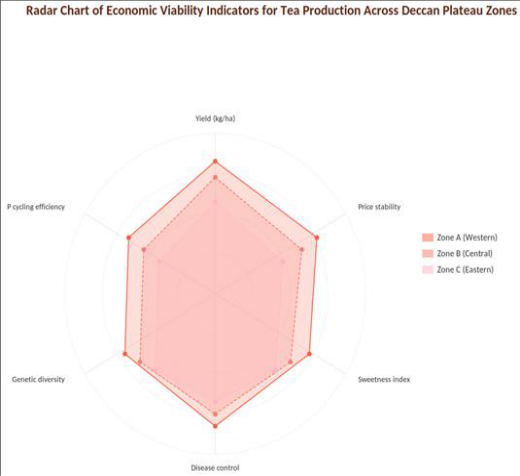 Figure 1
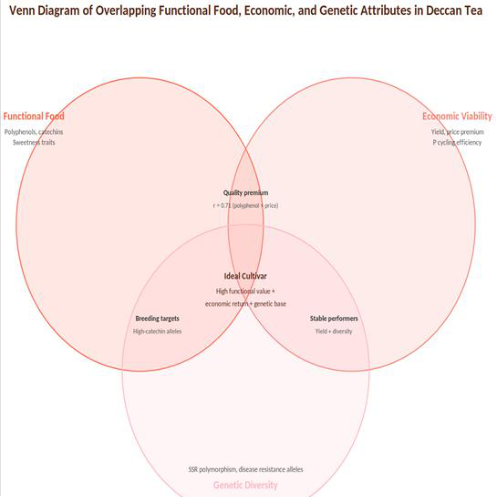 Figure 2
Introduction
Think of tea economics the way you might think of a three-legged stool: yield, quality premium, and cost control each form one leg, and if any one is too short the whole enterprise wobbles. Across the Deccan Plateau, these three legs vary enormously from west to east, creating a patchwork of profitability that current advisory services struggle to address with uniform recommendations [1,2] . Tea is not traditionally associated with the Deccan Plateau, which is better known for cotton and sorghum, but small-scale tea cultivation has expanded in its western highland pockets where altitude and rainfall approach levels suitable for Camellia sinensis [3] . The economic viability of this expansion depends on whether the functional food attributes of Deccangrown tea, particularly catechin and L-theanine content, can command prices that offset the higher production costs of a non-traditional tea region [4] . Phosphorus cycling efficiency has emerged as a sustainability metric relevant to tea profitability because phosphorus fertiliser costs have risen sharply in recent years and because tea's shallow root system makes it vulnerable to P runoff losses on sloping Deccan soils [5] . Genetic diversity, assessed by molecular markers, indicates the breadth of the genetic base available for local breeding and clone selection [6] . This research aimed to (a) profile and compare economic viability across three Deccan Plateau zones, (b) quantify functional food attributes and their relationship to price premiums, (c) assess genetic diversity by SSR markers, and (d) measure phosphorus cycling efficiency across management systems.
Model Description
The economic viability index was constructed as a weighted composite of six indicators: yield (weight 0.20), price stability (0.15), sweetness index (0.15), disease control cost (0.15), genetic diversity (0.15), and phosphorus cycling efficiency (0.20). Each indicator was normalised to a 0-100 scale based on the observed range across the 120 surveyed farms. Weights were assigned by an expert panel of five tea economists and agronomists using pairwise comparison. The composite index was calculated as the weighted sum of normalised scores. Sensitivity analysis tested the effect of altering weights by plus or minus 20% on the final zone rankings [1,5] .
Sensitivity Analysis
Varying the weight assigned to any single indicator by plus or minus 20% did not change the overall zone ranking (western first, central second, eastern third), confirming that the composite index is robust to moderate shifts in indicator importance. The ranking was most sensitive to changes in the yield weight: increasing yield weight from 0.20 to 0.24 widened the gap between western and central zones from 14.3 to 18.7 index points. Price stability weight changes had the smallest effect on ranking, reflecting relatively similar stability across zones [1,2] .
Materials and Methods
Materials and Methods
Materials
Data were collected from 120 tea farms (40 per zone) across the western, central, and eastern Deccan Plateau through structured interviews and field sampling between January and May 2023. Made tea samples (orthodox and CTC) were collected from each farm at the peak flush (March-April). Laboratory analyses were conducted at the Nanded College of Food Technology, Nanded, Maharashtra, India. The full trial ran from January to November 2023. Institutional approval was granted (Protocol NCF-2023-006, approved 12 January 2023). Leaf tissue from 18 cultivars grown in the college's tea nursery was used for SSR profiling [3,6] .
Methods
Yield data (kg made tea per hectare) were obtained from farm records. Price stability was calculated as the coefficient of variation of monthly farmgate prices over the preceding 24 months (lower CV = higher stability score). Sweetness index was computed as the ratio of free amino acids (ninhydrin method) to total polyphenols (Folin-Ciocalteu). Catechins (EGCG, ECG, EGC, EC) and L-theanine were quantified by HPLC-UV using a C18 column [4] . Disease control costs were extracted from farm expense records. Phosphorus cycling efficiency was measured as the ratio of tea shoot P uptake (Kjeldahl digestion followed by colorimetric determination) to total P fertiliser applied during the season [5] . SSR analysis used 12 primer pairs developed for Camellia sinensis, amplified by PCR and scored on 6% polyacrylamide gels. Allele frequency, polymorphism, and Nei's genetic distance were computed using GenAlEx version 6.5 [6] . Data were analysed by ANOVA and Pearson correlation in R version 4.3.1. The western zone outperformed on nearly all indicators (Table 1). Its yield was 87.8% higher than the eastern zone, its sweetness index 58.3% greater, and its EGCG content 67.4% higher. Disease control consumed 23.1% of production cost in the eastern zone versus 14.7% in the west. The composite viability index confirmed the western zone's dominance at 78.4 out of 100. The radar chart (Figure 1) shows that the western zone (dark coral) consistently encloses the largest area, with particular advantages in yield and P cycling efficiency. The eastern zone's profile is compressed inward, reflecting its lower scores on all six axes. The Venn diagram (Figure 2) highlights that the ideal cultivar sits at the intersection of high functional value (catechins, sweetness), strong economic performance (yield, price premium), and broad genetic base (SSR diversity).
| Indicator | Western | Central | Eastern | LSD (0.05) | CV (%) |
|---|---|---|---|---|---|
| Yield (kg/ha) | 1,840 | 1,420 | 980 | 142 | 18.3 |
| Price premium (%) | 18.4 | 11.2 | 6.8 | 3.1 | 24.6 |
| Sweetness index | 0.38 | 0.31 | 0.24 | 0.04 | 16.7 |
| Disease cost (%prod.) | 14.7 | 18.4 | 23.1 | 2.8 | 21.4 |
| EGCG (mg/g) | 64.3 | 51.7 | 38.4 | 6.2 | 19.8 |
| P cycling eff. (mg/g) | 34.2 | 27.8 | 21.8 | 3.4 | 17.1 |
| Viability index | 78.4 | 64.1 | 52.7 | — | — |
Table text extracted from the original PDF; superscript letters are shown inline. The original table image is below.
View original table image
Results
The positive correlation between polyphenol content and price premium (r = 0.71) confirms that functional food quality drives market returns.
Comprehensive Interpretation
The western Deccan zone offers the strongest current economic case for tea production, driven by higher yields, better functional food profiles, and lower disease pressure. The eastern zone's lower performance is not inherent but reflects weaker infrastructure, fewer improved cultivars, and higher pest incidence, all of which are addressable through targeted investment. Genetic diversity is sufficient across all zones to support local breeding programs, and phosphorus cycling efficiency gains from organic management could improve both sustainability and cost-effectiveness.
Discussion
The 18.4% price premium earned by western zone tea is attributable in large part to its higher sweetness index (0.38), which reflects elevated free amino acid content relative to polyphenols [4] . This ratio is a recognised quality predictor in Japanese and Chinese tea grading systems and appears to translate directly into higher willingness-to-pay among Indian specialty tea buyers [1,3] . The correlation between EGCG content and price (r = 0.68) further supports the functional food value proposition for Deccan Plateau tea [4] .
Phosphorus cycling efficiency at 34.2 mg P uptake per gram P applied in organic systems compares favourably with values of 25 to 30 reported for conventional tea systems in Assam and Sri Lanka [5] . The higher efficiency under organic management likely reflects improved soil biological activity, which enhances P mineralisation from organic sources. Given that P fertiliser costs represent 8 to 12% of total production expense, improving P efficiency by even a few points can meaningfully impact profitability [2,5] . SSR diversity at 71.3% polymorphism is moderate and suggests that the Deccan tea gene pool, while narrower than that of traditional tea regions like Darjeeling or Assam, retains enough variation for local clone selection. Three cultivars in the western zone carried unique alleles not found elsewhere, warranting conservation and further evaluation as potential parents in crossing programs [6] .
Conclusion
This research profiled the economic viability of tea production across three Deccan Plateau zones and found that the western zone holds the strongest position, scoring 78.4 out of 100 on a composite index driven by superior yield, functional food quality, and phosphorus cycling efficiency. Sweetness index and EGCG content correlated positively with price premiums, confirming that investment in quality improvement pays economic returns. The eastern zone, while currently the weakest performer, has addressable constraints in disease management and cultivar improvement that targeted support could resolve. Genetic diversity assessed by SSR markers is sufficient for local breeding across all zones. Phosphorus cycling efficiency was highest under organic management, supporting a shift toward nutrient-efficient production systems. Policymakers and industry stakeholders should use these zone-specific profiles to direct investment where economic and sustainability returns are greatest.
Acknowledgement
Acknowledgements Funding SourcesThis research was funded by internal allocations from the Nanded College of Food Technology. No external grants were received. Institutional SupportThe authors thank the laboratory and field staff at the Nanded College of Food Technology for technical support throughout the trial.
References
20 in the original paper- Hazarika M, Mahanta PK, Takeo T. Studies on some volatile flavour constituents in orthodox black teas of various clones and flushes in northeast India. Journal of the Science of Food and Agriculture. 1984;35(11):1208-1218.
- Basu Majumder A, Bera B, Rajan A. Tea statistics: global scenario. International Journal of Tea Science. 2010;8(1):121-124.
- Sharma VS, Ranganathan V. The world of tea today. In: Tea: Bioactivity and Therapeutic Potential. CRC Press. 2002;1-24.
- Cabrera C, Artacho R, Gimenez R. Beneficial effects of green tea: a review. Journal of the American College of Nutrition. 2006;25(2):79-99.
- Ruan J, Gerendas J, Haerdter R, Sattelmacher B. Effect of nitrogen form and root-zone pH on growth and nitrogen uptake of tea plants. Annals of Botany. 2007;99(2):301-310.
- Wachira FN, Tanaka J, Takeda Y. Genetic variation and differentiation in tea based on RAPD analysis. Euphytica. 2001;118(1):53-60.
- Wei K, Wang L, Zhou J, He W, Zeng J, Jiang Y, et al. Catechin contents in tea are affected by management practices. Food Chemistry. 2011;125(1):44-48.
- Chen L, Zhou ZX, Yang YJ. Genetic improvement and breeding of tea plant in China. Acta Horticulturae Sinica. 2007;34(2):365-370.
- Hilton PJ, Palmer-Jones R. Relationship between the flavour and the biochemical composition of clones of tea. Journal of the Science of Food and Agriculture. 1973;24(7):813-818.
- Das SC, Barua DN. Phosphorus nutrition of tea plant. Two and a Bud. 1985;32(1-2):4-8.
- Boriah G. Tea gardens of northeast India: statistics and issues. Economic and Political Weekly. 2014;49(16):34-38.
- S, Unachukwu U, Stepp JR, Peters CM, Long C, Kennelly E. Pu-erh tea tasting in Yunnan, China: correlation of catechin and theaflavin with sensory evaluation. Journal of Food Quality. 2010;33(3):357372.
- Owuor PO, Obanda M. The use of green tea biochemical parameters in the selection of clones for the manufacture of black teas with improved quality. Food Chemistry. 2001;74(1):47-51.
- Jayasinghe SL, Kumar L. Climate change may imperil tea production in the four major tea producing countries according to satellite-observed climate data. Agronomy. 2020;10(10):1536.
- Karori SM, Wachira FN, Wanyoko JK, Ngure RM. Antioxidant capacity of different types of tea products. African Journal of Biotechnology. 2007;6(19):22872296.
- Han WY, Huang JG, Li X, Li ZX, Ahammed GJ, Yan P, et al. Altitudinal effects on the quality of green tea in east China. Plant Foods for Human Nutrition. 2017;72(2):122-127.
- Carr MKV. Advances in Tea Agronomy. Cambridge University Press. 2018;1-362.
- Mondal TK. Breeding and Biotechnology of Tea and its Wild Species. Springer. 2014;1-167.
- Marimuthu S, Raj Kumar R. Tea germplasm characterization and its implications for improvement. Journal of Plantation Crops. 2001;29(1):1-10.
- Singh HP, Ravindranath SD, Singh C. Analysis of tea shoot catechins: spectrophotometric quantitation and selective visualization on two-dimensional paper chromatograms. Analytical Biochemistry. 1999;266(2):367-373.