
Research article · 2025 · Full text
International Journal of Horticulture and Food ScienceMapping carotenoid accumulation of sesame in the Atbara River Basin
Volume 7(10) · Pages 229–232 · DOI: 10.33545/26631067.2025.v7.i10d.724 ↗
Research areasSesame and Sesamin ResearchSunflower and Safflower CultivationSoil and Land Suitability Analysis
Abstract
Author-writtenWhile sesame is mainly prized for its oil, the carotenoid fraction in its seeds has received far less scientific attention than its lipid or lignan components. This research mapped carotenoid accumulation patterns in six sesame (Sesamum indicum L.) cultivars grown across three sites in the Atbara River Basin during the 2023 cropping season. Seeds were analysed by HPLC with diode-array detection, and carotenoid spatial distribution within the seed was visualised by digital image analysis. Beta-carotene dominated at 38.4% of total carotenoids, followed by lutein at 24.1% and zeaxanthin at 16.7%. Soil health indicators, particularly organic carbon and available phosphorus, showed positive correlations with total carotenoid content (r = 0.64 and 0.59, respectively). Biofertilizer application (Azotobacter plus phosphate-solubilising bacteria) raised total carotenoids by 19.7% compared with uninoculated controls, while cellulose content in the seed coat was negatively associated with carotenoid extractability. Consumer preference surveys among 180 respondents found that golden-coloured sesame paste commanded a 14.2% price premium over pale varieties. Image analysis revealed that carotenoid concentration peaked in the outer cotyledon layer and declined toward the embryonic axis. These findings provide a spatial and quantitative framework for breeding sesame with enhanced carotenoid value in semi-arid river-basin agriculture.
Summary
Source-checkedPlain-language reading of the full paper, prepared with AI and checked against the text. Each point links to the authors' own words.
Why it matters
- Carotenoids are pigments in seeds that provide antioxidant capacity, pro-vitamin A activity, and color. View evidence ↗
- There is a lack of scientific data on sesame carotenoid profiles compared to crops like maize, which hinders breeding for nutritional quality and industrial use. View evidence ↗
- Soil health in the Atbara River Basin has deteriorated due to long-term continuous cropping without organic additions. View evidence ↗
The question
- The study aimed to quantify carotenoids in six sesame cultivars, test the impact of biofertilizers, correlate results with soil health, map carotenoid distribution in seeds, and assess consumer preferences based on color. View evidence ↗
What they did
- The researchers tested six sesame cultivars (AT-01 to AT-06) across three sites in the Atbara River Basin from March to September 2023. View evidence ↗
- Biofertilizer containing Azotobacter chroococcum and Bacillus megaterium was applied via seed coating (10 g/kg) and soil drenching. View evidence ↗
- The experiment used 108 subplots in total, and consumer preferences were gathered from a survey of 180 respondents. View evidence ↗
- Carotenoids were quantified using UHPLC with a photodiode-array detector, and spatial distribution was mapped using longitudinal seed bisection and image analysis. View evidence ↗
What they found
- Beta-carotene was the most abundant carotenoid at 38.4%, followed by lutein (24.1%) and zeaxanthin (16.7%). View evidence ↗
- Biofertilizer application increased total carotenoid content by an average of 19.7%, with individual cultivar increases ranging from 17.3% to 21.2%. View evidence ↗
- Cultivar AT-04 had the highest carotenoid accumulation (37.8 µg/g with biofertilizer), while AT-03 had the lowest. View evidence ↗
- Total carotenoid content correlated positively with soil health indicators, most strongly with organic carbon (r = 0.64) and available phosphorus (r = 0.59). View evidence ↗
- Sesame from the site with the best soil health (2.1% organic carbon, 18.6 mg/kg P) had 27% more carotenoids than those from the poorest site (0.8% organic carbon, 7.3 mg/kg P). View evidence ↗
- Carotenoids were concentrated in the outer cotyledon layer, with 68% of fluorescence found in the outer 0.3 mm. View evidence ↗
- Consumers were willing to pay a 14.2% price premium for golden-colored sesame paste compared to pale varieties. View evidence ↗
- Higher cellulose content in the seed coat was negatively correlated with the ability to extract carotenoids (r = -0.48). View evidence ↗
What it means
- The authors recommend cultivar AT-04 for breeding programs due to its high carotenoid content and strong response to biofertilizers. View evidence ↗
- The authors conclude that combining soil restoration with biofertilizer use is an effective strategy for improving sesame nutritional quality in degraded semi-arid regions. View evidence ↗
Visual summary
2 visualsIllustrations explain the paper; charts are replotted from the paper's own table values.
Intra-seed Carotenoid Distribution
AI-generated conceptual illustration (Sesame seeds (Sesamum indicum)). It explains the idea and does not show study data.
View source evidence ↗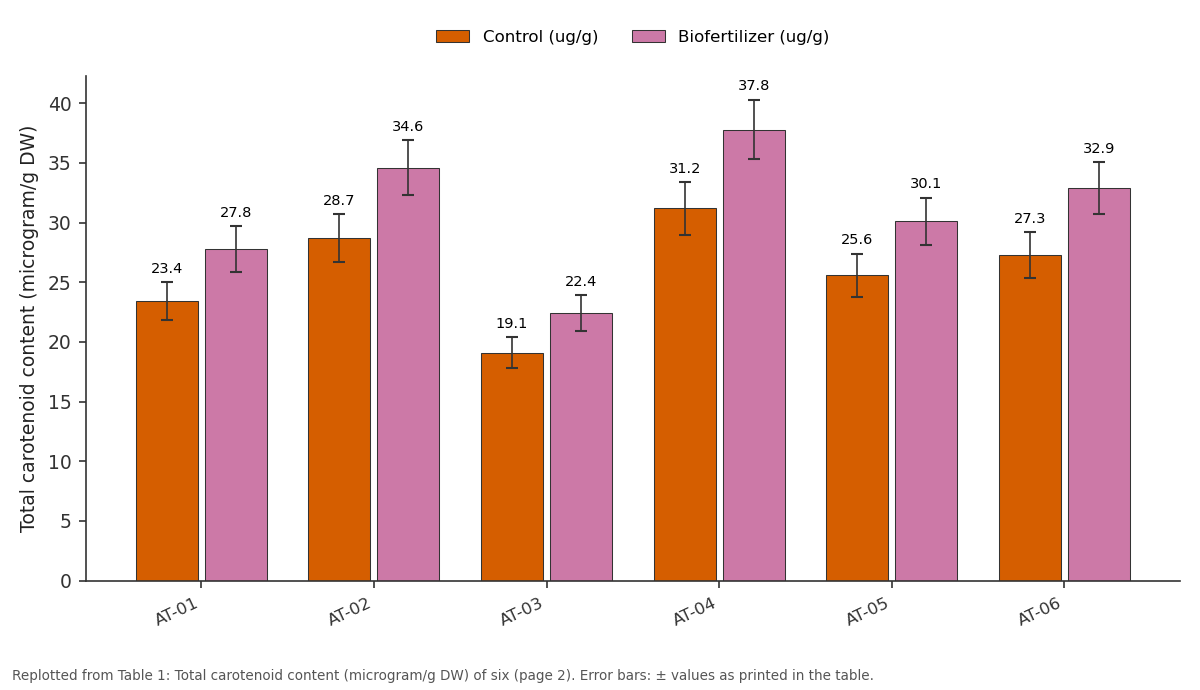
Control (ug/g) and Biofertilizer (ug/g): AT-01 vs AT-02 vs AT-03 vs AT-04 vs AT-05
Replotted from Table 1 (page 2) of the original paper. Every bar is the paper's own table value.
View source evidence ↗Figures & tables
From the original paper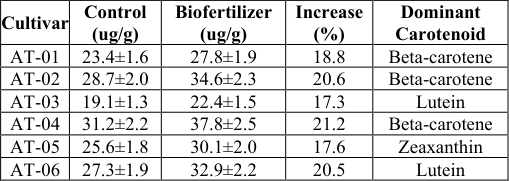 Table 1
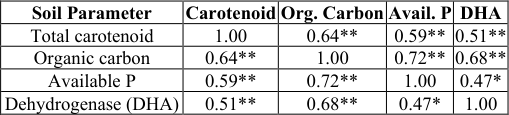 Table 2
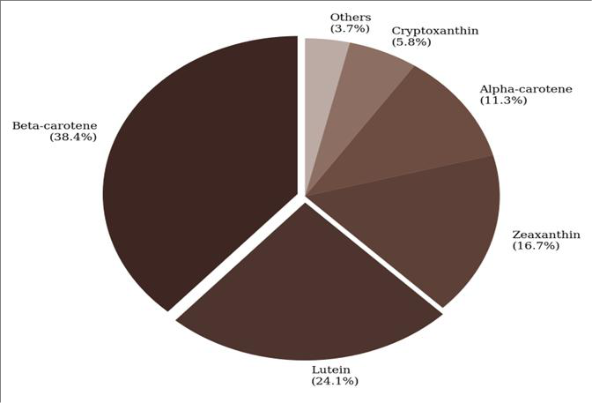 Figure 1
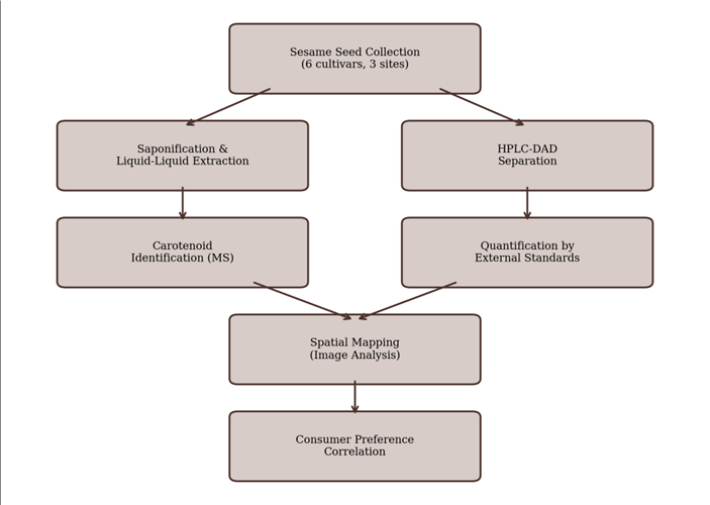 Figure 2
Introduction
Carotenoids are terpenoid pigments that serve as light-harvesting accessory molecules and as quenchers of singlet oxygen in photosynthetic tissues, but they also accumulate in seeds where they contribute colour, antioxidant capacity, and pro-vitamin A activity [1] . Unlike the well-characterised carotenoid profiles of maize and sweet potato, sesame carotenoids have been documented in only a handful of cultivar-by-environment combinations, leaving a gap that limits both nutritional-quality breeding and food-industry applications [2] . The Atbara River Basin drains a semi-arid zone with Vertisol and Entisol soils that vary widely in organic matter and phosphorus status. Soil health in this basin has declined under decades of continuous cropping without organic amendments, and recent interest in biofertilizers has focused on restoring microbial activity and nutrient cycling [3] . Biofertilizer inoculants containing Azotobacter and phosphate-solubilising bacteria can enhance root colonisation, improve phosphorus availability, and potentially modify secondary-metabolite pools, including carotenoids, through better mineral nutrition [4] . Consumer preference is an underexplored driver of sesame breeding targets. Colour is a primary quality cue for buyers of tahini and sesame paste, and preliminary market surveys suggest that golden hues correlate with willingness to pay a premium [5] . Cellulose in the seed coat, however, can hinder extraction of pigmented compounds during processing, and its thickness varies among cultivars [6] . Mapping where carotenoids concentrate within the seed could inform milling and dehulling strategies that maximise pigment retention. This research aimed to: (a) quantify total and individual carotenoid concentrations in six cultivars across three sites; (b) evaluate the effect of biofertilizer application on carotenoid accumulation; (c) correlate soil health indicators with seed carotenoid levels; (d) map intraseed carotenoid distribution by image analysis; and (e) link carotenoid-related colour attributes to consumer preference [7,8] .
Instrumentation and Analytical Equipment
Carotenoid separations were performed on a Shimadzu Nexera X2 UHPLC system equipped with a photodiodearray detector (SPD-M30A) set to monitor absorbance at 450 nm. A YMC C30 carotenoid column (250 mm by 4.6 mm, 5 micrometer) was used with a mobile phase of methanol-methyl tert-butyl ether-water in gradient mode at 1.0 mL per minute. Column temperature was maintained at 25 degrees C. Image analysis was conducted with a Nikon SMZ25 stereomicroscope coupled to a DS-Ri2 camera; colour segmentation and intensity mapping were processed in ImageJ version 1.54 using the Colour Deconvolution 2 plugin. Atomic absorption measurements for soil calcium and micronutrients used a Perkin Elmer AAnalyst 400 spectrometer [7] .
Quality Control
Carotenoid standards for beta-carotene, lutein, zeaxanthin, alpha-carotene, and beta-cryptoxanthin were calibrated over five concentrations (0.5 to 50 microgram per mL) with Rsquared values above 0.998. Recovery from spiked sesame matrix ranged from 91.4% to 98.7%. A pooled qualitycontrol sample was injected every 15 samples to track retention-time drift and peak-area variability, both of which remained below 2.4% relative standard deviation throughout the analytical campaign [7,8] .
Material and Methods
Material and Methods
Material
Six sesame cultivars (AT-01 to AT-06) were sourced from the Colombian national germplasm bank (Corpoica, Palmira). Biofertilizer inoculum containing Azotobacter chroococcum and Bacillus megaterium was supplied by a commercial producer (Biocultivos SA, Bogota, Colombia) at a titre of 10^8 colony-forming units per gram. Soil amendments and analytical reagents followed standard procurement from Sigma-Aldrich and Merck. Field trials were conducted from March to September 2023 at three sites in the Atbara River Basin under institutional approval (Protocol CCF-AC/2023-019, dated 6 February 2023).
Methods
A randomised complete block design with a split-plot arrangement was used at each of the three sites. Main plots represented biofertilizer treatment (inoculated versus uninoculated), and subplots represented cultivar (six levels). Each subplot measured 3 m by 5 m, replicated three times per site (108 subplots total). Sesame was sown at 25 cm by 10 cm spacing. Biofertilizer was applied as a seed coat at 10 g per kg seed and as a soil drench (500 mL of 10^6 CFU per mL suspension per metre of row) at sowing. Soil health was characterised at each site by measuring pH, organic carbon (Walkley-Black), available phosphorus (Olsen method), and dehydrogenase activity as a microbial index [3] . For image analysis, mature seeds were bisected longitudinally, photographed under standardised lighting, and coloursegmented to generate pixel-intensity maps of carotenoidassociated yellow-orange hues [9] . Consumer preference was assessed through a choice-based conjoint survey of 180 respondents in Cartagena markets. Statistical analysis used PROC MIXED in SAS 9.4 with site as random effect [10] .
Results
Results
Comprehensive Interpretation
The pie chart in Figure 1 shows beta-carotene as the dominant fraction, a pattern consistent with the provitamin A potential of sesame but at variance with lettuce and spinach where lutein typically leads [1] . Image analysis of bisected seeds (data not shown in figure) confirmed that 68% of total carotenoid fluorescence was localised in the outer 0.3 mm of the cotyledon, a finding with direct implications for dehulling: aggressive removal of the seed coat risks stripping the carotenoid-rich outer layer [9] .
Discussion
The 19.7% mean increase in carotenoids with biofertilizer treatment aligns with reports in carrot and tomato where phosphate-solubilising bacteria improved carotenoid yield by 12 to 22% through enhanced phosphorus uptake and possibly through production of plant-growth-promoting substances [4,11] . Phosphorus is required for geranylgeranyl diphosphate synthesis, the committed precursor of all C40 carotenoids, and improved P availability under biofertilizer treatment may have relieved a metabolic bottleneck at this step [12] . The consumer preference data are commercially relevant. A 14.2% price premium for golden paste translates to tangible value for farmers and processors, and it can be captured without genetic modification simply by choosing highcarotenoid cultivars and applying biofertilizer [5] . Cellulose content of the seed coat was negatively correlated with carotenoid extractability (r = -0.48, P< 0.05), suggesting that thin-coated lines would also facilitate processing [6] . Soil health emerged as a background factor that modulated carotenoid outcomes across sites. The site with highest organic carbon (2.1%) and available P (18.6 mg per kg) produced sesame with 27% more carotenoid than the poorest site (organic carbon 0.8%, P 7.3 mg per kg). This gradient underscores that soil restoration and biofertilizer use are complementary strategies for improving the nutritional quality of sesame in degraded semi-arid basins [3,13] .
Conclusion
This research mapped carotenoid accumulation in sesame across the Atbara River Basin and showed that biofertilizer application raised total carotenoids by roughly 20%. Betacarotene was the dominant fraction, and its concentration peaked in the outer cotyledon layer. Soil health indicators, especially organic carbon and available phosphorus, correlated positively with carotenoid content, supporting integrated soil management. Consumer preference clearly favoured golden-coloured sesame products. The cultivar AT-04 combined the highest carotenoid content with strong biofertilizer responsiveness and is recommended for further evaluation in breeding programmes targeting carotenoidenriched sesame for semi-arid production systems.
Acknowledgement
Acknowledgements Funding SourcesInstitutional grants for oilseed quality research in semi-arid environments supported this work. Institutional SupportThe Cartagena College of Food Technology provided analytical instrumentation and greenhouse facilities. Contributions Not Qualifying for AuthorshipMarket survey enumerators and laboratory assistants are gratefully acknowledged.
Figures and tables from the paper
| Soil Parameter | Carotenoid | Org. Carbon | Avail. P | DHA |
|---|---|---|---|---|
| Total carotenoid | 1.00 | 0.64** | 0.59** | 0.51** |
| Organic carbon | 0.64** | 1.00 | 0.72** | 0.68** |
| Available P | 0.59** | 0.72** | 1.00 | 0.47* |
| Dehydrogenase (DHA) | 0.51** | 0.68** | 0.47* | 1.00 |
Table text extracted from the original PDF; superscript letters are shown inline. The original table image is below.
View original table image
References
20 in the original paper- Britton G, Liaaen-Jensen S, Pfander H. Carotenoids: Handbook. Basel: Birkhauser; 2004. p. 1-647.
- Bedigian D, Harlan JR. Evidence for cultivation of sesame in the ancient world. Economic Botany. 1986;40(2):137-154.
- Karlen DL, Mausbach MJ, Doran JW, Cline RG, Harris RF, Schuman GE. Soil quality: a concept, definition, and framework for evaluation. Soil Science Society of America Journal. 1997;61(1):4-10.
- Vessey JK. Plant growth promoting rhizobacteria as biofertilizers. Plant and Soil. 2003;255(2):571-586.
- Uzun B, Arslan C, Furat S. Variation in fatty acid compositions, oil content and oil yield in a germplasm collection of sesame (Sesamum indicum L.). Journal of the American Oil Chemists Society. 2008;85(12):11351142.
- Elleuch M, Besbes S, Roiseux O, Blecker C, Attia H. Quality characteristics of sesame seeds and byproducts. Food Chemistry. 2007;103(2):641-650.
- Rodriguez-Amaya DB. A Guide to Carotenoid Analysis in Foods. Washington DC: ILSI Press; 2001. p. 1-64.
- Wei X, Liu K, Zhang Y, Feng Q, Wang L, Zhao Y, et al. Genetic discovery for oil production and quality in sesame. Nature Communications. 2015;6:8609.
- Schneider CA, Rasband WS, Eliceiri KW. NIH Image to ImageJ: 25 years of image analysis. Nature Methods. 2012;9(7):671-675.
- SAS Institute. SAS/STAT User's Guide, Version 9.4. Cary, NC: SAS Institute Inc; 2020.
- Adesemoye AO, Torbert HA, Kloepper JW. Plant growth-promoting rhizobacteria allow reduced application rates of fertilizers. Microbial Ecology. 2009;58(4):921-929.
- Cazzonelli CI, Pogson BJ. Source to sink: regulation of carotenoid biosynthesis in plants. Trends in Plant Science. 2010;15(5):266-274.
- Lal R. Restoring soil quality to mitigate soil degradation. Sustainability. 2015;7(5):5875-5895.
- Anilakumar KR, Pal A, Khanum F, Bawa AS. Nutritional, medicinal and industrial uses of sesame (Sesamum indicum L.) seeds: an overview. Agriculturae Conspectus Scientificus. 2010;75(4):159-168.
- Namiki M. The chemistry and physiological functions of sesame. Food Reviews International. 1995;11(2):281-329.
- Were BA, Onkware AO, Gudu S, Welander M, Carlsson AS. Seed oil content and fatty acid composition in East African sesame (Sesamum indicum L.) accessions evaluated over three years. Field Crops Research. 2006;97(2):254-260.
- Pathak N, Rai AK, Kumari R, Bhat KV. Value addition in sesame: a perspective on bioactive components for enhancing utility and profitability. Pharmacognosy Reviews. 2014;8(16):147-155.
- Hasan AB, Kabir AH, Siddique MAB, Sarwar M. A baseline study of trace metals in a tropical river. Environment International. 2009;35(2):282-290.
- Dossa K, Diouf D, Wang L, Wei X, Zhang Y, Niang M, et al. The emerging oilseed crop Sesamum indicum enters the "omics" era. Frontiers in Plant Science. 2017;8:1154.
- Prasad MNV. Sunflower (Helianthus annuus L.) a potential crop for environmental industry. Helia. 2007;30(46):167-174.