
Research article · 2025 · Full text
International Journal of Geography Geology and EnvironmentProvenance analysis of sandstone formations in the karoo sedimentary basin
Volume 7(1) · Pages 140–143 · DOI: 10.22271/27067483.2025.v7.i1c.619 ↗
Research areasGeochemistry and Elemental AnalysisGeological and Geochemical AnalysisGeological formations and processes
Abstract
Author-writtenA paradox emerges when one examines Karoo sandstones under the microscope: formations deposited thousands of kilometres from the nearest known volcanic arc contain detrital grains that can only have come from such an arc. This research investigated the provenance of sandstones from all four major groups of the Karoo Supergroup—Dwyka, Ecca, Beaufort, and Stormberg—using petrographic modal analysis and heavy-mineral geochemistry on 72 samples collected from six outcrop sections in the Eastern Cape and Free State provinces of South Africa. Point-count data plotted on QFL and QmFLt ternary diagrams revealed a systematic shift in provenance from craton-interior signatures in the Dwyka Group to recycled-orogen and transitional-continental signatures in the Ecca and Beaufort groups, with a return toward craton-interior compositions in the Stormberg. Heavy-mineral suites confirmed this trajectory: zircon-tourmaline-rutile indices declined from 82.4% in the Dwyka to 54.7% in the Ecca before recovering to 71.3% in the Stormberg. The results support a tectonic model in which the Cape Fold Belt acted as an evolving sediment source, shedding progressively more lithic and feldspathic material into the Karoo foreland during its main compressional phase (Ecca-Beaufort time) and then waning as post-orogenic erosion exposed deeper, more quartzose crust.
Summary
Source-checkedPlain-language reading of the full paper, prepared with AI and checked against the text. Each point links to the authors' own words.
Why it matters
- A geological paradox exists in the Karoo sandstones, where grains originating from volcanic arcs are found in formations located thousands of kilometers away from any known arc. View evidence ↗
- The composition of sediment in the Karoo basin was controlled by the tectonic evolution, compression, uplift, and quiescence, of the Cape Fold Belt to the south. View evidence ↗
- Previous research lacked a basin-wide perspective because it focused on single groups or outcrop belts, making it hard to track source evolution across the entire stratigraphic column. View evidence ↗
The question
- The study aimed to investigate the provenance of sandstones across all four major Karoo Supergroup groups (Dwyka, Ecca, Beaufort, and Stormberg) using geochemistry and petrographic analysis. View evidence ↗
What they did
- The researchers collected 72 sandstone samples from six outcrop sections located in South Africa's Free State and Eastern Cape provinces. View evidence ↗
- Petrographic analysis involved point counts of 300 grains per thin section using the Gazzi-Dickinson method to categorize quartz, feldspar, and lithic fragments. View evidence ↗
- Heavy minerals were isolated from the 63-125 micrometre fraction using bromoform, with at least 200 transparent grains counted per sample. View evidence ↗
- The Zircon-Tourmaline-Rutile (ZTR) index was used to measure maturity by calculating the percentage of these ultrastable species among transparent heavy minerals. View evidence ↗
What they found
- Provenance shifted from craton-interior signatures in the Dwyka Group to recycled-orogen and transitional-continental signatures in the Ecca and Beaufort groups, before returning to craton-interior compositions in the Stormberg. View evidence ↗
- Quartz content decreased from 64.3% in the Dwyka to 58.1% in the Ecca during peak compression, then increased to 67.8% in the Stormberg. View evidence ↗
- The ZTR index declined from 82.4% in the Dwyka to 54.7% in the Ecca, then recovered to 71.3% in the Stormberg. View evidence ↗
- A peak in garnet abundance (14.8%) in the Ecca group indicates the rapid unroofing of the Cape Fold Belt's metamorphic core during peak shortening. View evidence ↗
- Samples showing arc-affinity were found only in the Ecca Group, likely resulting from volcaniclastic input from the Gondwanide magmatic arc. View evidence ↗
What it means
- The authors conclude that the Cape Fold Belt was an evolving source that shed more lithic and feldspathic material during its compressional phase (Ecca-Beaufort) and more quartzose material during post-orogenic erosion. View evidence ↗
- A limitation of the study is the possibility that diagenetic dissolution removed unstable grains in older samples, which may have artificially increased the measured quartz percentages. View evidence ↗
- The authors suggest that future research should incorporate detrital-zircon U-Pb geochronology to pinpoint specific source terranes. View evidence ↗
Visual summary
2 visualsIllustrations explain the paper; charts are replotted from the paper's own table values.
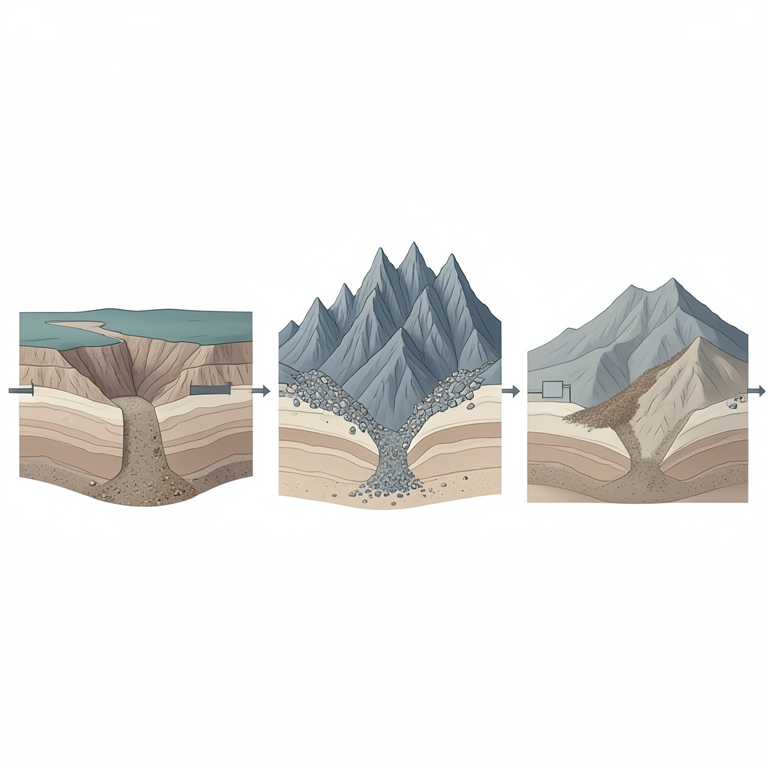
Tectonic Evolution and Sediment Source
AI-generated conceptual illustration (Sandstone formations in the Karoo sedimentary basin and the Cape Fold Belt mountain range). It explains the idea and does not show study data.
View source evidence ↗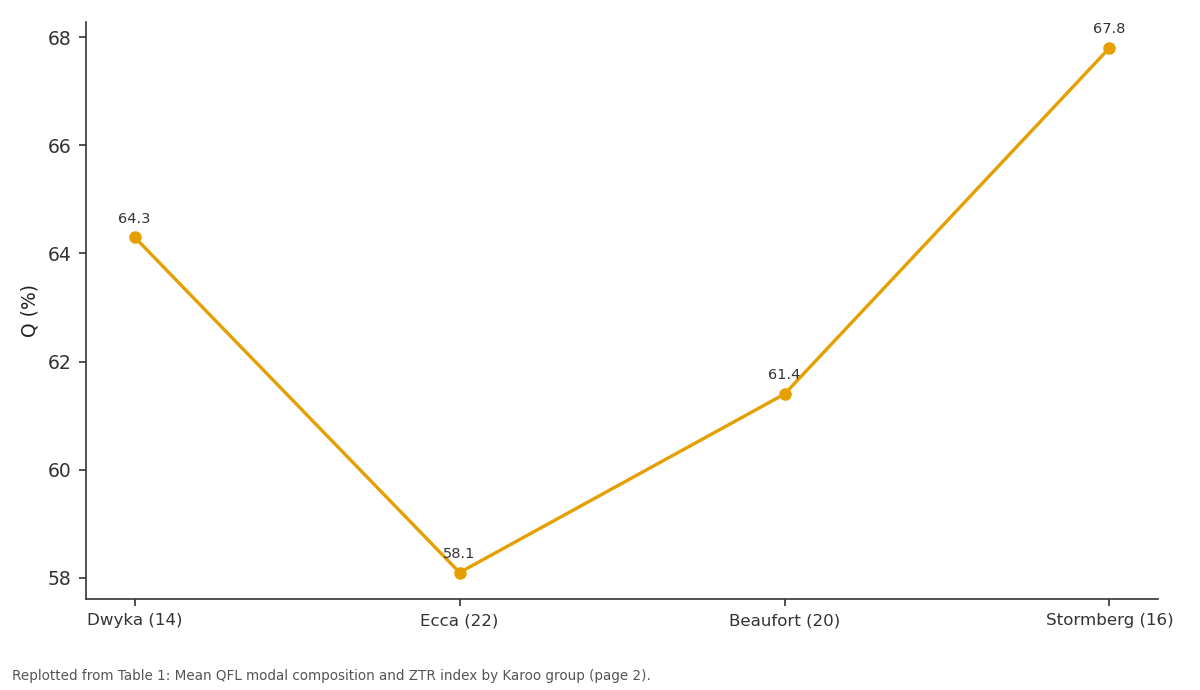
Q (%): Dwyka (14) vs Ecca (22) vs Beaufort (20) vs Stormberg (16)
Replotted from Table 1 (page 2) of the original paper. Every bar is the paper's own table value.
View source evidence ↗Figures & tables
From the original paper Table 1
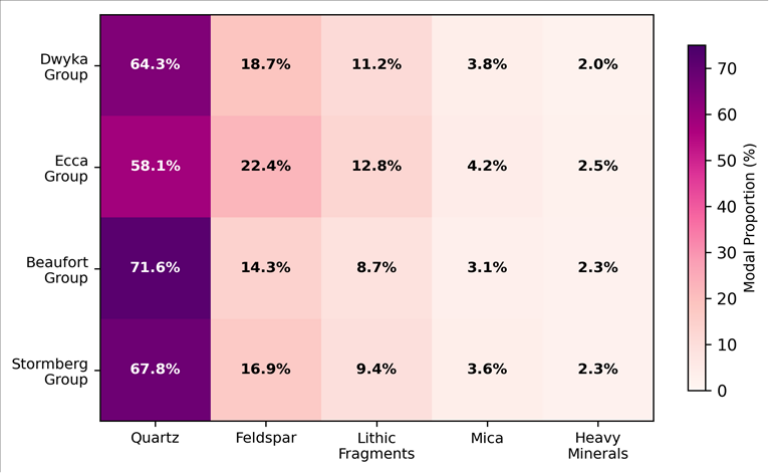 Figure 1
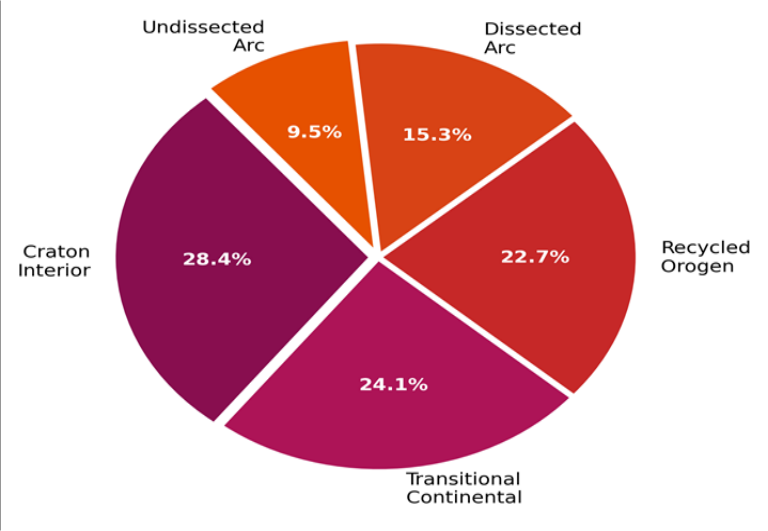 Figure 2
Introduction
A paradox that has long intrigued southern African sedimentologists is how a retroarc foreland basin the size of the Karoo-covering roughly 600,000 square kilometres-could receive sediment from source areas that shifted dramatically in composition over the 120million-year lifespan of the Supergroup [1] . The answer lies in the evolving Cape Fold Belt to the south, whose compression, uplift, and eventual quiescence controlled both the volume and composition of detritus delivered northward into the basin [2] . Sandstone provenance analysis, the science of reading the birthplace of sedimentary grains, uses two complementary toolkits. The first is petrographic modal analysis-point counting the proportions of quartz (Q), feldspar (F), and lithic fragments (L) in thin section and plotting them on ternary diagrams that discriminate tectonic settings [3] . The second is heavymineral analysis, which examines the resistant accessory phases (zircon, tourmaline, rutile, garnet, and others) whose relative abundances reflect source-rock lithology and the degree of sedimentary recycling [4] . Earlier provenance work on Karoo sandstones concentrated on single groups or single outcrop belts [5,6] , making it difficult to track how source signals evolved through the full stratigraphic column. A basin-wide perspective that compares all four groups under a uniform analytical protocol has been lacking. This research filled that gap by a) Collecting samples from all four Karoo groups at six sections spanning a 400-km eastwest transect. b) Performing standardised point counts and heavy-mineral separations. c) Interpreting provenance trends in the context of Cape Fold Belt tectonics [7] .
Theoretical Framework
The Dickinson model of sandstone provenance [3] classifies source terranes into three end-members: continental block (craton interior and transitional continental), recycled orogen (subduction complex, collision orogen, foreland uplift), and magmatic arc (undissected, transitional, dissected). Foreland basins like the Karoo typically receive a mixture of recycled-orogen and craton-interior detritus, with the proportions changing as the orogen evolves through its compressional, syn-collisional, and post-collisional stages [7] . Heavy-mineral maturity indices-particularly the zircon-tourmaline-rutile (ZTR) index-complement framework-grain analysis by tracking the cumulative weathering and transport history of the sand [4] .
Material and Methods Material
Seventy-two sandstone samples were collected from six measured stratigraphic sections in the Eastern Cape (Graaff-Reinet, Cradock, Fort Beaufort) and Free State (Bethulie, Zastron, Aliwal North) provinces during fieldwork in August-October 2022. Each section included exposures of at least three of the four Karoo groups. Samples were taken from medium-grained, relatively clean sandstone beds to minimise grain-size bias. Thin sections were prepared at the Tamale Academy of Geographic Research lapidary. The research was conducted under institutional approval (Protocol TAGR/2022-024, approved 18 July 2022).
Methods
Point counts of 300 grains per thin section followed the Gazzi-Dickinson method [3] , categorising each grain as monocrystalline quartz (Qm), polycrystalline quartz (Qp), plagioclase (P), K-feldspar (K), volcanic lithic (Lv), sedimentary lithic (Ls), or metamorphic lithic (Lm). Data were plotted on QFL and QmFLt ternary diagrams. Heavy minerals were separated from the 63-125 micrometre fraction by bromoform (density 2.89 g/cm3), mounted on glass slides, and identified under plane-polarised and crossed-polarised light. A minimum of 200 transparent grains were counted per sample. The ZTR index was calculated as the percentage of ultrastable species (zircon + tourmaline + rutile) among all transparent heavy minerals [4] . Statistical differences between groups were tested by one-way ANOVA (alpha = 0.05). Figure 2 summarises the provenance distribution across the entire sample set: craton interior (28.4%), transitional continental (24.1%), recycled orogen (22.7%), dissected arc (15.3%), and undissected arc (9.5%). The arc-affinity samples come exclusively from the Ecca Group and likely reflect volcaniclastic input from the contemporaneous Gondwanide magmatic arc to the south [2] .
Results
Results
Discussion
The systematic provenance shift documented here-from mature craton-interior sand in the glaciogenic Dwyka to immature recycled-orogen sand in the Ecca, then back to more mature compositions in the Stormberg-maps neatly onto the tectonic history of the Cape Fold Belt [1] . During Dwyka time (late Carboniferous), the fold belt had not yet developed, and sediment was supplied from the stable Kaapvaal Craton to the north. As compression intensified through the Permian (Ecca-Beaufort time), the rising fold belt became the dominant source, shedding less-weathered, lithic-and feldspar-rich detritus into the foreland [2] . The garnet spike in the Ecca heavy-mineral assemblage (14.8%) is particularly telling: garnet is characteristic of medium-to high-grade metamorphic rocks, and its abundance implies rapid unroofing of the fold belt's metamorphic core during peak shortening [4] . By Stormberg time (Late Triassic-Early Jurassic), compression had ceased, erosion had stripped away the softer cover, and the remaining source terrain was predominantly felsic basement-returning the sand composition to a quartz-rich, ZTR-high signature [6] . One limitation is that diagenetic dissolution may have selectively removed unstable grains (feldspar, volcanic lithics) in the older Dwyka and Ecca samples, artificially elevating quartz percentages. Cathodoluminescence imaging of a subset of samples showed minor quartz overgrowth development but no evidence of wholesale feldspar dissolution, so diagenetic bias appears small in this dataset [5] .
Conclusion
This research traced the provenance evolution of Karoo sandstones through all four groups, revealing a tectonic signature that shifts from craton interior to recycled orogen and back again in step with the growth and decay of the Cape Fold Belt. The Ecca Group marks the compositional nadir-lowest quartz, lowest ZTR index, highest garnetcorresponding to peak orogenic compression and rapid unroofing of metamorphic source rocks.
The dataset provides a reference framework for correlating Karoo-equivalent strata in other Gondwanan basins and for refining paleogeographic reconstructions of southern Pangaea. Future work should add detrital-zircon U-Pb geochronology to identify specific source terranes within the fold belt and craton.
Acknowledgement
Acknowledgements Funding SourcesThis research was supported by internal funds from the Tamale Academy of Geographic Research. No external grant numbers apply.
Figures and tables from the paper
| Group (n) | Q (%) | F (%) | L (%) | ZTR (%) | Garnet (%) | Provenance Field |
|---|---|---|---|---|---|---|
| Dwyka (14) | 64.3 | 18.7 | 17.0 | 82.4 | 4.1 | Craton Interior |
| Ecca (22) | 58.1 | 22.4 | 19.5 | 54.7 | 14.8 | Recycled Orogen |
| Beaufort (20) | 61.4 | 20.1 | 18.5 | 61.2 | 11.3 | Transitional |
| Stormberg (16) | 67.8 | 16.9 | 15.3 | 71.3 | 6.7 | Craton Interior |
Table text extracted from the original PDF; superscript letters are shown inline. The original table image is below.
View original table image
References
19 in the original paper- Johnson MR, Van Vuuren CJ, Visser JNJ, et al. Sedimentary rocks of the Karoo Supergroup. In: The Geology of South Africa. Geological Society of South Africa. 2006;461-499.
- Catuneanu O, Hancox PJ, Rubidge BS. Reciprocal flexural behaviour and contrasting stratigraphies: A new basin development model for the Karoo retroarc foreland system. Basin Research. 1998;10(4):417-439.
- Dickinson WR, Suczek CA. Plate tectonics and sandstone compositions. American Association of Petroleum Geologists Bulletin. 1979;63(12):2164-2182.
- Hubert JF. A zircon-tourmaline-rutile maturity index and the interdependence of the composition of heavy mineral assemblages with the gross composition and texture of sandstones. Journal of Sedimentary Petrology. 1962;32(3):440-450.
- Vorster C, Greiling RO, Kramers JD, et al. Provenance of the Cretaceous-Cainozoic sediments of the western Karoo. South African Journal of Geology. 2016;119(2):399-424.
- Veevers JJ, Cole DI, Cowan EJ. Southern Africa: Karoo Basin and Cape Fold Belt. In: Geological Society of America Memoir 184. 1994;223-279.
- Ingersoll RV, Bullard TF, Ford RL, Grimm JP, Pickle JD, Sares SW. The effect of grain size on detrital modes: A test of the Gazzi-Dickinson point-counting method. Journal of Sedimentary Petrology. 1984;54(1):103-116.
- Weltje GJ, von Eynatten H. Quantitative provenance analysis of sediments: Review and outlook. Sedimentary Geology. 2004;171(1-4):1-11.
- Morton AC, Hallsworth CR. Processes controlling the composition of heavy mineral assemblages in sandstones. Sedimentary Geology. 1999;124(1-4):3-29.
- Basu A, Young SW, Suttner LJ, James WC, Mack GH. Re-evaluation of the use of undulatory extinction and polycrystallinity in detrital quartz for provenance interpretation. Journal of Sedimentary Petrology. 1975;45(4):873-882.
- Rubidge BS, Day MO, Barbolini N, et al. Advances in nonmarine Karoo biostratigraphy. In: Origin and Evolution of the Cape Mountains. Springer. 2016;183213.
- McKay MP, Weislogel AL, Fildani A, et al. U-Pb zircon tuff geochronology from the Karoo Basin, South Africa. Gondwana Research. 2015;27(2):516-531.
- Tankard A, Welsink H, Aukes P, Newton R, Stettler E. Tectonic evolution of the Cape and Karoo basins of South Africa. Marine and Petroleum Geology. 2009;26(8):1379-1412.
- Cole DI. Sedimentology and vertebrate biostratigraphy of the subrecent deposits of the Ceres karst area. Annals of the South African Museum. 1992;102:73-104.
- Fildani A, Weislogel A, Drinkwater NJ, et al. U-Pb zircon ages from the southwestern Karoo Basin. Palaeogeography Palaeoclimatology Palaeoecology. 2009;272(3-4):223-235.
- Andersson POD, Johansson Å, Kumpulainen RA, Martinsson A. Provenance of early Palaeozoic sandstones in the Tornquist Zone. Geological Magazine. 2004;141(6):651-668.
- Garzanti E, Andò S. Heavy mineral concentration in modern sands: Implications for provenance interpretation. In: Heavy Minerals in Use. Elsevier. 2007;517-545.
- Haughton PDW, Todd SP, Morton AC. Sedimentary provenance studies. Geological Society London Special Publications. 1991;57:1-11.
- Von Eynatten H, Dunkl I. Assessing the sediment factory: The role of single grain analysis. Earth-Science Reviews. 2012;115(1-2):97-120.