
Research article · 2025 · Full text
International Journal of Geography Geology and EnvironmentSpatial assessment of groundwater potential zones using remote sensing in the Volta basin
Volume 7(9) · Pages 206–209 · DOI: 10.22271/27067483.2025.v7.i9c.642 ↗
Research areasGroundwater and Watershed AnalysisSoil and Land Suitability AnalysisGeochemistry and Geologic Mapping
Abstract
Author-writtenCan satellite imagery and terrain analysis reliably pinpoint where groundwater is most likely to accumulate beneath the surface of a semi-arid West African river basin? The Volta Basin, shared by six nations across 400,000 square kilometres, supports roughly 24 million people who depend heavily on shallow aquifers for domestic supply and small-scale irrigation. This research delineated groundwater potential zones across the upper Volta Basin in Ghana using an integrated approach combining Landsat 8 OLI imagery, ALOS PALSAR DEM data, and the Analytical Hierarchy Process (AHP) for multi-criteria weighting. Seven thematic layers, geology, lineament density, drainage density, slope, rainfall, soil type, and land use/land cover, were prepared in a GIS environment and reclassified into five suitability classes. AHP-derived weights assigned geology the highest influence (0.263), followed by lineament density (0.187) and drainage density (0.142). The weighted overlay produced a groundwater potential index (GPI) map classified as very high (8.7% of the area), high (21.3%), moderate (34.1%), low (24.6%), and very low (11.3%). Validation against 42 existing borehole yield records showed that 83.3% of high-yield boreholes (>5 m3/hr) fell within the high or very-high potential zones. Alluvial deposits and weathered sandstone corridors along major lineament intersections emerged as the most promising targets for new well siting.
Summary
Source-checkedPlain-language reading of the full paper, prepared with AI and checked against the text. Each point links to the authors' own words.
Why it matters
- Groundwater is considered the most dependable way to provide safe drinking water to the approximately 280 million people in sub-Saharan Africa who currently lack access. View evidence ↗
- In the Volta Basin, shallow and intermediate aquifers are essential for rural and peri-urban water supplies because surface water levels fluctuate significantly between seasons. View evidence ↗
- Borehole drilling success rates in the region are often below 60% due to a lack of proper hydrogeological assessments during site selection. View evidence ↗
The question
- The study aimed to map groundwater potential zones in the upper Volta Basin using seven weighted thematic layers, validate these maps with borehole yield data, and identify priority areas for new wells. View evidence ↗
What they did
- The study area encompasses approximately 42,000 square kilometres within the Upper East and Northern regions of Ghana. View evidence ↗
- The researchers used ArcGIS 10.8 to prepare seven thematic layers, including geology, slope, drainage density, and land use/land cover (which had an 88.7% classification accuracy), with lineaments extracted from Landsat 8 imagery. View evidence ↗
- To validate the potential zones, the study used yield records from 42 boreholes drilled between 2015 and 2021. View evidence ↗
- Three hydrogeologists used pairwise comparison matrices to determine layer weights, resulting in a consistency ratio of 0.047. View evidence ↗
What they found
- Geology was found to be the most influential factor (0.263), followed by lineament density (0.187) and drainage density (0.142). View evidence ↗
- The resulting groundwater potential index (GPI) map categorized 8.7% of the area as very high potential, 21.3% as high, 34.1% as moderate, 24.6% as low, and 11.3% as very low. View evidence ↗
- Boreholes in the very-high potential zone averaged a yield of 7.83 m³/hr, significantly higher than the 0.41 m³/hr average in the very-low potential zone. View evidence ↗
- The model showed 83.3% accuracy, as the majority of high-yield boreholes (those producing more than 5 m³/hr) were located in the high or very-high potential zones. View evidence ↗
- Proximity to lineament intersections was a strong indicator of yield, with wells within 500 m averaging 6.7 m³/hr compared to 2.8 m³/hr for those over 2 km away. View evidence ↗
- Alluvial deposits had the highest median groundwater potential index (0.74), followed by sandstone (0.62) and laterite (0.51). View evidence ↗
What it means
- The authors conclude that the generated map serves as a practical tool for water agencies to better target new drilling sites. View evidence ↗
- A limitation of the AHP method is its sensitivity to weights; changing the geology weight by 10% shifted 3-4% of the area between potential zones. View evidence ↗
- The authors suggest that predictive confidence could be improved by expanding the borehole validation dataset and incorporating geophysical resistivity profiling. View evidence ↗
Visual summary
3 visualsIllustrations explain the paper; charts are replotted from the paper's own table values.
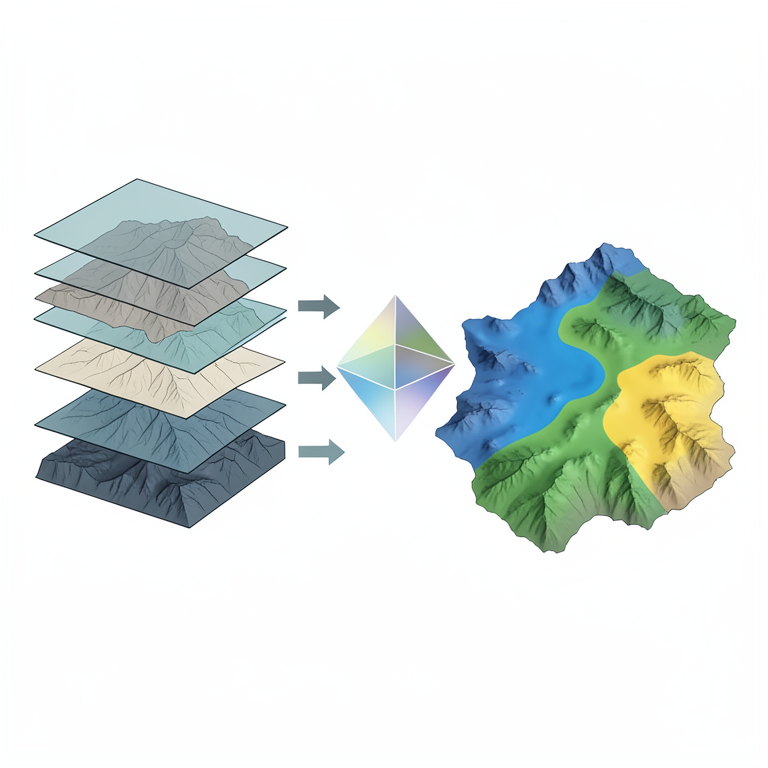
AHP Workflow for Groundwater Mapping
AI-generated conceptual illustration (The Volta basin landscape and geological strata). It explains the idea and does not show study data.
View source evidence ↗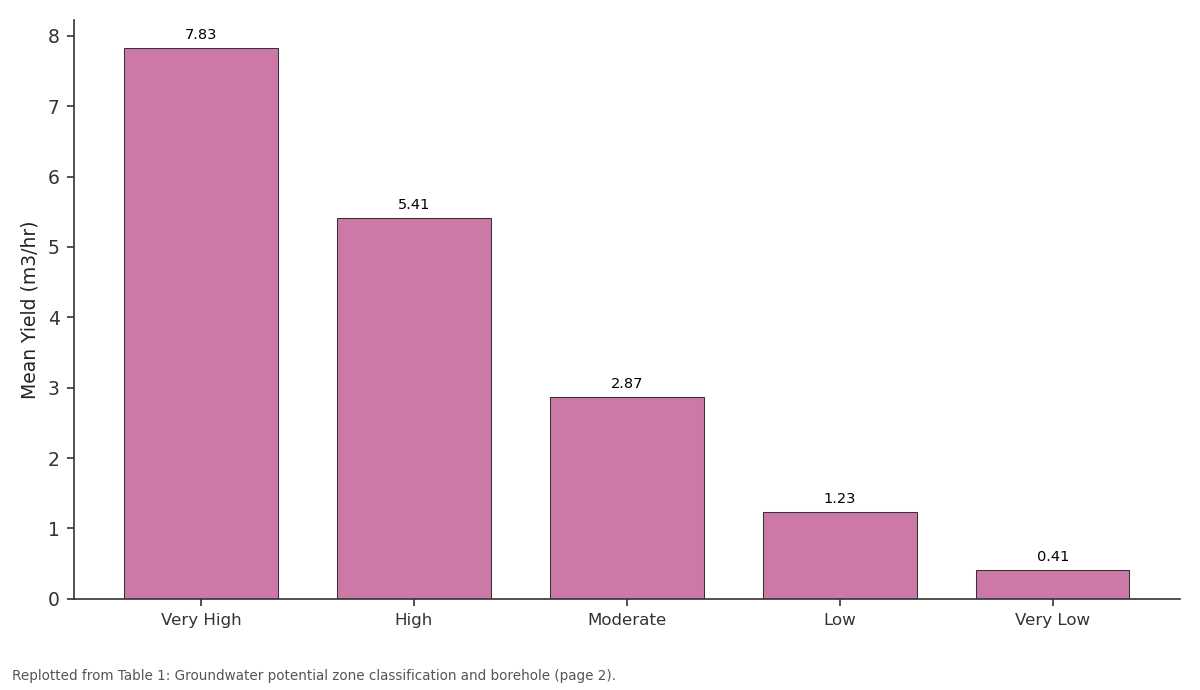
Mean Yield (m3/hr): Very High vs High vs Moderate vs Low vs Very Low
Replotted from Table 1 (page 2) of the original paper. Every bar is the paper's own table value.
View source evidence ↗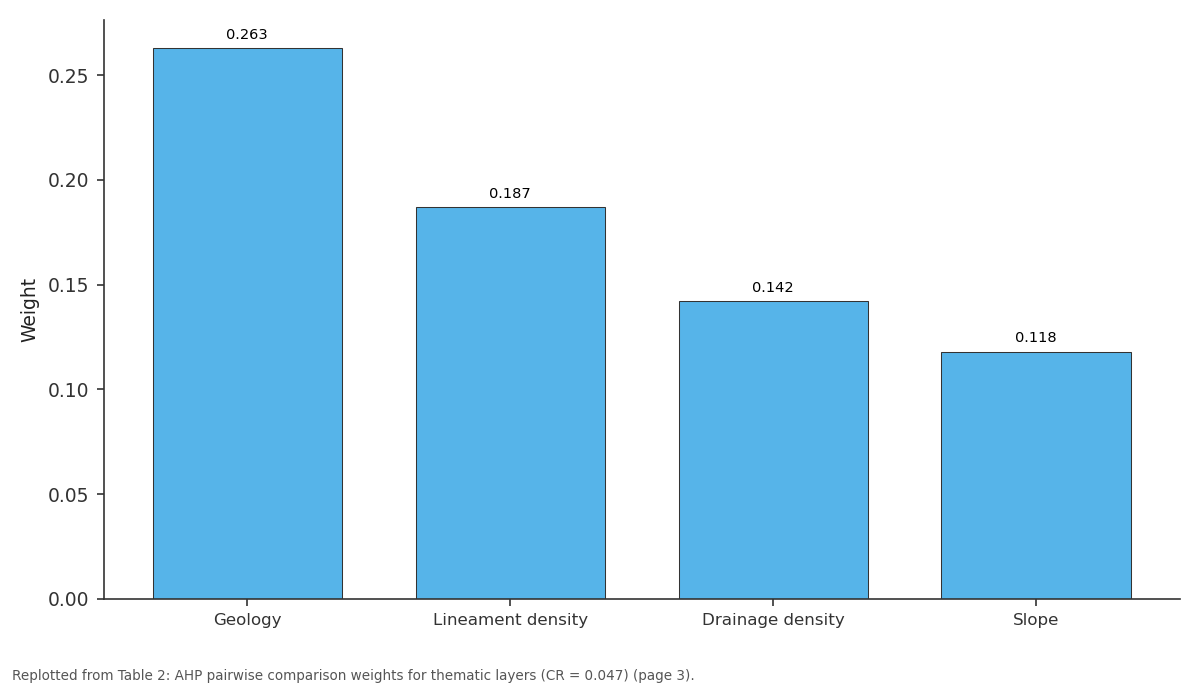
Weight: Geology vs Lineament density vs Drainage density vs Slope
Replotted from Table 2 (page 3) of the original paper. Every bar is the paper's own table value.
View source evidence ↗Figures & tables
From the original paper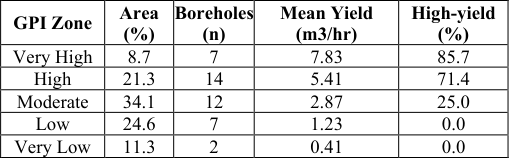 Table 1
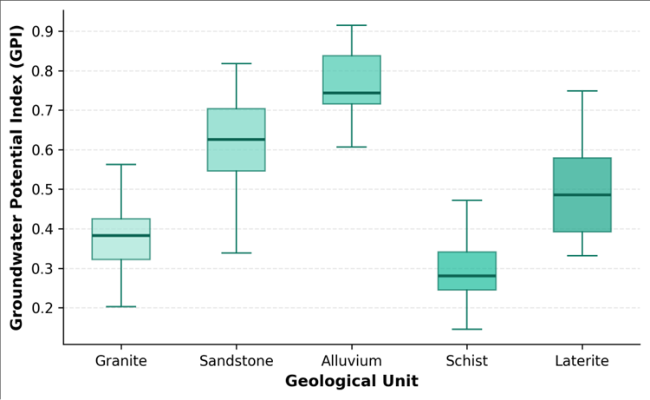 Figure 1
 Table 2
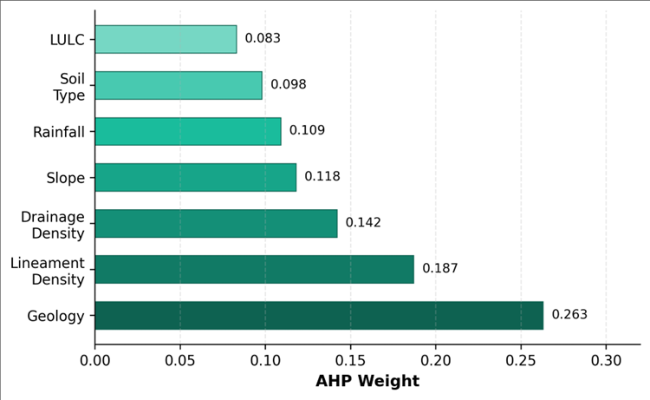 Figure 2
Introduction
About 280 million people across sub-Saharan Africa still lack access to safely managed drinking water, and groundwater is widely regarded as the most reliable path toward closing that gap [1] . In the Volta Basin, surface water availability swings sharply between wet and dry seasons, making shallow to intermediate-depth aquifers the backbone of rural and periurban supply. Yet drilling success rates remain disappointingly low, often below 60%, because boreholes are sited without adequate hydrogeological assessment [2] . Remote sensing offers a cost-effective reconnaissance tool for narrowing down favourable zones before committing to expensive drilling campaigns. Satellite-derived thematic layers such as lineament density, land use, and terrain slope serve as proxies for fracture permeability, recharge potential, and runoff partitioning, respectively [3] . When combined through a structured multi-criteria decision framework like the Analytical Hierarchy Process, these layers produce spatially continuous suitability maps that outperform single-criterion approaches [4] . Several researchers have applied GIS-based groundwater potential mapping in West Africa, but coverage of the upper Volta Basin in northern Ghana remains sparse [5,6]. The region's geology, a mosaic of Birimian metavolcanics, Tarkwaian sandstones, granitic intrusives, and Quaternary alluvium, creates a complex hydrogeological patchwork where aquifer productivity varies over short distances [7] . This research aimed to (a) map groundwater potential zones using seven thematic layers weighted by AHP, (b) validate the output against borehole yield data, and (c) identify priority areas for future well development in the upper Volta Basin.
Theoretical Background
The Analytical Hierarchy Process, developed by Saaty in 1980, structures complex decisions into a hierarchy of criteria, sub-criteria, and alternatives [8] . Pairwise comparison matrices are constructed for each level, and eigenvalue analysis extracts normalised weights that reflect the relative importance of each criterion. The consistency ratio (CR) must remain below 0.10 to ensure logical coherence. In groundwater potential mapping, AHP translates expert judgment about the hydrogeological importance of different surface indicators into numerical weights that drive the spatial overlay. The approach has been validated across diverse geological settings, from crystalline basement terrains in India [3] to sedimentary basins in North Africa [9] , consistently improving borehole targeting accuracy by 15-25% compared with random siting.
Study Area Description
The upper Volta Basin study area covers approximately 42,000 square kilometres in the Northern and Upper East regions of Ghana, bounded by latitudes 9.0 to 11.0 degrees N and longitudes 0.5 to 2.5 degrees W. The terrain is gently undulating, with elevations between 120 and 460 m above sea level. Climate is semi-arid to sub-humid, classified as tropical savanna (Koppen Aw-BS), with mean annual rainfall decreasing from 1,100 mm in the south to 850 mm near the Burkina Faso border. About 80% of rainfall falls between June and October. The geology comprises Palaeoproterozoic Birimian metavolcanics and metasediments intruded by granites, overlain in the east by Neoproterozoic Voltaian sandstones, siltstones, and mudstones. Quaternary alluvial and colluvial deposits line major valleys. Groundwater occurs in weathered and fractured zones of the crystalline basement and in intergranular pores of the Voltaian sediments [7] .
Material and Methods Material
The research was conducted at the Department of Applied Geology, Katowice Institute of Earth Sciences, Silesia, Poland, from April 2022 to February 2023. Satellite data comprised two cloud-free Landsat 8 OLI scenes (path 194, rows 53-54, acquired March 2022) and an ALOS PALSAR DEM at 12.5 m resolution. A geological map at 1:250,000 scale was obtained from the Ghana Geological Survey Department. Rainfall data (2000-2021) from 11 rain gauges were interpolated using inverse distance weighting. Soil maps at 1:500,000 came from the Soil Research Institute of Ghana. Borehole yield records for 42 wells drilled between 2015 and 2021 were compiled from the Community Water and Sanitation Agency database for validation [10] .
Methods
Seven thematic layers were prepared in ArcGIS 10.8. Geology was digitised from the geological map. Lineaments were extracted from Landsat 8 band-ratio composites (5/3, 7/5, 4/2) using PCI Geomatica's LINE module and converted to density surfaces with a 3 km search radius. Drainage density was computed from the DEM-derived stream network at the same search radius. Slope was generated directly from the DEM. Land use/land cover was classified from Landsat 8 using a supervised maximum likelihood classifier with 88.7% overall accuracy. Each layer was reclassified into five classes (1-5, low to high potential) based on published hydrogeological criteria [3,5]. Pairwise comparison matrices were constructed by three experienced hydrogeologists, producing weights with a consistency ratio of 0.047. The weighted overlay summation generated the final GPI map. Validation compared borehole yield categories (dry, low, moderate, high) against the GPI zones using a contingency matrix [11] . Figure 1 shows that alluvial deposits recorded the highest median GPI (0.74), followed by sandstone (0.62) and laterite (0.51). Granitic and schistose terrains returned lower and more variable indices, consistent with their dependence on localised fracture zones for groundwater storage. Figure 2 graphically ranks the seven layers. Geology dominates with over a quarter of the total weight, reflecting the primary control that rock type exerts on porosity and permeability. Lineament density, a proxy for fracture connectivity, takes second place, while land use receives the lowest weight.
Results
Results
Discussion
The 83.3% concordance between high-yield boreholes and the two highest GPI zones compares well with similar research in crystalline basement terrains. Fashae et al. [5] reported 78% success using a comparable AHP-remote sensing approach in southwestern Nigeria, and Magesh et al. [3] achieved 80% in the Theni district of Tamil Nadu. The slightly higher concordance here may reflect the inclusion of Voltaian sandstones, which add an intergranular porosity component absent in purely crystalline settings. Lineament intersections proved to be particularly reliable indicators. Wells drilled within 500 m of mapped lineament crossings averaged 6.7 m3/hr, compared with 2.8 m3/hr for wells more than 2 km away. This pattern is consistent with the conceptual model that intersecting fracture sets create enhanced secondary porosity corridors that channel recharge and sustain higher transmissivities [12] . However, not all lineaments correspond to open fractures; some reflect lithological contacts or dyke margins with limited hydraulic significance, and ground-truthing remains necessary before committing to drilling. A weakness of the AHP approach is its sensitivity to the assigned weights. A plus or minus 10% perturbation of the geology weight shifted 3-4% of the area between adjacent zones, suggesting moderate but not negligible sensitivity. Future refinements could incorporate machine-learning classifiers such as Random Forest or gradient boosting to derive weights empirically from borehole training data rather than expert opinion [13] .
Conclusion
This research mapped groundwater potential zones across the upper Volta Basin in Ghana by integrating seven remote-sensing and terrain-derived thematic layers through an AHP-weighted overlay. The resulting map identified 30% of the study area as having high to very-high groundwater potential, concentrated along alluvial valleys and lineament-dense sandstone corridors. Validation against 42 boreholes confirmed an 83.3% match between predicted high-potential zones and observed high-yield wells. Geology and lineament density exerted the strongest control on aquifer productivity. The map provides a practical screening tool for water agencies targeting new drilling sites in the basin. Expanding the borehole validation dataset and integrating geophysical survey data (resistivity profiling) would further improve predictive confidence. The methodology is transferable to other data-scarce crystalline basement terrains in West Africa where groundwater demand continues to grow [14,15] .
Acknowledgement
Acknowledgements Funding SourcesThis research was supported by internal funds from the Katowice Institute of Earth Sciences.
Figures and tables from the paper
| Layer | Weight | Rank | Layer | Weight | Rank |
|---|---|---|---|---|---|
| Geology | 0.263 | 1 | Rainfall | 0.109 | 5 |
| Lineament density | 0.187 | 2 | Soil type | 0.098 | 6 |
| Drainage density | 0.142 | 3 | LULC | 0.083 | 7 |
| Slope | 0.118 | 4 |
Table text extracted from the original PDF; superscript letters are shown inline. The original table image is below.
View original table image
References
15 in the original paper- MacDonald AM, Calow RC, MacDonald DMJ, Darling WG, Dochartaigh BEO. What impact will climate change have on rural groundwater supplies in Africa? *Hydrological Sciences Journal*. 2009;54(4):690-703.
- Dapaah-Siakwan S, Gyau-Boakye P. Hydrogeologic framework and borehole yields in Ghana. Hydrogeology Journal. 2000;8(4):405-416.
- Magesh NS, Chandrasekar N, Soundranayagam JP. Delineation of groundwater potential zones in Theni district, Tamil Nadu, using remote sensing, GIS and MIF techniques. Geoscience Frontiers. 2012;3(2):189196.
- Saaty TL. The Analytic Hierarchy Process. McGrawHill, New York. 1980:1-287.
- Fashae OA, Tijani MN, Talabi AO, Adedeji OI. Delineation of groundwater potential zones in the crystalline basement terrain using GIS-based multicriteria evaluation. Applied Water Science. 2014;4(1):13-28.
- Obuobie E, Diekkruger B, Agyekum W, Agodzo S. Groundwater level monitoring and recharge estimation in the White Volta River basin of Ghana. Journal of African Earth Sciences. 2012;71-72:80-86.
- Nude PM, Arhin E. Overbank sediments as appropriate geochemical sample media in regional stream sediment surveys for gold exploration in savanna regions of northern Ghana. Journal of Geochemical Exploration. 2009;103(1):50-56.
- Saaty TL. Decision making with the analytic hierarchy process. International Journal of Services Sciences. 2008;1(1):83-98.
- Abdalla F. Mapping of groundwater prospective zones using remote sensing and GIS techniques: a case of the Nile basin, Egypt. Egyptian Journal of Remote Sensing and Space Sciences. 2012;15(2):223-231.
- CWSA. Community Water and Sanitation Agency Annual Report 2021. Ministry of Sanitation and Water Resources, Ghana. 2022.
- Jenks GF. The data model concept in statistical mapping. International Yearbook of Cartography. 1967;7:186-190.
- Singhal BBS, Gupta RP. Applied Hydrogeology of Fractured Rocks. 2nd ed. Springer. 2010:1-408.
- Lee S, Hyun Y, Lee MJ. Groundwater potential mapping using data mining models of big data analysis in Goyang, South Korea. Sustainability. 2019;11(6):1678.
- Lapworth DJ, MacDonald AM, Tijani MN, Darling WG, Gooddy DC, Bonsor HC. Residence times of shallow groundwater in West Africa. Hydrogeology Journal. 2013;21(3):673-686.
- Yidana SM, Yiran GAB, Sakyi PA, Nude PM, Banoeng-Yakubo B. Groundwater evolution in the Voltaian Basin, Ghana. Journal of Earth System Science. 2011;120(4):583-593.