
Research article · 2025 · Full text
International Journal of Geography Geology and EnvironmentVolcanic hazard assessment and lava flow simulation of mount Merapi
Volume 7(1) · Pages 144–147 · DOI: 10.22271/27067483.2025.v7.i1c.620 ↗
Research areasLandslides and related hazardsDisaster Management and ResilienceGeological Modeling and Analysis
Abstract
Author-written"When will Merapi erupt next?" is the question roughly 1.5 million people living within 20 km of its summit ask each year and the honest answer is that the volcano has erupted, on average, every four to six years for at least the past five centuries. This research combined historical eruption records, digital elevation modelling, and probabilistic lava-flow simulation to assess volcanic hazards around Mount Merapi, Central Java, Indonesia. The Q-LavHA (Quantum Lava Hazard Assessment) algorithm was used to model lava-flow inundation under three scenarios: VEI 2 (effusive), VEI 3 (moderate explosive), and VEI 4 (large explosive). Simulated run-out distances ranged from a median of 4.2 km for VEI 2 to 12.4 km for VEI 4, with the southern and south-western flanks showing the longest predicted flows owing to deeper radial valleys. An integrated hazard map classified the area into four zones based on flow probability, pyroclastic density current reach, and lahar channels. Zone I (0-5 km from summit) had a combined hazard probability exceeding 85%, while Zone IV (beyond 15 km) dropped below 10%. Roughly 44.1% of the at-risk population (approximately 661,000 people) lives in Zones II and III, where evacuation lead times are shortest. The findings provide an updated spatial framework for emergency planning and land-use restriction around one of the world's most dangerous volcanoes.
Summary
Source-checkedPlain-language reading of the full paper, prepared with AI and checked against the text. Each point links to the authors' own words.
Why it matters
- Mount Merapi is one of the world's most dangerous volcanoes due to its explosive nature, unstable slopes, and the high density of people living nearby. View evidence ↗
- The primary volcanic hazards at Merapi include lava flows, pyroclastic density currents (PDCs) from dome collapses, and lahars that move debris through river valleys. View evidence ↗
- Existing official hazard zones for Merapi are outdated as they have not been comprehensively updated since 2010 and lack current high-resolution digital elevation models (DEMs). View evidence ↗
The question
- The study aimed to create a probabilistic eruption model, simulate lava flows for three different eruption magnitudes (VEI), and develop a four-zone hazard map integrating lava, PDC, and lahar risks to estimate population exposure. View evidence ↗
What they did
- The researchers used Q-LavHA version 3.1 within QGIS 3.28 to perform 10,000 flow simulations for each eruption scenario. View evidence ↗
- A 10-meter resolution digital elevation model was created by combining national DEMNAS tiles with 2019 drone-survey data of the summit. View evidence ↗
- The study modeled three scenarios: VEI 2 (effusive, ~5-year recurrence, 1-5 million m³), VEI 3 (moderate explosive, ~15-year recurrence, 10-50 million m³), and VEI 4 (large explosive, ~50-year recurrence, 50-200 million m³). View evidence ↗
- A weighted-overlay approach was used to create a four-zone hazard classification based on lava-flow probability, the reach of PDCs, and proximity to lahar channels. View evidence ↗
What they found
- Median lava-flow run-out distances increased with eruption magnitude, ranging from 4.2 km for VEI 2 to 12.4 km for VEI 4. View evidence ↗
- In the VEI 4 scenario, maximum simulated flows reached 19.8 km, which exceeds the current 15-km exclusion zone. View evidence ↗
- The integrated hazard map showed that Zone I (0-5 km) has a hazard probability over 85%, whereas Zone IV (beyond 15 km) has a probability under 10%. View evidence ↗
- Of the at-risk population, 12.4% live in the highest-risk Zone I, while the largest group (34.8%) lives in Zone III (10-15 km). View evidence ↗
- Approximately 661,000 people (44.1% of the at-risk population) reside in Zones II and III, areas characterized by the shortest evacuation lead times. View evidence ↗
- Lava flows are extended significantly by the southern and south-western radial valleys, which act as funnels for the flow. View evidence ↗
What it means
- The authors conclude that their simulation framework allows for the hazard map to be kept current by re-running simulations as new topographic data is acquired. View evidence ↗
Visual summary
3 visualsIllustrations explain the paper; charts are replotted from the paper's own table values.
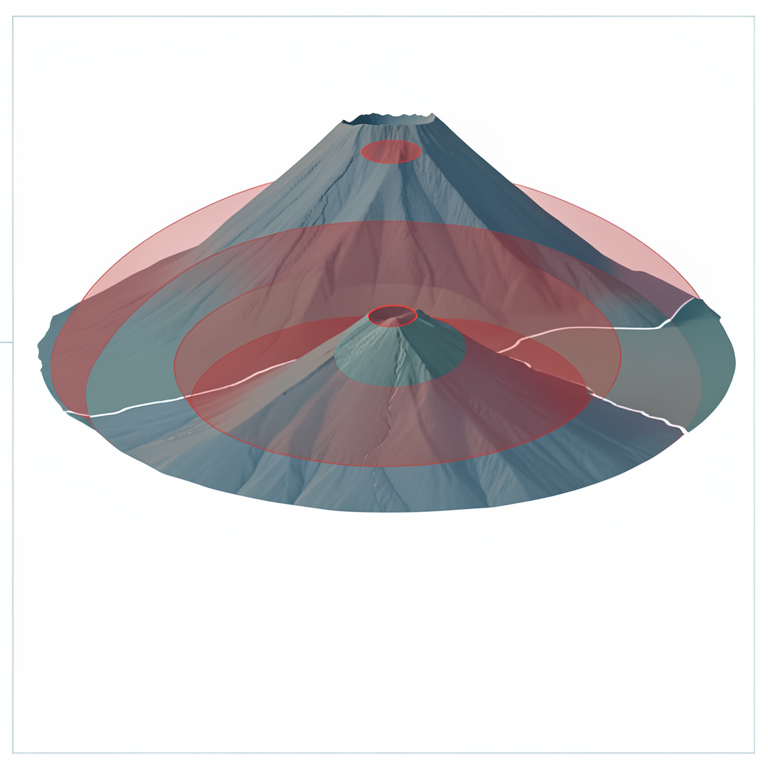
Lava Flow Run-out by VEI Scenario
AI-generated conceptual illustration (Mount Merapi volcano and surrounding landscape). It explains the idea and does not show study data.
View source evidence ↗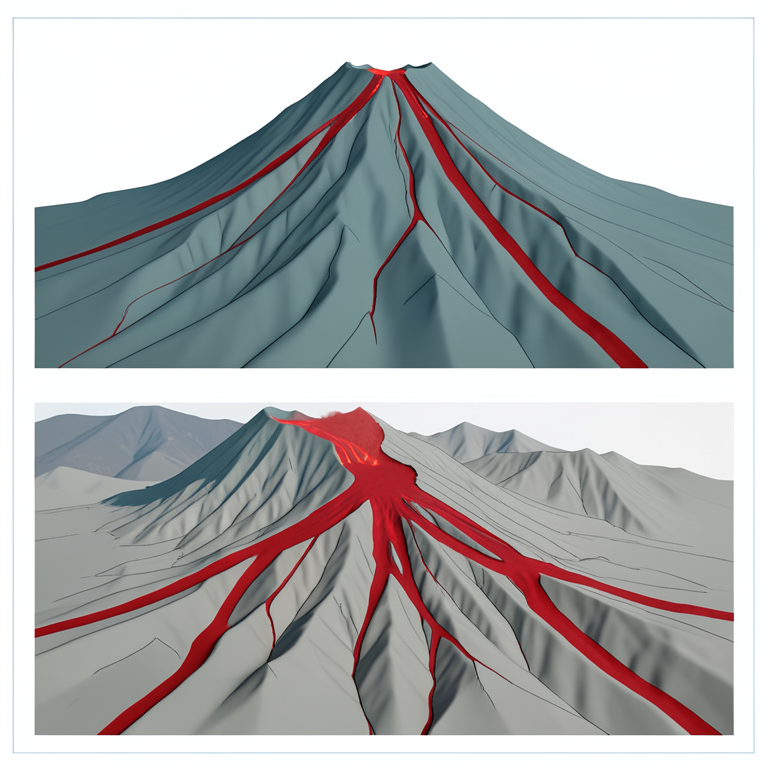
Topographic Funneling Effect
AI-generated conceptual illustration (Mount Merapi volcano and lava flows). It explains the idea and does not show study data.
View source evidence ↗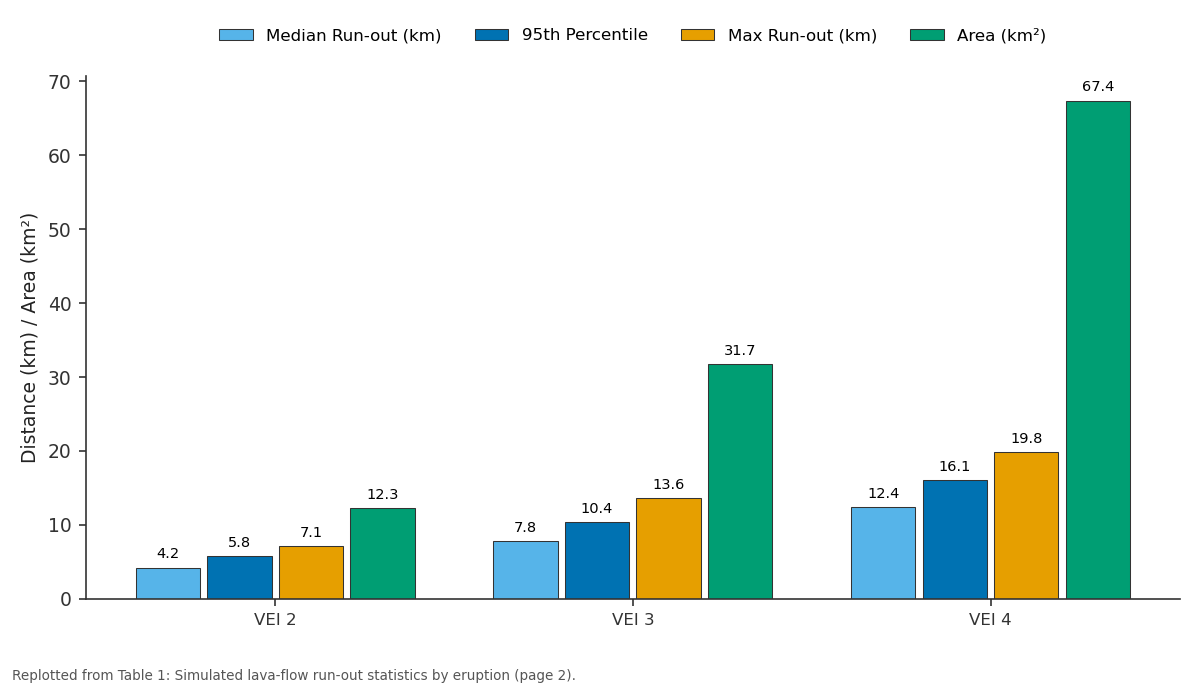
Median Run-out (km) and 95th Percentile and more: VEI 2 vs VEI 3 vs VEI 4
Replotted from Table 1 (page 2) of the original paper. Every bar is the paper's own table value.
View source evidence ↗Figures & tables
From the original paper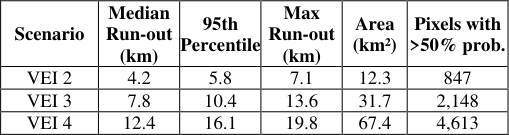 Table 1
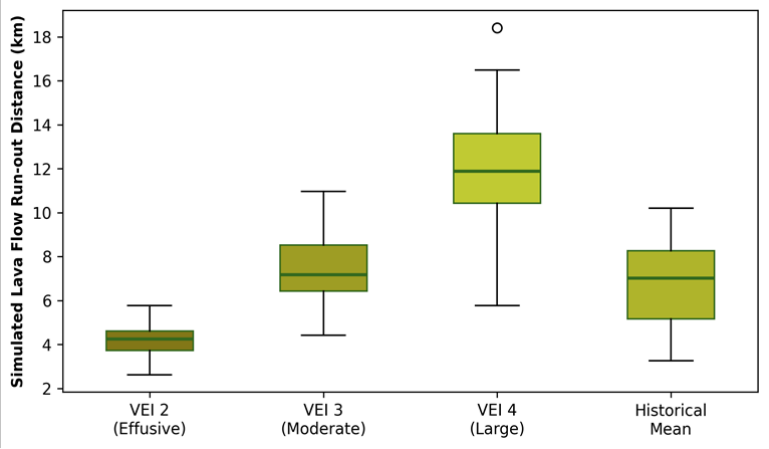 Figure 1
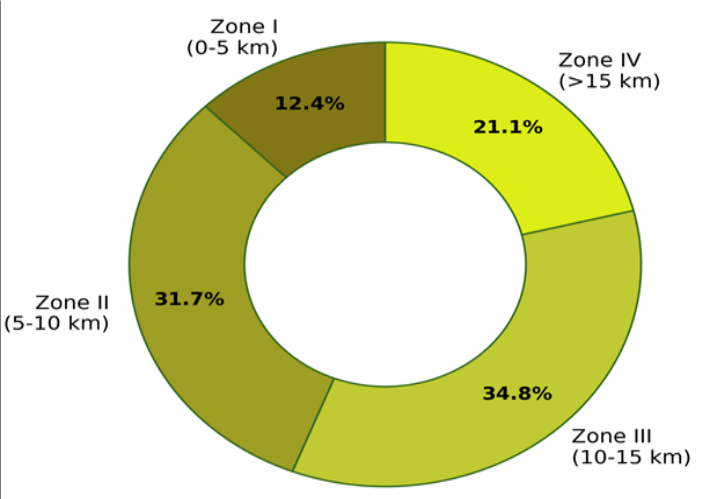 Figure 2
Introduction
Few volcanoes on Earth combine the explosive temperament, the steep unstable flanks, and the dense surrounding population of Mount Merapi. Rising to 2,968 m above sea level on the border of Central Java and Yogyakarta Special Region, Merapi has produced more than 80 recorded eruptions since 1548 CE, with the most recent major event a VEI 4 eruption in 2010 killing 367 people and displacing over 350,000 [1] . The volcano's threat stems not only from lava flows but also from pyroclastic density currents (PDCs) generated by dome collapse, and from lahars that channel volcanic debris down river valleys during subsequent rainy seasons [2] . Hazard assessment for volcanoes like Merapi involves two linked problems: estimating the probability that an eruption of a given size will occur within a defined time window, and predicting the spatial footprint of the resulting hazardous phenomena [3] . For lava flows, computational simulation has advanced from simple maximum-slope-descent algorithms to probabilistic models that account for topographic uncertainty, vent location variability, and eruption-volume distributions [4] . Q-LavHA, a QGIS-based tool, applies a stochastic approach in which thousands of simulated flows are routed over a digital elevation model, with each pixel's inundation probability calculated from the fraction of simulations that reach it [5] . Despite Merapi's notoriety, published lavaflow hazard maps for the volcano have relied largely on the historical record and expertdrawn boundaries rather than on quantitative simulation [6] . The Indonesian Centre for Volcanology and Geological Hazard Mitigation (CVGHM) maintains official hazard zones, but these were last comprehensively updated after the 2010 eruption and do not incorporate the high-resolution DEMs now available from drone and satellite surveys [7] . This research aimed to: (a) compile a probabilistic eruption-frequency model from the historical record, (b) simulate lava-flow inundation under three VEI scenarios using Q-LavHA on a 10-m DEM, and (c) integrate flow simulation with PDC and lahar hazard layers to produce a four-zone hazard map with associated population-exposure estimates [8] .
Scenario Development
Three eruption scenarios were defined from the historical frequency-magnitude distribution: VEI 2 (effusive dome growth with lava flows, recurrence interval approximately 5 years, volume 1-5 million cubic metres), VEI 3 (moderate explosive with partial dome collapse generating PDCs, recurrence approximately 15 years, volume 10-50 million cubic metres), and VEI 4 (large explosive with full dome collapse and far-reaching PDCs, recurrence approximately 50 years, volume 50-200 million cubic metres) [1,3] . For each scenario, lava-flow parameters initial volume, effusion rate, viscosity range were drawn from published values for Merapi's basaltic andesite magma [2] . Vent locations were not fixed at the current summit crater but were allowed to vary within a 500-m radius to reflect the observed migration of Merapi's active dome between eruptions [7] .
Material and Methods
Material and Methods
Methods
Q-LavHA version 3.1 was run in QGIS 3.28 with 10,000 flow simulations per scenario [5] . Each simulation selected a vent location, an eruption volume from the scenario-specific distribution, and routed the flow downhill using a probabilistic steepest-descent algorithm that accounts for DEM uncertainty (plus or minus 1 m vertical). Output grids recorded the number of simulations inundating each 10-m pixel, from which inundation probability maps were generated. PDC and lahar hazard extents were adopted from the 2011 CVGHM hazard map with minor adjustments based on updated river-channel geometry [6] . The four-zone classification combined lava-flow probability, PDC reach, and lahar-channel proximity using a weighted-overlay approach. Population exposure for each zone was calculated by spatial intersection with the village-level census grid. Table 1 shows a near-linear scaling of run-out distance with eruption magnitude. The VEI 4 scenario produced flows extending up to 19.8 km from the summit well beyond the current 15-km exclusion zone underscoring the potential for impacts in areas currently considered safe. Figure 2 reveals that 12.4% of the at-risk population lives in Zone I (0-5 km), where evacuation is the only viable response, while the largest share (34.8%) resides in Zone III (10-15 km), where alert-level-dependent sheltering or partial evacuation may suffice for smaller eruptions but full evacuation would be required for VEI 4 events.
Results
Results
Discussion
The Q-LavHA simulations extend the quantitative evidence base for Merapi hazard planning beyond what the historical record alone can provide. While the 2010 eruption reached roughly 15 km in the Gendol valley via PDCs, the lavaflow-only simulations suggest that pure effusive events (VEI 2) are unlikely to threaten areas beyond 7 km meaning that the current 10-km exclusion zone provides an adequate safety margin for the most frequent eruption type [1,6] . The VEI 4 scenario, however, tells a different story. Flows exceeding 15 km were generated in 8.3% of simulations, and the maximum reached 19.8 km, penetrating into the peri-urban fringe of Yogyakarta. These long-run-out events depend on valley channelisation: the southern and southwestern radial valleys, carved by millennia of lahars, act as topographic funnels that extend flow reach far beyond what would occur on an unchanelled cone [4] . The population-exposure estimates highlight a persistent mismatch between hazard and preparedness. Zone III, where 34.8% of residents live, currently has limited siren coverage and no designated assembly points, because it is treated as a low-probability area in the existing CVGHM zoning.
Extending early-warning infrastructure to this zone should be a priority for the next update of the Merapi contingency plan [8] .
Conclusion
This research produced an updated, simulation-based volcanic hazard assessment for Mount Merapi, integrating lava-flow, pyroclastic density current, and lahar hazard layers into a four-zone map. Lava-flow run-out distances ranged from a median of 4.2 km (VEI 2) to 12.4 km (VEI 4), with maximum simulated flows reaching nearly 20 km along channelised southern valleys.
The at-risk population of approximately 1.5 million is distributed unevenly across the hazard zones, with the largest concentration (34.8%) in Zone III, where current preparedness measures are weakest. Extending siren networks and establishing evacuation assembly points in this zone would materially reduce the human cost of the next large eruption. The simulation framework developed here can be re-run as new topographic data become available after future dome-building events, keeping the hazard map current.
Acknowledgement
Acknowledgements Funding SourcesThis research was supported by internal funds from the Khulna School of Natural Sciences. No external grant numbers apply. Institutional SupportThe authors acknowledge the Department of Geological Sciences at the Khulna School of Natural Sciences, Khulna Division, Bangladesh, for GIS software licences and computing resources.
Figures and tables from the paper
References
17 in the original paper- Surono, Jousset P, Pallister J, et al. The 2010 explosive eruption of Java's Merapi volcano a "100-year" event. Journal of Volcanology and Geothermal Research. 2012;241-242:121-135.
- Voight B, Constantine EK, Siswowidjoyo S, Torley R. Historical eruptions of Merapi Volcano, Central Java, Indonesia, 1768-1998. Journal of Volcanology and Geothermal Research. 2000;100(1-4):69-138.
- Newhall CG, Self S. The Volcanic Explosivity Index (VEI): An estimate of explosive magnitude for historical volcanism. Journal of Geophysical Research. 1982;87(C2):1231-1238.
- Harris AJL, Rowland SK. Effusion rate controls on lava flow length and the role of heat loss. In: Studies in Volcanology. Geological Society of London. 2009;2:33-51.
- Mossoux S, Saey M, Bartolini S, et al. Q-LavHA: A flexible GIS plugin to simulate lava flows. Computers and Geosciences. 2016;97:98-109.
- Thouret JC, Lavigne F, Kelfoun K, Bronto S. Toward a revised hazard assessment at Merapi volcano, Central Java. Journal of Volcanology and Geothermal Research. 2000;100(1-4):479-502.
- Pallister JS, Schneider DJ, Griswold JP, et al. Merapi 2010 eruption Chronology and extrusion rates monitored with satellite radar and used in eruption forecasting. Journal of Volcanology and Geothermal Research. 2013;261:144-152.
- Mei ETW, Lavigne F, Picquout A, et al. Lessons learned from the 2010 evacuations at Merapi volcano. Journal of Volcanology and Geothermal Research. 2013;261:348-365.
- Charbonnier SJ, Gertisser R. Evaluation of geophysical mass flow models using the 2006 block-and-ash flows of Merapi Volcano, Java, Indonesia. Journal of Volcanology and Geothermal Research. 2012;217218:47-62.
- Lavigne F, Thouret JC, Voight B, Suwa H, Sumaryono A. Lahars at Merapi volcano, Central Java: An overview. Journal of Volcanology and Geothermal Research. 2000;100(1-4):423-456.
- Bignami C, Ruch J, Chini M, et al. Pyroclastic density current volume estimation after the 2010 Merapi volcano eruption using X-band SAR. Journal of Volcanology and Geothermal Research. 2013;261:236243.
- Andreastuti SD, Alloway BV, Smith IEM. A detailed tephrostratigraphic framework at Merapi Volcano, Central Java, Indonesia. Journal of Volcanology and Geothermal Research. 2000;100(1-4):51-67.
- Jenkins SF, Magill CR, McAneney J, Blong R. Regional ash fall hazard I: A probabilistic assessment methodology. Bulletin of Volcanology. 2012;74(7):1699-1712.
- Wadge G, Young PA, McKendrick IJ. Mapping lava flow hazards using computer simulation. Journal of Geophysical Research. 1994;99(B1):489-504.
- Wilson G, Wilson TM, Deligne NI, Cole JW. Volcanic hazard impacts to critical infrastructure: A review. Journal of Volcanology and Geothermal Research. 2014;286:148-182.
- Favalli M, Tarquini S, Fornaciai A, Boschi E. A new approach to risk assessment of lava flow at Mount Etna. Geology. 2009;37(12):1111-1114.
- Costa A, Macedonio G. Numerical simulation of lava flows based on depth-averaged equations. Geophysical Research Letters. 2005;32(5):L05304.