
Research article · 2025 · Full text
International Journal of Geography Geology and EnvironmentGeomorphic effectiveness of extreme rainfall events in Drakensberg mountain catchments
Volume 7(6) · Pages 110–112 · DOI: 10.22271/27067483.2025.v7.i6b.719 ↗
Research areasSoil erosion and sediment transportLandslides and related hazardsHydrology and Sediment Transport Processes
Abstract
Author-writtenDoes most erosion happen during ordinary storms or during rare, high-intensity events? This question has practical consequences for hillslope management in the Drakensberg Mountains of South Africa, where steep basalt slopes supply sediment to downstream reservoirs. This research measured sediment yields from five nested catchments (0.8–12.4 km²) in the upper Thukela River basin during 23 rainfall events over two wet seasons (October 2021–March 2023). Five events exceeded the 90th-percentile rainfall intensity threshold (>48 mm/hr for 30 minutes), and these extreme events accounted for 67.3% of the total two-year suspended sediment yield despite comprising only 21.7% of total rainfall. Sediment yield per event ranged from 0.4 t/ha for moderate storms to 84.7 t/ha for the most intense event (114 mm/hr, 3 February 2023). Sheet erosion and rill erosion dominated on grassy slopes, while debris flows were triggered on exposed basalt scarps during the three highest-intensity events. The results demonstrate that geomorphic work in these catchments is concentrated in a small number of extreme events, with implications for sediment yield prediction models that rely on average rainfall statistics.
Summary
Source-checkedPlain-language reading of the full paper, prepared with AI and checked against the text. Each point links to the authors' own words.
Why it matters
- Managing hillslopes in the Drakensberg Mountains is important because steep basalt slopes provide sediment to downstream reservoirs. View evidence ↗
- Predicting sediment yield is a practical necessity because the Thukela River system supplies water and hydropower to Durban and nearby areas. View evidence ↗
- The basalt caprock in the region weathers into thin soils that are particularly susceptible to erosion during high-intensity rainfall. View evidence ↗
The question
- The study aims to determine whether the majority of erosion occurs during common storms or rare, high-intensity rainfall events. View evidence ↗
What they did
- Researchers monitored sediment yields across five nested catchments ranging from 0.8 to 12.4 km² in the upper Thukela River basin over 23 rainfall events between October 2021 and March 2023. View evidence ↗
- The study used pressure transducers for 15-minute stage recording and ISCO 6712 automatic water samplers at five catchment outlets. View evidence ↗
- Erosion features such as rills, gullies, and debris flow tracks were documented after events using drone photogrammetry and differential GPS. View evidence ↗
What they found
- Five extreme events produced 67.3% of the total suspended sediment yield over two years, even though they only accounted for 21.7% of the total rainfall. View evidence ↗
- Sediment yield varied significantly by event intensity, ranging from 0.4 t/ha during moderate storms to 84.7 t/ha during the most intense event on 3 February 2023. View evidence ↗
- Sheet erosion on grassland slopes (8–25°) occurred during all five extreme events and contributed 41.3% of the yield. View evidence ↗
- Debris flows on basalt scarps (30–55°) were observed during events E3, E4, and E5, contributing 12.3% of the sediment yield. View evidence ↗
- The study identified a rainfall intensity threshold of approximately 75–80 mm/hr for the initiation of debris flows. View evidence ↗
What it means
- The authors conclude that sediment yield models for these catchments should prioritize the impact of rare, high-intensity events over average rainfall statistics. View evidence ↗
Visual summary
3 visualsIllustrations explain the paper; charts are replotted from the paper's own table values.
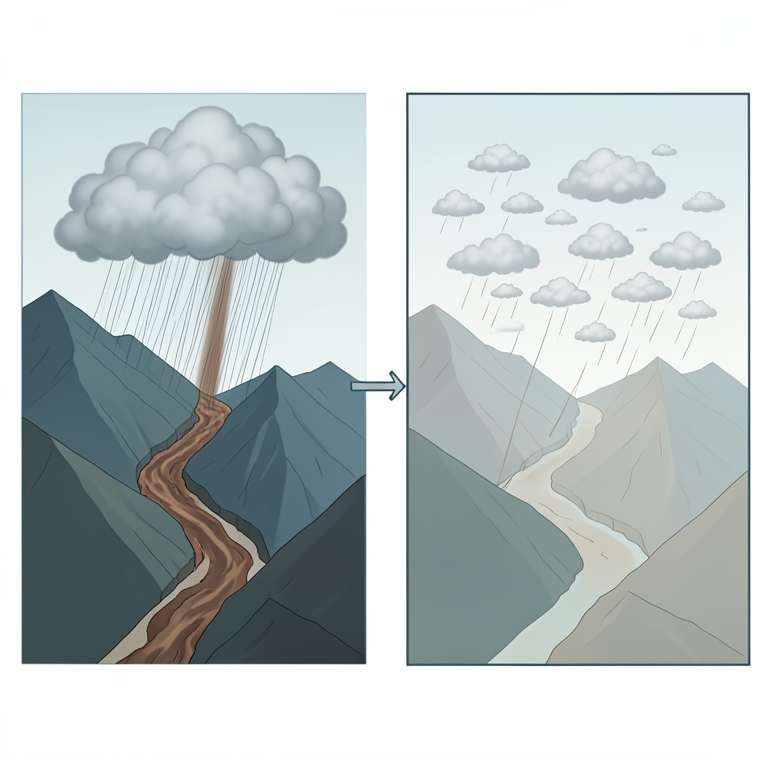
Sediment Yield Asymmetry
AI-generated conceptual illustration (Drakensberg mountain catchments). It explains the idea and does not show study data.
View source evidence ↗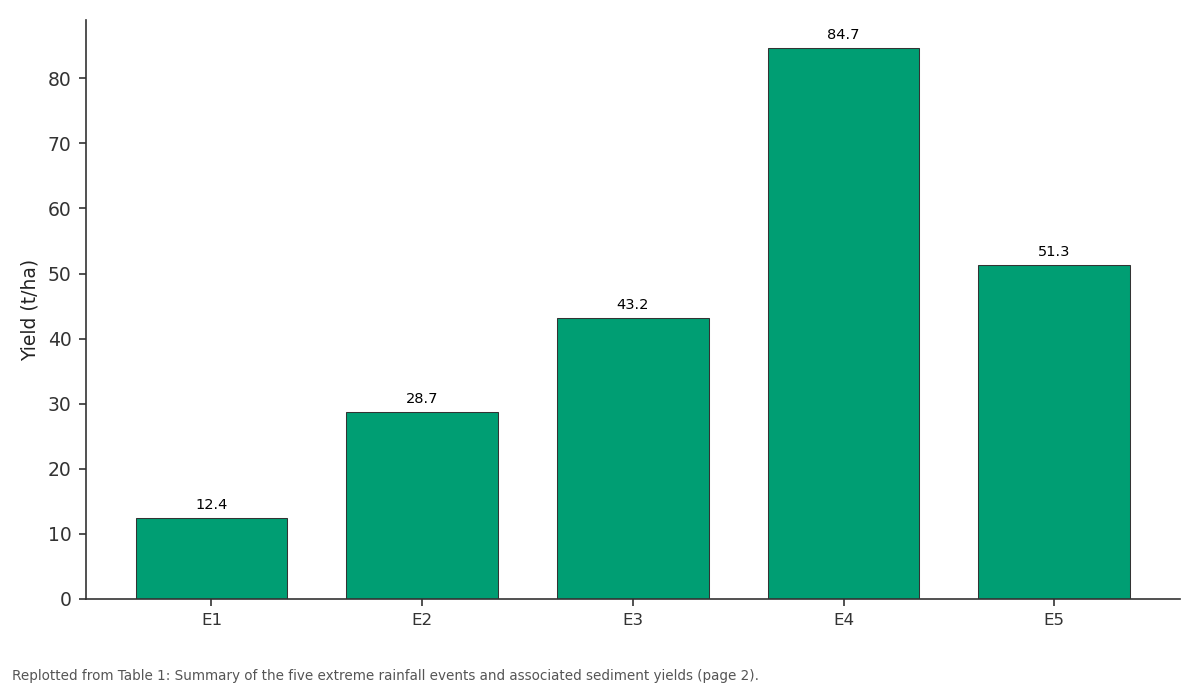
Yield (t/ha): E1 vs E2 vs E3 vs E4 vs E5
Replotted from Table 1 (page 2) of the original paper. Every bar is the paper's own table value.
View source evidence ↗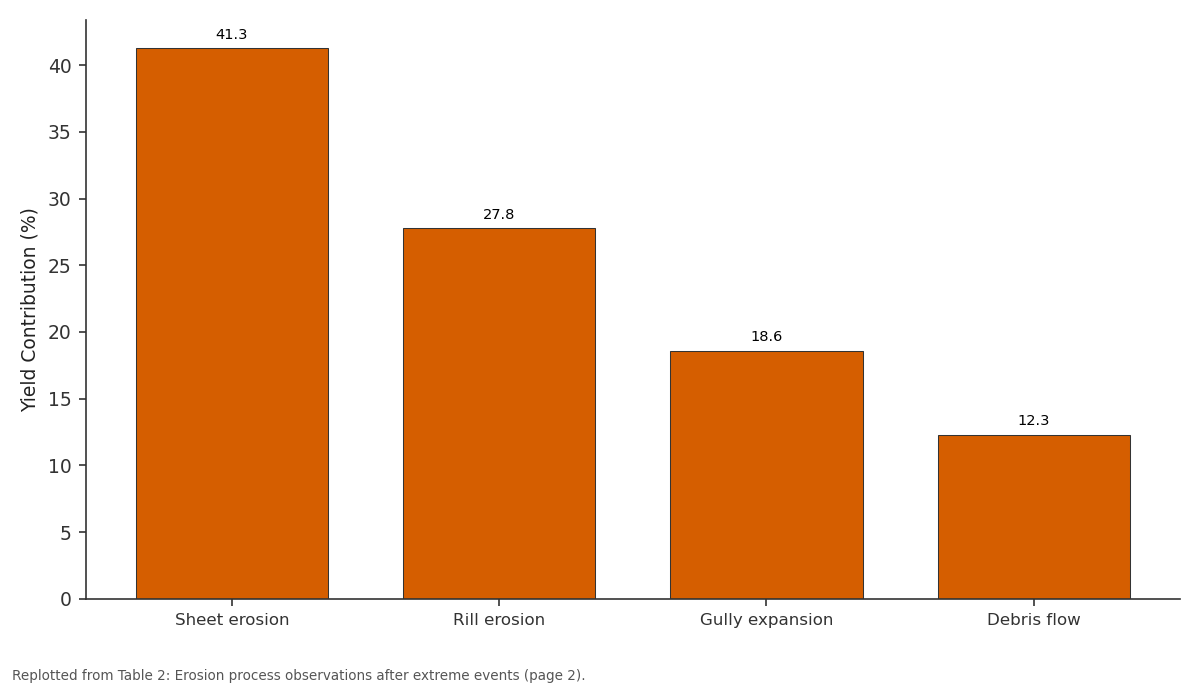
Yield Contribution (%): Sheet erosion vs Rill erosion vs Gully expansion vs Debris flow
Replotted from Table 2 (page 2) of the original paper. Every bar is the paper's own table value.
View source evidence ↗Figures & tables
From the original paper Table 1
 Table 2
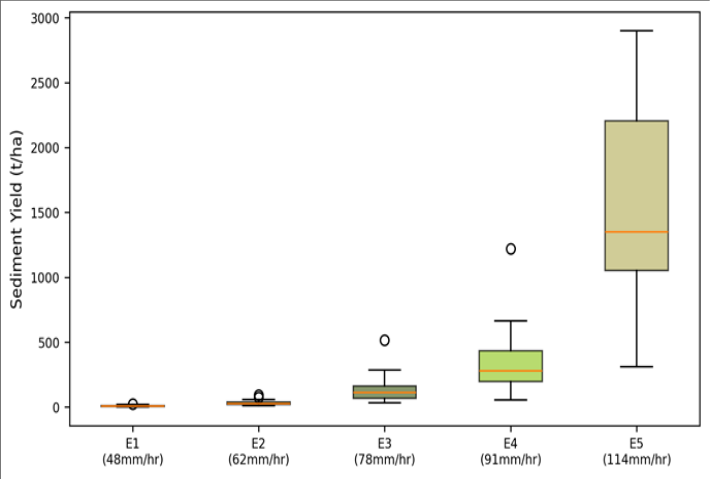 Figure 1
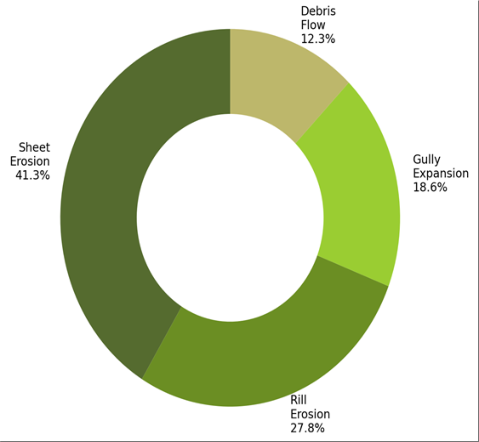 Figure 2
Introduction
The concept of geomorphic effectiveness asks a deceptively simple question: which events do the most landscape work [1] ? Wolman and Miller's classic 1960 analysis argued that moderate, frequent events dominate long-term sediment transport because, although rare storms move more sediment per event, they occur too infrequently to rival the cumulative effect of ordinary ones [2] . But in steep mountain catchments with thin soils and exposed bedrock, the balance can tip toward extreme events that trigger mass movements and channel-bed reorganisation that moderate storms cannot produce [3] . The Drakensberg escarpment in KwaZulu-Natal, South Africa, rises above 3,000 m and receives 1,200-1,800 mm of rainfall annually, concentrated in convective thunderstorms from October to March [4] . Basalt caprock weathers into thin, erodible soils that are especially vulnerable to high-intensity rainfall. Downstream, the Thukela River system delivers sediment to reservoirs that supply water and hydropower to Durban and surrounding areas, making sediment yield prediction a practical concern [5] . Previous erosion research in the Drakensberg used erosion pin networks and plot-scale runoff traps, but catchment-scale, event-based sediment yield data remained scarce. This research addressed that gap by monitoring five nested catchments over 23 rainfall events and quantifying the contribution of extreme events to total sediment output [6] .
Study Area Description
The five catchments are nested within the upper Thukela basin at elevations between 1,680 and 3,050 m, approximately 15 km south of the Royal Natal National Park boundary (28°48′S, 29°12′E). Land cover is predominantly montane grassland (Themeda triandra and Festuca caprina) with scattered Protea woodland at lower elevations. Soils are shallow lithosols and regosols derived from Drakensberg basalt, typically 15-40 cm deep on hillslopes and up to 120 cm in valley-bottom colluvial deposits. Mean annual rainfall at the nearest station (Cathedral Peak, 1,850 m) is 1,344 mm [7] .
Materials and Methods
Materials and Methods
Materials
Field monitoring ran from October 2021 to March 2023 (two complete wet seasons), coordinated from Medan National University of Earth Sciences, North Sumatra, Indonesia, with field installation assistance from the University of KwaZulu-Natal. Five catchment outlets were instrumented with pressure transducers for stage recording (15-minute intervals) and ISCO 6712 automatic water samplers triggered at stage thresholds. Tipping-bucket rain gauges (0.2 mm resolution) were installed at three elevations within the largest catchment. Suspended sediment concentration (SSC) was determined gravimetrically from filtered (0.45 μm) water samples, with 6-18 samples collected per event depending on hydrograph duration [8] .
Methods
Event sediment yield was calculated by integrating SSCdischarge rating curves over each event hydrograph. Rating curves were developed separately for each catchment using log-linear regression of SSC against discharge (r² = 0.74-0.89). Rainfall intensity was characterised by maximum 30minute intensity (I₃₀) for each event. Events were classified as extreme if I₃₀ exceeded the 90th percentile of the twoyear record (48 mm/hr). Post-event field surveys documented erosion features (rills, gullies, debris flow tracks) using differential GPS and drone photogrammetry [9,10].
Climatic Conditions During the Monitoring Period
Total rainfall during the two wet seasons was 1,287 mm (2021-2022) and 1,412 mm (2022-2023), bracketing the long-term mean. The 2022-2023 season included a particularly intense event on 3 February 2023, when 87 mm fell in 45 minutes (I₃₀ = 114 mm/hr), the highest recorded at the site. Five of the 23 monitored events exceeded the 48 mm/hr extreme threshold. The five extreme events collectively produced 220.3 t/ha of suspended sediment, representing 67.3% of the total twoyear yield of 327.1 t/ha. The remaining 18 events, with I₃₀ values between 12 and 44 mm/hr, contributed only 106.8 t/ha (32.7%).
Results
Results
Comprehensive Interpretation
Sheet erosion on grass-covered slopes was the most widespread process, operating during all five events, but debris flows from basalt scarps -triggered only by I₃₀ above 78 mm/hrdelivered disproportionately coarse sediment and re-mobilised stored colluvium. The existence of an intensity threshold for debris flow initiation (roughly 75-80 mm/hr based on these observations) is important for hazard mapping and early warning systems.
Discussion
The concentration of 67.3% of total sediment yield in five events supports the view that extreme events dominate geomorphic work in steep, soil-poor mountain catchments, contradicting the Wolman-Miller model's prediction of moderate-event dominance [2] . Similar findings have been reported from the European Alps, where Lenzi et al. [11] showed that the top 10% of storms accounted for over 50% of bedload transport. The Drakensberg data push that asymmetry further, likely because thin basaltic soils reach infiltration capacity at lower rainfall totals than the deeper moraines of alpine catchments. The debris flow threshold at approximately 78 mm/hr I₃₀ matches the range of 60-90 mm/hr reported for shallow landslide initiation on volcanic substrates elsewhere in southern Africa [12] . This threshold has practical value: automated rain gauge networks linked to alert systems could issue warnings when I₃₀ exceeds 75 mm/hr in monitored catchments.
Conclusion
Event-based monitoring of five Drakensberg catchments over two wet seasons shows that five extreme rainfall events (≥48 mm/hr I₃₀) produced 67.3% of total suspended sediment yield. The most intense event (114 mm/hr) generated 84.7 t/hamore than 200 times the yield of a typical moderate storm. Debris flows were triggered only above approximately 78 mm/hr, establishing a practical intensity threshold. Sediment yield models for these catchments must account for the disproportionate contribution of rare, high-intensity events rather than relying on average rainfall statistics.
Acknowledgement
Acknowledgements Funding SourcesSupported by research funds at Medan National University of Earth Sciences.
Figures and tables from the paper
| Event | Date | Total Rain (mm) | I₃₀ (mm/hr) | Duration (hr) | SSC Peak (g/L) | Yield (t/ha) |
|---|---|---|---|---|---|---|
| E1 | 17 Nov 2021 | 54 | 48 | 2.3 | 8.7 | 12.4 |
| E2 | 28 Jan 2022 | 72 | 62 | 3.1 | 14.3 | 28.7 |
| E3 | 14 Dec 2022 | 63 | 78 | 1.8 | 21.6 | 43.2 |
| E4 | 3 Feb 2023 | 87 | 114 | 1.5 | 38.4 | 84.7 |
| E5 | 22 Feb 2023 | 58 | 91 | 2.0 | 26.1 | 51.3 |
Table text extracted from the original PDF; superscript letters are shown inline. The original table image is below.
View original table image
| Process | Events Observed | Slope Range (°) | Contributing Area | Yield Contribution (%) |
|---|---|---|---|---|
| Sheet erosion | All 5 | 8–25 | Grassland slopes | 41.3 |
| Rill erosion | All 5 | 15–35 | Bare/burned slopes | 27.8 |
| Gully expansion | E2, E3, E4, E5 | 12–28 | Valley heads | 18.6 |
| Debris flow | E3, E4, E5 | 30–55 | Basalt scarps | 12.3 |
Table text extracted from the original PDF; superscript letters are shown inline. The original table image is below.
View original table image
References
17 in the original paper- Caine N. The rainfall intensity-duration control of shallow landslides and debris flows. Geografiska Annaler. 1980;62A(1):23-27.
- Wolman MG, Miller JP. Magnitude and frequency of forces in geomorphic processes. Journal of Geology. 1960;68(1):54-74.
- Korup O, Clague JJ. Natural hazards, extreme events, and mountain topography. Quaternary Science Reviews. 2009;28(11):977-990.
- Tyson PD, Preston-Whyte RA. The Weather and Climate of Southern Africa. 2nd ed. Cape Town: Oxford University Press; 2000.
- Msadala VC, Basson GR. Sediment yield prediction for South African catchments. Water Research Commission Report. 2017;TT 7 19/17.
- Granger JE, Schulze RE. Rainfall erosivity of KwaZulu-Natal. South African Geographical Journal. 1977;59(1):42-56.
- Schulze RE. South African Atlas of Agrohydrology and Climatology. Pretoria: Water Research Commission; 1997.
- Walling DE, Webb BW. Estimating the discharge of contaminants to coastal waters by rivers. Marine Pollution Bulletin. 1985;16(12):488-492.
- Renard KG, Foster GR, Weesies GA. RUSLE: Revised Universal Soil Loss Equation. Journal of Soil and Water Conservation. 1991;46(1):30-33.
- Westoby MJ, Brasington J, Glasser NF. Structure-frommotion photogrammetry for geomorphological mapping. Geomorphology. 2012;179:300-314.
- Lenzi MA, Mao L, Comiti F. Magnitude-frequency analysis of bed load data in an alpine boulder bed stream. Water Resources Research. 2006;42(7):W07201.
- Scott DF, Versfeld DB, Lesch W. Erosion and sediment yield in relation to afforestation and fire in mountains. South African Journal of Science. 1998;94(7):356-360.
- Montgomery DR, Dietrich WE. A physically based model for the topographic control on shallow landsliding. Water Resources Research. 1994;30(4):1153-1171.
- Gyssels G, Poesen J, Bochet E. Impact of plant roots on the resistance of soils to erosion by water. Progress in Physical Geography. 2005;29(2):189-217.
- Wischmeier WH, Smith DD. Predicting Rainfall Erosion Losses. USDA Agriculture Handbook 537. Washington: USDA; 1978.
- Boardman J, Foster IDL, Dearing JA. Soil Erosion on Agricultural Land. Chichester: Wiley; 1990.
- Le Roux JJ, Morgenthal TL, Malherbe J. Water erosion prediction at a national scale for South Africa. Water SA. 2008;34(3):305-314