
Research article · 2026 · Full text
International Journal of Geography Geology and EnvironmentA perception survey of plastic waste management practices in Girdharpur Village, Uttar Pradesh, India
Volume 8(5) · Pages 07–16 · DOI: 10.22271/27067483.2026.v8.i5a.747 ↗
Research areasWaste Management and RecyclingMunicipal Solid Waste ManagementMicroplastics and Plastic Pollution
Abstract
Author-writtenThe present study aimed to provide a detailed empirical assessment of plastic waste management practices in Girdharpur village of Gautam Buddha Nagar district, Uttar Pradesh, India, with the following objectives in mind: (a) to examine the plastic items used for consumption, (b) to identify the current plastic waste disposal methods, and (c) to assess the villagers’ willingness to participate in plastic waste separation and collection systems. A mixed-methods approach was adopted to capture villagers’ perceptions of plastic waste through structured surveys and semi-structured interviews. The information was gathered from 85 randomly selected households and supplemented with ten key informants, field observations, and secondary data reviews. Results revealed that single-use plastics constitute 63% of the primary sources of pollution in the area. Although 45% of households use reusable bags and containers, 16% avoid products with excessive plastic packaging, and 47% recycle plastic items, efforts are limited by insufficient technical knowledge, infrastructure, awareness, high cost, and seasonal constraints. About half of the respondents (55%) were not willing to pay more for products with eco-friendly packaging. Further, 69% of the respondents reported the use of biodegradable plastics as a viable solution; however, majority of the population (87%) thinks that local governments should enforce strict regulations on plastic waste management. The study concludes that inclusion and technical training of rural communities in future plastic pollution and circular economy research can assist policymakers in reducing environmental and public health threats.
Summary
Source-checkedPlain-language reading of the full paper, prepared with AI and checked against the text. Each point links to the authors' own words.
Why it matters
- Plastic waste is a global threat to public health and the environment, especially in rural regions where waste management is hindered by poor infrastructure and low awareness. View evidence ↗
- In rural areas like Girdharpur, the lack of formal collection systems leads to waste being dumped in plots, roadsides, and water, which increases health risks and attracts diseases. View evidence ↗
- The availability of cheap plastic packaging in rural communities contributes to soil contamination and negatively impacts tourism and agriculture. View evidence ↗
The question
- The study aimed to assess plastic waste management in Girdharpur village by examining consumed plastic items, current disposal methods, and the community's willingness to participate in collection and separation systems. View evidence ↗
What they did
- Researchers used a hybrid sampling strategy to select 85 participants, including local households and stakeholders. View evidence ↗
- The research employed a mixed-methods approach, gathering data through structured surveys, semi-structured interviews, field observations, and reviews of secondary data. View evidence ↗
- The study took place in November 2025 in Girdharpur, a village chosen because it lacks waste management infrastructure and relies on open dumping. View evidence ↗
What they found
- Single-use plastics (63%) were the primary source of pollution, followed by packaging materials (20%), industrial waste (12%), and microplastics (3%). View evidence ↗
- To reduce waste, 60% of residents used reusable bags and containers, 47% recycled plastic items, and 16% avoided excessive plastic packaging. View evidence ↗
- Over half of the respondents (55%) were unwilling to pay a higher price for products that use eco-friendly packaging. View evidence ↗
- The vast majority of respondents (88%) believe the government is responsible for addressing plastic waste, compared to corporations (9%), consumers (2%), and NGOs (1%). View evidence ↗
- Awareness of local recycling facilities was very low, with 88% of respondents unaware of any available facilities. View evidence ↗
- The primary barrier to effective recycling was inconvenience (63.93%), followed by lack of facilities (13.93%), lack of awareness (12.29%), and high cost (9.83%). View evidence ↗
- While there was a willingness to participate in waste collection, 85% of respondents would only do so if incentives were provided. View evidence ↗
What it means
- The authors conclude that while environmental awareness is high, it does not translate into sustainable practices due to poor infrastructure, lack of institutional support, and insufficient knowledge of recycling. View evidence ↗
- The authors state that technical solutions must be paired with community engagement, inclusive policies, and behavioral change studies to be effective. View evidence ↗
- The authors suggest that future research should analyze the actual composition, amount, and type of plastic waste discarded in villages. View evidence ↗
Visual summary
1 visualsIllustrations explain the paper; they do not show study data.
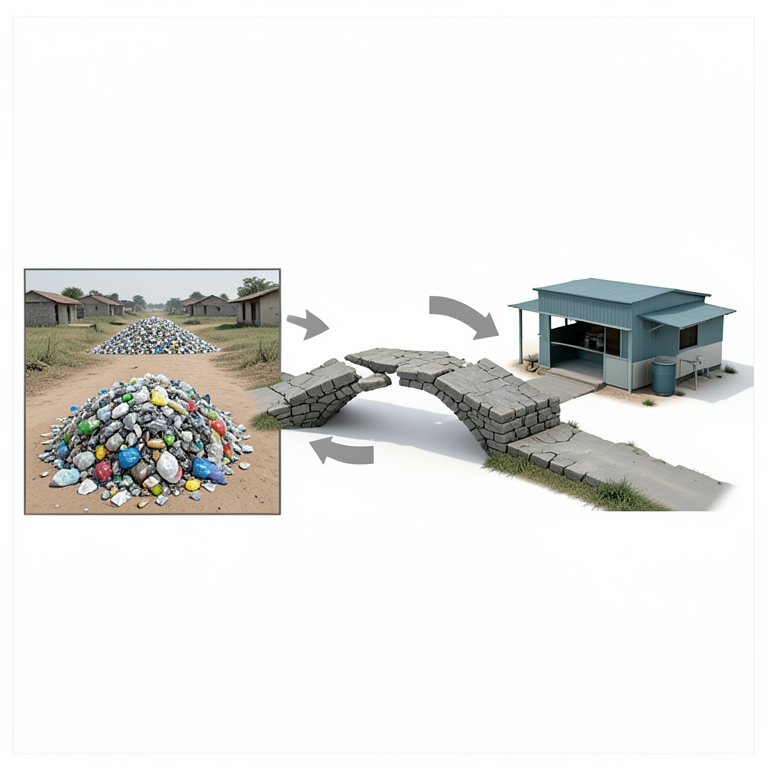
The Awareness-Action Gap
AI-generated conceptual illustration (Plastic waste management in a rural Indian village setting). It explains the idea and does not show study data.
View source evidence ↗Figures & tables
From the original paper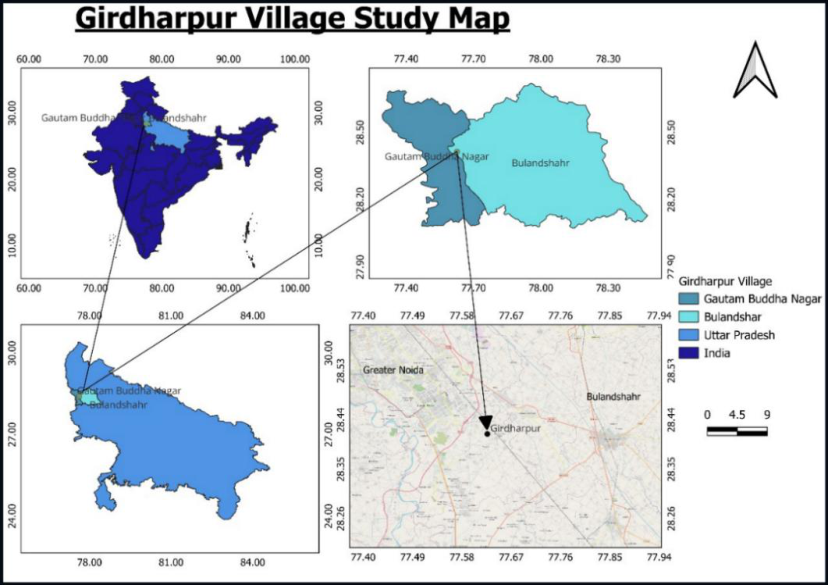 Figure 1
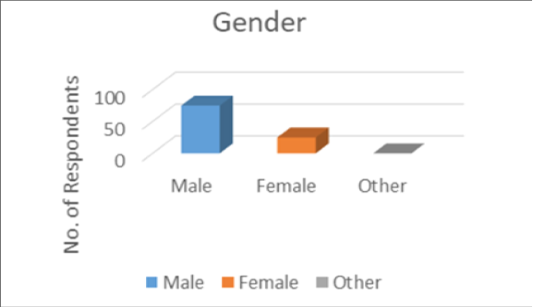 Figure 2
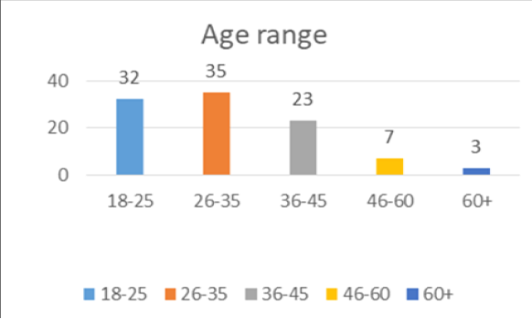 Figure 3
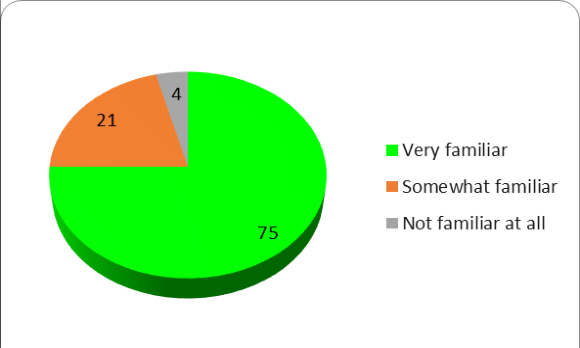 Figure 4
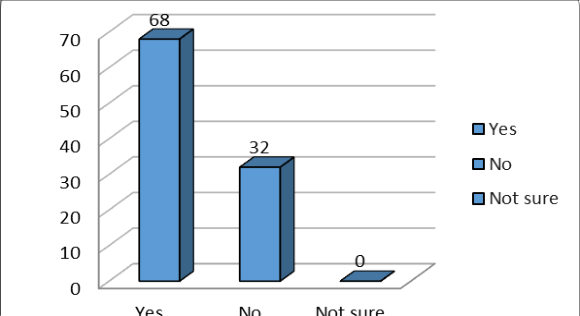 Figure 5
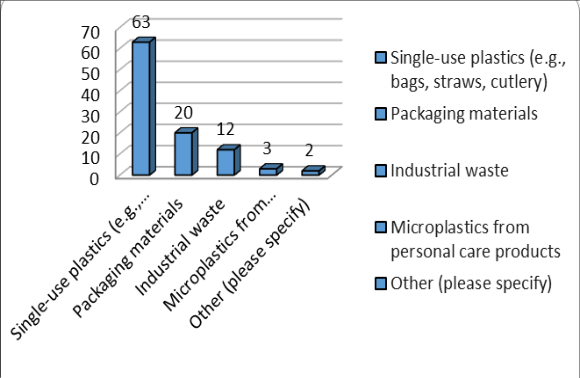 Figure 6
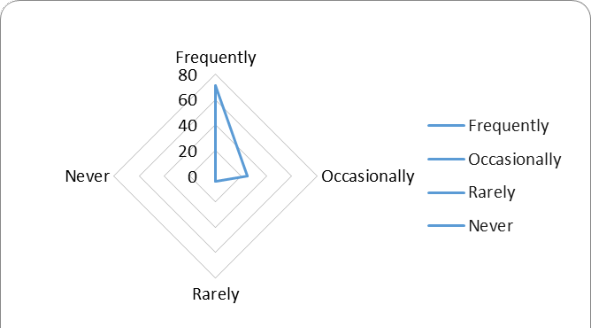 Figure 7
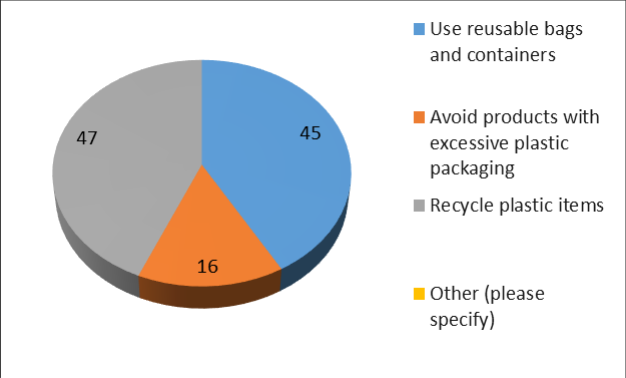 Figure 8
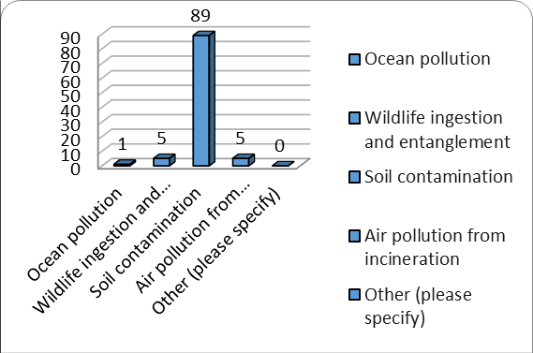 Figure 9
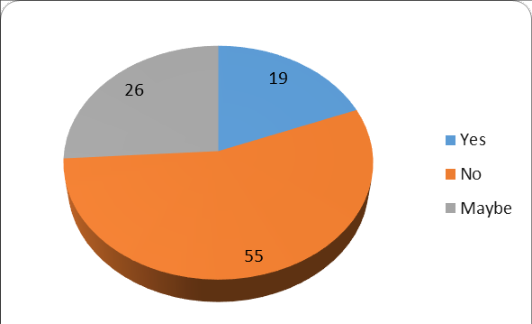 Figure 10
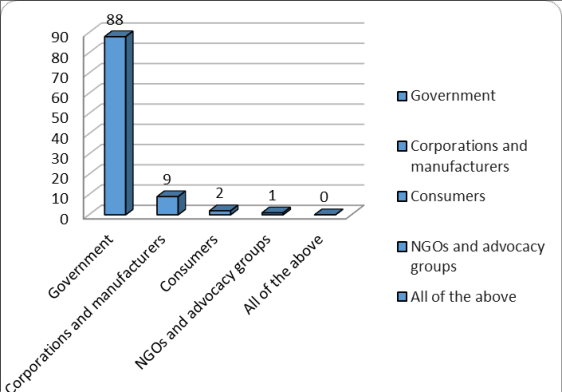 Figure 11
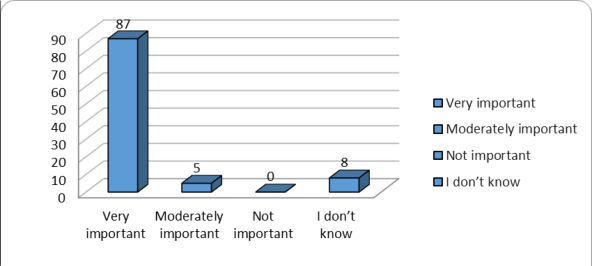 Figure 12
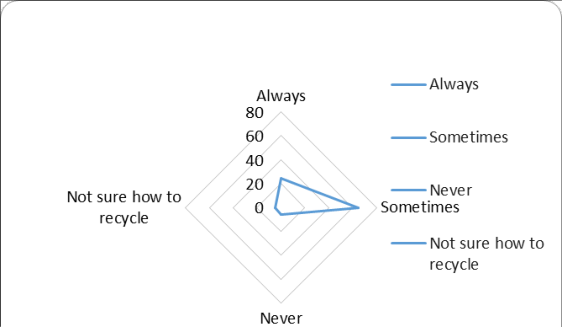 Figure 13
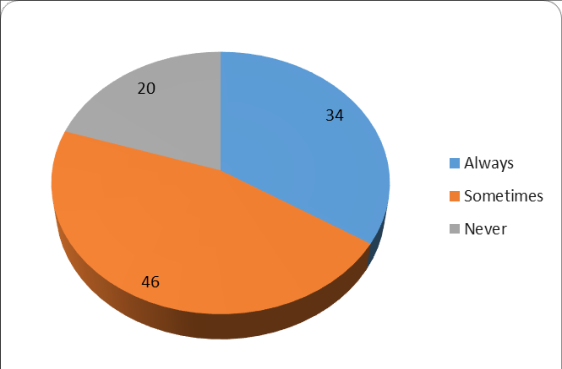 Figure 14
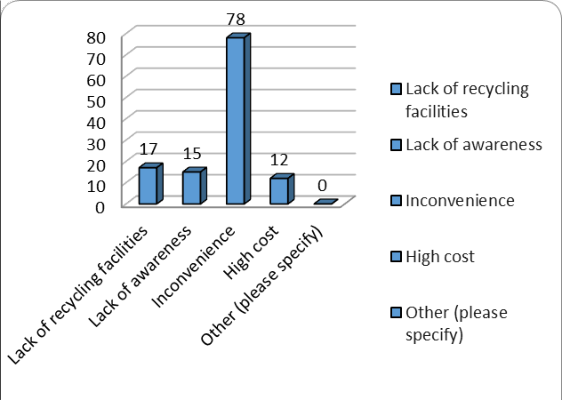 Figure 15
Introduction
Plastic waste represents a global environmental and public health concern, particularly in rural areas, where effective waste handling is limited by inadequate infrastructure, institutional inefficiencies, and minimal levels of environmental awareness. The volume and complexity of plastic waste generated has remarkably increased over the years as a result of rapid urbanization, overpopulation, and changing behavioural and consumption patterns. Many plastics are non-biodegradable and their continued use is unsustainable, presenting a significant burden for future generations. The problem is more worsening in rural areas that are often marginalized in waste management discussions and policy implementation, increasing environmental degradation and communities' vulnerability to health risks (Hossain et al., 2022; Sharma and Patel, 2023) [1,2] . Although urban waste management includes formal systems for waste collection, segregation, treatment or disposal, rural communities often lack access to regular waste collection schemes and waste management infrastructure, with domestic plastic pollution leaching into natural environment (Dong et al., 2020; Roy and Mehta, 2023) [3,4] . These include easy accessibility of cheap plastic packaging materials to rural communities, leading to soil contamination and affecting key sectors like agriculture and tourism due to plastic pollution (Anunobi, 2022) [5] . The present study focused on Girdharpur village located in the Bisrakh block of Gautam Buddha Nagar district of Uttar Pradesh, India. The village lies approximately 13 kilometers east of the district headquarters in Noida and 27 kilometers from Bisrakh Jalalpur. Girdharpur's proximity to urban centers like Greater Noida and Delhi places it at the confluence of rural and rapidly urbanizing environments, thereby exhibiting characteristics such as an agricultural economy, modest infrastructure, and limited waste management services. The village is comprised of 335 households with a total population of 1,887 individuals, facing significant gender disparities in literacy and participation in environmental initiatives (Census of India, 2011; VillageInfo, 2023) [6,7] . Plastic waste generation in Girdharpur is influenced by seasonal changes and wide consumption of single-use plastics. In the absence of formal plastic waste sorting and collection systems, lack of financial support, and minimal environmental awareness, villagers routinely dispose of plastic waste in abandoned plots, along roadsides, and directly onto the surface of water, contaminating the environment, attracting vector-borne diseases, and exacerbating health risks (Gupta and Verma, 2020; Roman et al., 2022) [8,9] . Whereas few households engage in management practices such as using reusable bags or containers and avoiding products with excessive plastic packaging, lack of technical knowledge limits the efficiency of such efforts, preventing the adoption of biodegradable plastics as a potential solution. Despite few awareness campaigns and cleanliness drives in the area to promote waste segregation and management, the success of these initiatives is impeded by individuals' ignorance of the impacts of improper waste disposal, monetary investments, and less stringent enforcement of rules and regulations (Mishra and Sharma, 2023) [10] . Despite the above-mentioned challenges, there lies substantial opportunities for establishing management and collection systems focusing on plastic waste in rural areas (Das and Verma, 2023) [11] . This necessitates the designing of an integrated framework that covers aspects such as socio-economic conditions, plastic transport in the environment, and behavioural and consumption patterns of the rural population (Aneja et al., 2024) [12] . The study seeks to investigate current plastic waste sources, disposal practices, and willingness of villagers to participate in waste collection/segregation systems for plastic recycling in Girdharpur village, besides uncovering the socio-economic barriers that hinder sustainable waste management. The study addresses the need of informed decision-making where decisions regarding plastic waste management options must have community support for transitioning towards a circular economy (Patel and Singh, 2024) [13] .
Relevance of the Study
This work is significant as the studies on plastic pollution, especially focusing on rural communities compared to urban areas, are scarce in literature. Degradation of the rural environment through fossil fuel industries, resource depletion, intensive agriculture, waste generation along with climate change results in poverty, depopulation, and marginalization of rural areas around the world (Kumar et al., 2022) [14] . The findings will prove to be a useful resource for policymakers, local governance, and institutions in adopting a circular economic framework for plastic waste management by engaging rural community stakeholders and tailoring solutions (e.g., reducing plastic waste, designing plastics for optimal reuse, recycling or composting, and recovering plastic for use in new products) to the needs of the individuals. The research will serve as a reference for future studies on sustainable plastic waste management in other rural areas.
Scope and Limitations of the Study
This study explores plastic waste management practices in Girdharpur village, with a specific focus on sources of waste generation, waste collection, segregation, and recycling. The research employs a combination of qualitative and quantitative data collection techniques in the form of structured surveys, interviews, field observations, focus group discussions, and assesses the villagers' perceptions, attitudes, and behavioural patterns for waste management. The study evaluates the environmental and public health impacts of plastic waste disposal methods and identifies potential sustainable solutions. Although the work proposes certain policy recommendations, there is a paucity of detailed financial assessment of implementing large-scale plastic waste management systems in these areas. Moreover, the study is limited to Girdharpur village and may lack applicability in other rural areas that lack widespread waste management infrastructure and significantly differ in their socioeconomic conditions.
Research Objectives
In lieu of the above discussion, the current study was designed to accomplish the following objectives: a) To identify the various sources of plastic pollution (e.g., packaging, single-use plastics, and industrial waste) in the village. b) To analyze the effectiveness of local plastic collection, segregation, and recycling practices in the village community. c) To determine the level of public participation in plastic waste reduction initiatives (e.g., use of reusable bags, proper segregation) and assess the knowledge, attitudes, and practices of different groups regarding plastic waste.
Materials and Methods
Materials and Methods
Description of the Study area
Girdharpur is a medium-sized village situated in the Bisrakh Block of Gautam Buddha Nagar district in Uttar Pradesh, India (Fig. 1). It falls under the administrative jurisdiction of the Girdharpur Sunarasi Panchayat and is part of the Meerut Division. The village is located approximately 13 kilometers east of the district headquarters in Noida and 27 kilometers from Bisrakh Jalalpur (Census of India, 2011; Village Info, 2023). The village comprises 335 households with a total population of 1,887 individuals -1,034 males and 853 females. Most of the residents are engaged in farming, daily-wage labour or small-scale trade.
The study was conducted in the month of November, 2025.
Girdharpur was selected as the study area owing to its lack of plastic waste management infrastructure, dependency on conventional methods of waste disposal (e.g., open dumping, along roadsides, etc.), thereby raising environmental and public health risks. Limited awareness, inadequate institutional support, and minimal or no waste sorting, collection and segregation systems, make it suitable for exploring the challenges of plastic waste management in rural communities. The village's closeness to urban Greater Noida has a strong influence on the effects of urbanization on rural environmental practices.
Fig 1:
A map of Uttar Pradesh, India showing the study area (Girdharpur village, district Gautam Buddha Nagar, Uttar Pradesh).
Research Design, Target Population, and Sampling Strategy
A mixed-methods approach was employed to integrate both the qualitative and quantitative techniques and provide an understanding of plastic waste management practices in the selected village. The research combined the statistical trends and behavioural patterns along with the perceptions, experiences, attitudes, and beliefs of rural communities regarding plastic waste management.
The study involved 85 participants, including local households and stakeholders in plastic waste management.
A hybrid sampling strategy was used that combined both purposive and random methods to ensure sample representativeness and contextual insights.
(i) Household Surveys: About 85 households were randomly selected for the survey to include people with different socio-economic backgrounds. These households comprised the primary units of analysis for quantitative data collection.
(ii) Selection of Key Informants: Ten key informants were purposively selected on the basis of their active engagement in community-led plastic waste management initiatives. These comprised local leaders or stakeholders with relevant experiential knowledge to study household behaviours within broader socio-political and institutional context. The subjective experiences of various residents were also included to explore behavioural and economic determinants of waste management practices, increasing the qualitative dimension of the study.
Data Collection Methods
Data were collected through a combination of structured surveys, semi-structured interviews, field observations, and secondary data reviews.
(i) Structured Household Surveys: A structured questionnaire comprising both close-and open-ended questions was given to the 75 randomly selected households, to gain quantitative information on waste sorting/collection/segregation/recycling practices and detailed insights on perceptions, challenges, and motivation. The questionnaire was divided into four sections. Section 1 consisted of general information about age, gender, occupation, education level, income, etc. Section 2 constituted a plastic waste audit survey, including questions on household's plastic consumption and waste production. Section 3 was an awareness survey to assess each respondent's attitude, burden, environmental consciousness, subjective norms, level of environmental education, and behavioural intentions. Section 4 comprised a willingness survey that included questions regarding use of incentives and willingness to manage waste.
(ii) Key Informant Interviews: Ten key informants were purposively selected for semi-structured interviews, to explore community-led waste governance and institutional or infrastructural challenges.
(iii) Field Observations: Systematic field observations at household or community level were conducted by the researcher team to document various plastic waste disposal methods, informal dumping sites, and visible environmental conditions (e.g., contamination, localized pollution).
(iv) Secondary Data Reviews: Secondary sources such as government policy documents, relevant published literature, and case studies on rural plastic waste management were studied to understand similarities, differences, and policies for primary data interpretation.
Data Analysis
Data were analyzed quantitatively and qualitatively using a mixed-methods approach.
(i) Quantitative Analysis: Data from structured surveys were analyzed using descriptive statistics in MS Excel, enabling the documentation of trends, correlations, and demographic patterns related to household waste practices.
(ii) Qualitative Analysis: Open-ended survey responses, interview transcripts, and field observations were analyzed qualitatively to include various barriers to effective plastic waste management, villagers' perceptions on sustainability, and drivers of behavioural changes.
Results and Discussions
Results and Discussions
Demographic Profile of Respondents
The survey results revealed a notable imbalance in gender distribution of respondents, where male participation was 75% and only 25% were identified as females (Fig. 2). This was representative of a male-dominated response rate, where men are usually the ones participating in formal surveys or public discussions, reflecting their traditional gender roles in the village. Nevertheless, such a gender bias is particularly a limitation while assessing plastic waste management practices, as women typically manage household waste and are useful resources for providing accurate information on daily waste collection, segregation, or disposal routines. Limited representation of women might result in a partial understanding of the actual waste management practices; hence, future programmes should focus on greater female participation to accurately address community waste management needs. The educational profile of respondents indicates significant gaps that might influence the understanding and implementation of plastic waste management practices. Around 40% of the population received no formal education, which might comprehend loosely with improper collection or segregation methods and environmental benefits of recycling. 25% of the respondents received primary education and 30% had secondary education, laying a platform for successful comprehension of practical, visualbased educational campaigns. A smaller segment (15%) that received informal education and higher education (8%) were identified as suitable options for peer-led trainers or community facilitator roles. In general, hands-on training and awareness drives are urgently needed for understanding the behavioural patterns of individuals across various educational levels in promoting sustainable plastic waste management in Girdharpur.
Plastic Waste Audit Survey Results
In this survey, information such as familiarity of plastic pollution as a serious environmental issue, primary sources of plastic waste pollution in their community, reasons for using specific plastic items, avoiding certain plastic items, and plastic waste disposal methods at the household level, were investigated. Around 75% of the individuals were very familiar about plastic pollution (Fig. 4) and 68% understood it as a significant environmental issue of concern (Fig. 5). The primary sources of plastic waste pollution in the community were identified as single-use plastics like bags, straws, cutlery, etc. (63%,) packaging materials (20%), industrial waste (12%), and microplastics from personal care products (3%) (Fig. 6). Reasons for using specific plastic items were reported as cost-effectiveness, availability, and convenience of these products by majority of the respondents. About 71% of the residents come across plastic waste in their local environment (e.g., parks, streets, rivers, etc.) (Fig. 7). The average monthly household expenditure was mainly on food, medical expenses, and house rent. Of this, 15% was spent on bottled water for drinking, including small (1/2 L) and large (20 L) bottles, because of the lack of a safe drinking water supply system. Half of the residents reused the polyethylene terephthalate (PET) bottles, 25% kept the bottles for sale, 10% disposed them of on land or in water bodies. Various measures adopted by the residents to reduce plastic waste in their day-to-day lives included the use of reusable bags and containers by 60% of the population, 16% avoided products with excessive plastic packaging, and 47% recycled plastic items (Fig. 8). 77% of the respondents are unaware of alternatives to plastic products. Although there are alternatives to items like forks, containers, cups or bags to reduce the volume of plastic waste, but no alternative lies for PET bottles, emphasizing the need for a safe drinking water source in the village. Alternatives for single-use plastics including straws and other wrapping materials, are also largely not available. 69% of the residents identified bio-based plastics as a viable strategy for plastic waste management; hence, these patterns highlight the need for better alternatives for plastic items, encouraging consumer acceptance and environmental sustainability.
Awareness Survey Results
Of the surveyed respondents, many of the residents were aware of the harmful impacts of plastic waste on the environment. The impacts were identified as: (a) ocean pollution by 1% of the respondents, (b) wildlife ingestion and entanglement -5%, (c) soil contamination -89%, and (d) air pollution from incineration -5% (Fig. 9). Thus, the respondents at least understood the pollution issues caused by disposing of plastic waste on land or in water bodies.
Although there were strong attitudes, good social intentions, and environmental awareness, but the respondents felt that participating in plastic collection and separation placed a high burden on their lives. Hence, most of the respondents (55%) were not willing to pay more for products with ecofriendly packaging (Fig. 10). A vast amount of this knowledge was gained from the local leaders and authorities.
The awareness and participation in community-led initiatives or campaigns to reduce plastic waste is not high (only 17% participation). However, the respondents identified the responsibility of government (88%), corporations and manufacturers (9%), consumers (2%), and NGOs and advocacy groups (1%), for addressing plastic waste (Fig. 11). The respondents (87%) also emphasized that education and awareness creation plays a strong role in solving the plastic waste problem (Fig. 12). The level of awareness about government policies aimed at reducing plastic waste at local or national levels was 62%, while 38% were unaware of it. Thus, it is important to raise awareness among the residents and initiate cleanliness drives to reflect effective outreach. Awareness sources might include word of mouth, NGOs, media, and digital platforms, encouraging the value of multi-channel communication. Various barriers were identified as complicated procedures, lack of proper guidance, limited information, and reports of corruption/intermediaries. This highlighted the need for simpler methods, better access to information, and stronger local support to improve program outreach and efficiency.
Willingness to participate in Waste Collection
Among the various respondents, about 24% of the residents always recycled plastic waste in home or workplace (Fig. 13). Moreover, 34% of the respondents always separate plastic waste from other types of waste at home or workplace (Fig. 14). Most of the respondents (88%) were not aware of the plastic recycling facilities available in their area. Although the participants expressed a positive outlook and high willingness to participate in plastic waste collection, but a lack of recycling facilities (13.93%), awareness (12.29%), inconvenience (63.93%), and high cost (9.83%) were regarded as the major barriers to effective plastic recycling and waste management (Fig. 15). Some of the participants, however lesser in number (15%) expressed their willingness to participate in plastic waste separation and collection systems without any incentives. However, others (85%) agreed to cooperate in the initiative only when incentives shall be provided. Also, most of the respondents opposed the idea to pay for a plastic waste collection service provided by outsiders. Economic incentives were found as the most important factor that might encourage villagers' to participate in waste separation and collection activities. Hence, these trends emphasize the need for better governance, education on waste segregation, and decentralized waste systems to improve sustainability and health outcomes.
Conclusion
An in-person perception survey was conducted by researchers interviewing about 85 households in the Girdharpur village. The study captured the villagers' perceptions of plastic waste, i.e., familiarity about plastic pollution, reasons for using and avoiding specific plastic items for consumption, plastic waste disposal methods, and their willingness to participate in plastic waste separation and collection systems. The results revealed that the environmental awareness among residents is relatively high; however, effective translation of this awareness into sustainable waste practices is low owing to constraints such as limited infrastructure, inadequate technical or institutional support, and lack of sufficient public knowledge on waste segregation and recycling. Respondents' willingness to participate in recycling efforts is a viable strategy, but most of them agreed to participate when incentives shall be provided. This highlights a viable point of intervention for promoting circular economy strategies. Efficacy of plastic waste management is further limited by seasonal and technical challenges, underdeveloped recycling and segregation practices, lack of awareness, absence of appropriate facilities, and fragmented waste collection systems. Technical solutions alone are not sufficient; hence, these must be combined with studying behavioral changes, capacity building, inclusive policies, and active community engagement.
Recommendations
Recommendations
Figures and tables from the paper
References
14 in the original paper- Hossain R, Islam MT, Shanker R, Khan D, Locock KES, Ghose A, et al. Plastic waste management in India: challenges, opportunities, and roadmap for circular economy. Sustainability. 2022;14:4425.
- Sharma N, Patel R. Disparities in waste management infrastructure across urban and rural India. International Journal of Waste Resources. 2023;13(1):21-30.
- Dong CD, Chen CW, Chen YC, Chen HH, Lee JS, Lin CH. Polystyrene microplastic particles: in vitro pulmonary toxicity assessment. Journal of Hazardous Materials. 2020;385:121575.
- Roy A, Mehta D. Organic waste management in rural India: a critical assessment of household composting practices. Environmental Management and Sustainability. 2023;18(2):134-149.
- Anunobi TJ. Hazardous effects of plastic wastes on land biodiversity: a review. Zoologist (The). 2022;20:80-86.
- Census of India. Primary census abstract data tables Uttar Pradesh. Office of the Registrar General and Census Commissioner, Government of India; 2011. https://censusindia.gov.in
- VillageInfo. Girdharpur village information report. 2023. https://villageinfo.in
- Gupta R, Verma A. Challenges in rural waste management: a case study approach. Journal of Environmental Studies. 2020;45(2):134-152.
- Roman L, Hardesty BD, Schuyler Q. A systematic review and risk matrix of plastic litter impacts on aquatic wildlife: a case study of the Mekong and Ganges River Basins. Science of the Total Environment. 2022;843:156858.
- Mishra D, Sharma A. Examining enforcement gaps in rural waste management policies: lessons from India. Sustainable Development Journal. 2023;21(4):299-317.
- Das R, Verma S. Community-driven waste segregation and landfill reduction in Bihar. Journal of Rural Waste Studies. 2023;15(2):112-128.
- Aneja S, Kalakoti S, Parihar DS. Urgent need of plastic waste management: a review. Research Review International Journal of Multidisciplinary. 2024;9:114124.
- Patel S, Singh R. The role of the circular economy in rural waste management: policy and behavioral implications. Journal of Sustainable Development. 2024;18(1):34-50.
- Kumar A, Singh P, Sharma R. Challenges and opportunities in rural waste management: a policy perspective. Environmental Policy Review. 2022;14(3):78-94.