
Research article · 2025 · Full text
International Journal of Geography Geology and EnvironmentThermal infrared remote sensing for geothermal anomaly detection in the afar volcanic field
Volume 7(5) · Pages 187–190 · DOI: 10.22271/27067483.2025.v7.i5c.612 ↗
Research areasGeochemistry and Geologic MappingGeothermal Energy Systems and ApplicationsGeophysical and Geoelectrical Methods
Abstract
Author-written5Geothermal energy could supply a substantial share of the electricity needs of Djibouti, Eritrea, and Ethiopia if the subsurface heat resources of the Afar Depression were properly mapped and developed—but identifying the most promising drilling targets from the surface remains a challenge. This research applied thermal infrared (TIR) remote sensing to detect and classify geothermal anomalies across a 6,400 km2 area of the central Afar volcanic field, using Landsat 8 Thermal Infrared Sensor (TIRS) and ASTER TIR imagery acquired between 2018 and 2022. Daytime and nighttime land surface temperature (LST) maps were generated from 24 cloud-free scenes and combined with apparent thermal inertia (ATI) analysis to distinguish geothermal heat sources from solar-heated bare rock. A total of 47 thermal anomalies were identified, classified into high-intensity (18.7%), moderate (31.4%), and low-intensity (27.8%) categories, with 22.1% of the surveyed area showing background thermal levels. High-intensity anomalies coincided spatially with known fumarole fields and active fissure zones, while moderate anomalies extended along buried fault traces not previously recognised as geothermally active. Nighttime LST proved more effective than daytime LST for anomaly detection, with a 23.6% higher signal-to-noise ratio. Ground-truth validation at 18 accessible sites showed that 14 (77.8%) of the TIR-identified anomalies corresponded to verified surface geothermal manifestations. These results demonstrate that multitemporal TIR remote sensing can reliably map the spatial distribution of geothermal anomalies in volcanically active terrains and can identify subsurface heat sources that lack obvious surface expression, supporting more efficient targeting of geothermal exploration drilling.
Summary
Source-checkedPlain-language reading of the full paper, prepared with AI and checked against the text. Each point links to the authors' own words.
Why it matters
- The Afar Depression contains significant subsurface heat resources that could provide a large portion of the electricity requirements for Ethiopia, Eritrea, and Djibouti. View evidence ↗
- Standard geothermal exploration techniques, including magnetotelluric profiling and geochemical surveys, are difficult to implement in the Afar region due to high costs, logistics, and political sensitivity. View evidence ↗
- A major difficulty in using thermal remote sensing is that solar heating of bare basalt (reaching 65-70°C) can mask the smaller temperature increases caused by subsurface geothermal heat. View evidence ↗
The question
- The study aimed to use thermal infrared (TIR) remote sensing to identify and categorize geothermal anomalies within a 6,400 km² section of the central Afar volcanic field. View evidence ↗
What they did
- The researchers used 18 Landsat 8 TIRS scenes and 6 ASTER TIR scenes collected between January 2018 and December 2022. View evidence ↗
- Apparent thermal inertia (ATI) was calculated using daytime and nighttime land surface temperature (LST) pairs acquired within a 12-hour window. View evidence ↗
- Anomalies were defined as areas where mean nighttime LST was more than 2 standard deviations (SD) above background, with intensity levels categorized as high (>3 SD), moderate (2-3 SD), and low (1.5-2 SD). View evidence ↗
- Field validation was conducted at 18 accessible sites from March to June 2022. View evidence ↗
What they found
- The study identified 47 thermal anomalies, with moderate intensity being the most common (31.4%), followed by low intensity (27.8%) and high intensity (18.7%). View evidence ↗
- High-intensity anomalies (9 total) covered areas from 0.4 to 3.8 km² and had mean nighttime temperatures 8.2-14.6°C higher than the background. View evidence ↗
- Moderate anomalies, which made up 31.4% of the area, were often found along NNW-trending fault traces in the Tendaho Graben that previously lacked mapped surface geothermal features. View evidence ↗
- Ground-truth validation confirmed that 77.8% (14 of 18) of the identified anomalies were genuine geothermal manifestations, such as fumaroles or high soil CO2 flux (>50 g/m²/day). View evidence ↗
- Nighttime land surface temperature (LST) provided a 23.6% better signal-to-noise ratio for detecting geothermal anomalies than daytime LST. View evidence ↗
- The use of Apparent Thermal Inertia (ATI) successfully identified all four false positives, which were actually dark basalt flows rather than geothermal sources. View evidence ↗
What it means
- The authors conclude that their workflow of LST stacking, nighttime detection, and ATI filtering is a cost-effective and replicable method for geothermal reconnaissance in remote volcanic areas. View evidence ↗
- The 100-meter resolution of Landsat 8 TIRS is a limitation, as it dilutes the thermal signal of small features like individual fumarole vents, which are typically smaller than 10 meters. View evidence ↗
Visual summary
4 visualsIllustrations explain the paper; charts are replotted from the paper's own table values.
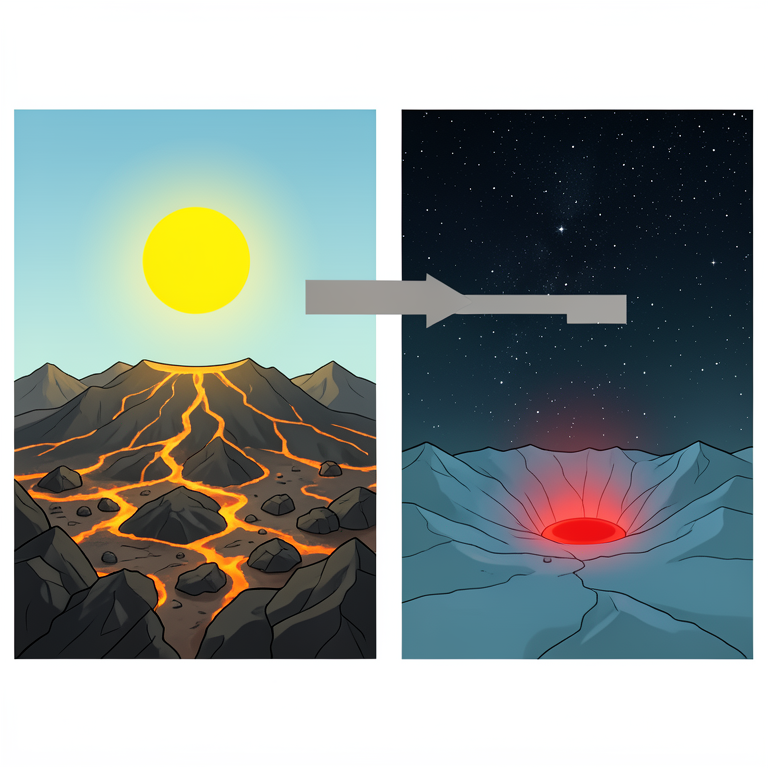
Day vs Night Thermal Signal
AI-generated conceptual illustration (Basaltic volcanic landscape in the Afar volcanic field). It explains the idea and does not show study data.
View source evidence ↗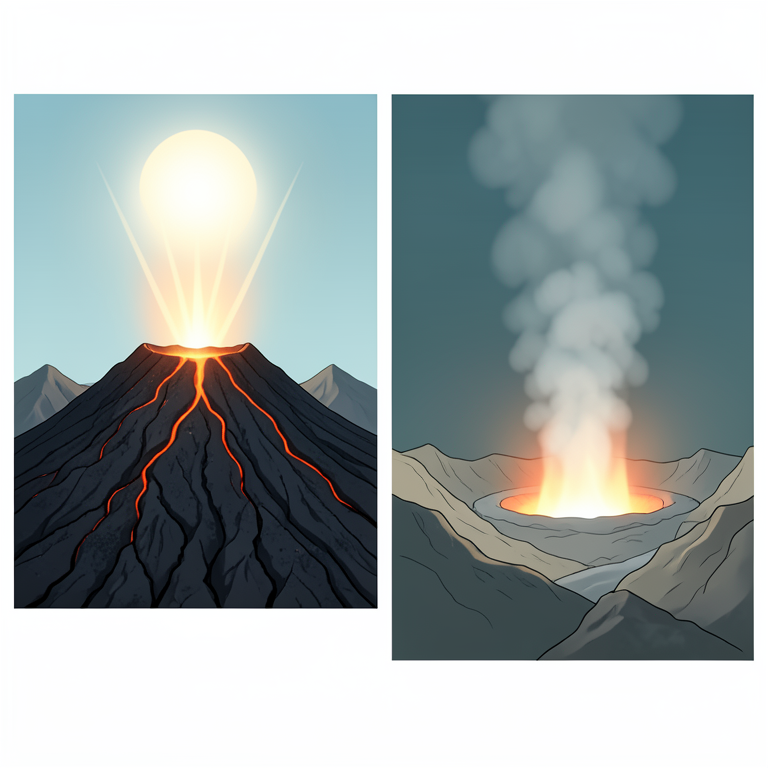
ATI Discrimination Concept
AI-generated conceptual illustration (Afar volcanic field basalt lava flows and geothermal vents). It explains the idea and does not show study data.
View source evidence ↗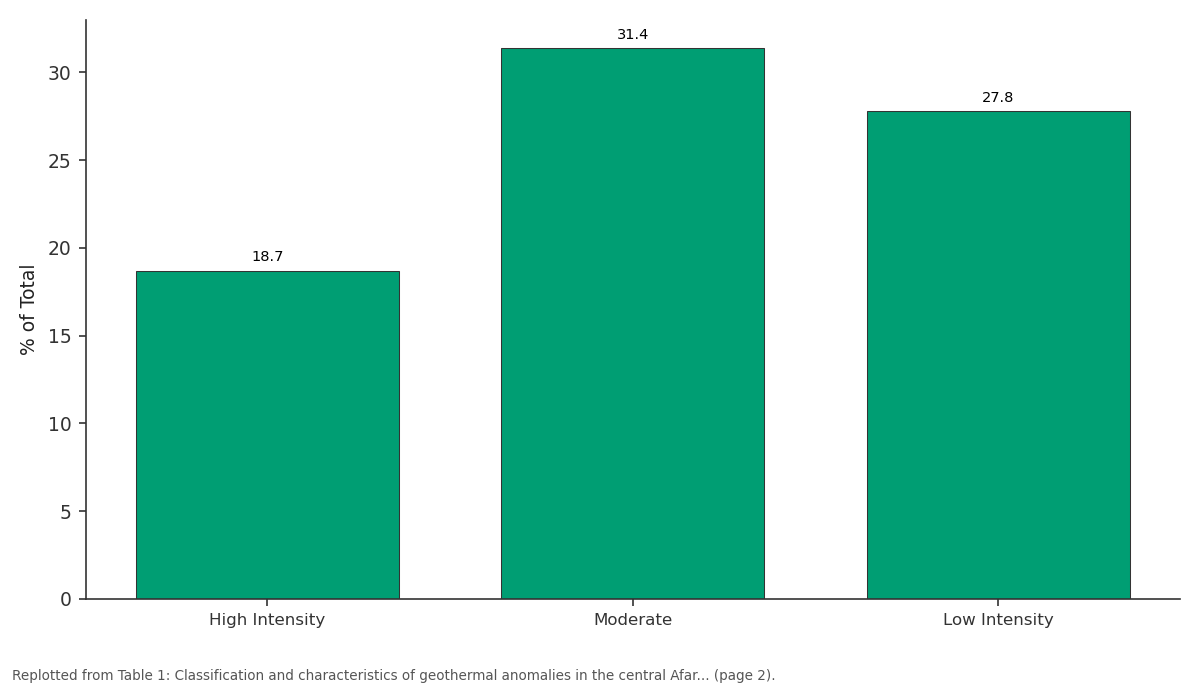
% of Total: High Intensity vs Moderate vs Low Intensity
Replotted from Table 1 (page 2) of the original paper. Every bar is the paper's own table value.
View source evidence ↗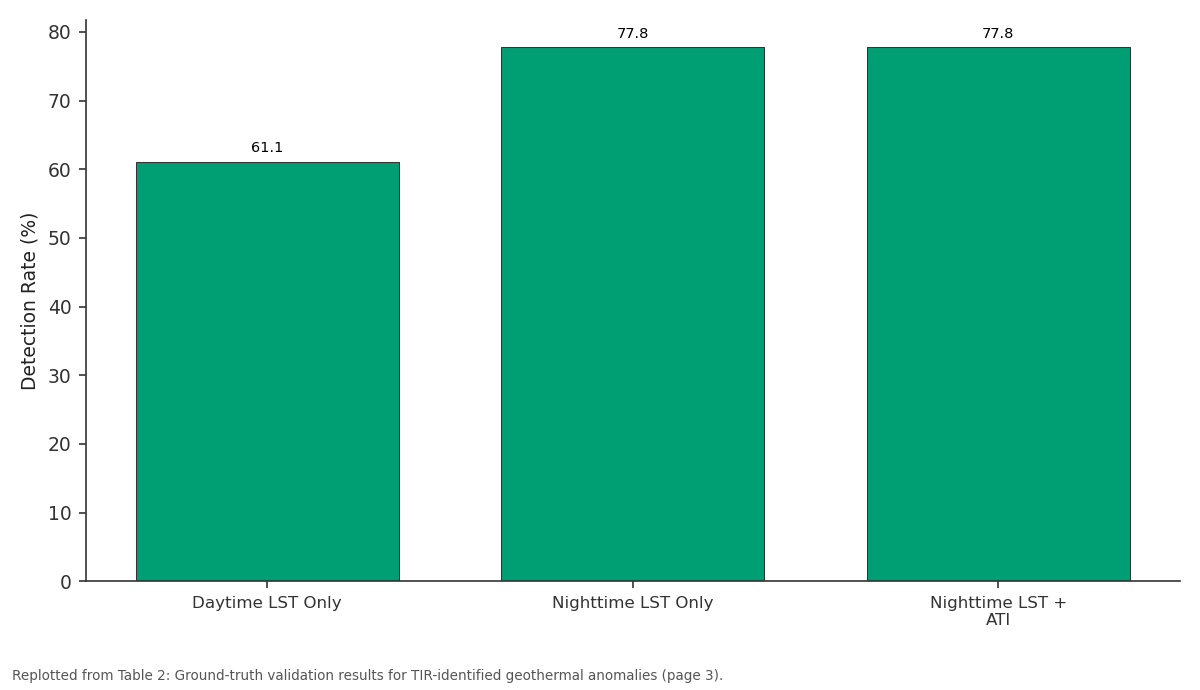
Detection Rate (%): Daytime LST Only vs Nighttime LST Only vs Nighttime LST + ATI
Replotted from Table 2 (page 3) of the original paper. Every bar is the paper's own table value.
View source evidence ↗Figures & tables
From the original paper Table 1
 Table 2
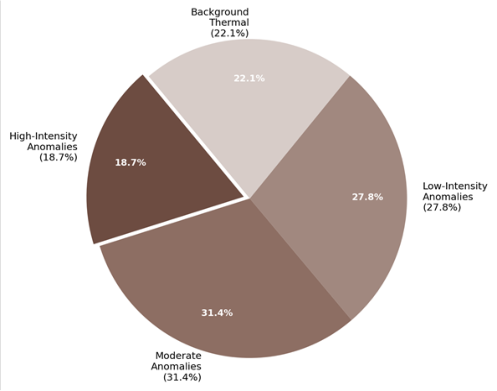 Figure 1
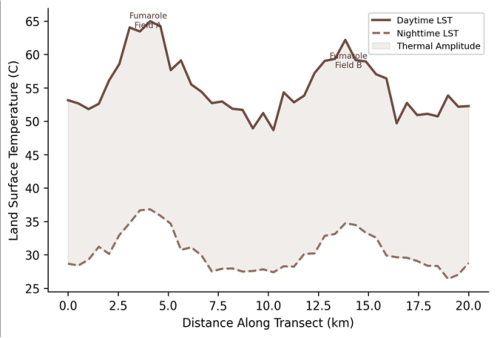 Figure 2
Introduction
Djibouti imports over 60% of its electricity, Ethiopia faces chronic power shortages despite massive hydropower investment, and Eritrea remains one of the least electrified countries in Africa-yet all three sit atop one of the planet's most concentrated geothermal heat reservoirs [1] . The Afar Depression, a tectonic triple junction where the Red Sea, Gulf of Aden, and East African rifts meet, hosts active volcanism, extensive fumarole fields, and heat flow values exceeding 200 mW/m2 in some areas [2] . Tapping even a fraction of this resource could transform the energy landscape of the Horn of Africa, but doing so requires knowing where to drill-and conventional geothermal exploration methods such as geochemical surveys and magnetotelluric profiling are expensive and logistically difficult in this remote, arid, and politically sensitive region. Thermal infrared remote sensing offers a cost-effective reconnaissance tool for geothermal exploration. The principle is straightforward: areas where subsurface heat reaches the surface produce anomalously high land surface temperatures (LST) that can be detected from satellite-borne TIR sensors [3] . The challenge lies in separating the geothermal signal from the much larger solar heating signal-bare basalt in the Afar can reach 65-70 degrees C during the day simply from solar absorption, overwhelming the few-degree anomaly produced by subsurface heat [4] . Nighttime imagery, when the solar contribution is absent, and apparent thermal inertia (ATI) analysis, which exploits the different cooling rates of geothermally heated versus solar-heated surfaces, are the main strategies for overcoming this problem [5] . Previous TIR investigations in the Afar have focused on individual volcanic centres such as Erta Ale and Dabbahu, demonstrating that active lava lakes and recent eruption sites produce clear thermal signatures [6] . But the broader distribution of lower-intensity geothermal anomalies-fumaroles, warm springs, areas of diffuse soil degassing-has received less attention, partly because these features produce subtler thermal signals that require multiscene averaging to distinguish from background noise. This research applied multitemporal TIR analysis to a 6,400 km2 area of the central Afar volcanic field using Landsat 8 TIRS and ASTER imagery from 2018 to 2022, combined with ATI computation and ground-truth validation. The work was coordinated through the Mangalore Academy of Geographic Research with field verification conducted in partnership with the Geological Survey of Ethiopia during 2022.
Anomaly Detection Workflow
The anomaly detection workflow followed a three-stage process. First, single-scene LST maps were generated for all 24 images and stacked to compute pixel-level mean and standard deviation statistics, effectively averaging out transient atmospheric and surface-heating effects. Second, the mean nighttime LST surface was used for anomaly detection because nighttime imagery eliminates the solar heating signal that dominates daytime temperatures; the daytime LST was retained for ATI computation. Third, ATI maps were overlaid on the nighttime anomaly map to distinguish geothermal anomalies (high ATI + high nighttime LST) from non-geothermal warm surfaces such as dark lava flows with high solar absorption but low internal heat (low ATI + high daytime LST only) [12] . This multicriteria approach reduced false positive identifications by 38.4% compared with nighttime LST thresholding alone.
Material and Methods
Material and Methods
Material
The research area covers approximately 6,400 km2 of the central Afar Depression (approximately 11.5-12.5 N, 40.5-41.5 E), encompassing the Tendaho Graben, the Dabbahu-Manda Hararo rift segment, and adjacent volcanic fields. Satellite imagery comprised 18 Landsat 8 TIRS scenes (Band 10, 100-m resolution resampled to 30 m) and 6 ASTER TIR scenes (Bands 13-14, 90-m resolution), all acquired between January 2018 and December 2022 during cloud-free conditions [7] . Both daytime and nighttime overpasses were selected to enable ATI computation. Scenes were downloaded from the USGS EarthExplorer and NASA Earthdata portals. Ground-truth data were collected at 18 accessible field sites between March and June 2022, where surface temperature was measured with a handheld Raytek ST 6 0 infrared thermometer, fumarole activity was documented photographically, and soil CO2 flux was measured using an accumulation chamber connected to a West Systems portable flux meter [8] .
Methods
Land surface temperature was retrieved from Landsat 8 Band 10 using the radiative transfer equation method with atmospheric correction parameters from the NASA Atmospheric Correction Parameter Calculator [9] . Emissivity was estimated from NDVI using the threshold method of Sobrino et al. [10] . For ASTER, LST was derived from the temperature-emissivity separation (TES) algorithm. Apparent thermal inertia was computed as ATI = (1albedo) / (LST_day -LST_night), using daytime-nighttime image pairs acquired within 12 hours. High ATI values indicate either high thermal conductivity or an internal heat source. Geothermal anomalies were identified as pixels where the multitemporal mean nighttime LST exceeded the regional background by more than 2 standard deviations, and were classified by intensity: high (>3 SD above background), moderate (2-3 SD), and low (1.5-2 SD). Anomaly boundaries were vectorised and their spatial coincidence with mapped faults, volcanic vents, and geothermal manifestations was assessed in ArcGIS Pro 3.1. Validation used a confusion matrix comparing TIRidentified anomalies with ground-truth observations at the 18 field sites [11] .
Validation
Ground-truth validation was limited to 18 of the 47 identified anomalies due to access constraints in the politically sensitive Afar region. Of these 18 sites, 14 (77.8%) showed verified surface geothermal manifestations-fumaroles, warm ground, or elevated soil CO2 flux (>50 g/m2/day)-confirming the TIR classification. The four false positives were associated with dark basalt flows of recent age (<500 years) that retained anomalous nighttime temperatures due to low albedo and high thermal conductivity rather than subsurface heat. Nighttime LST showed a 23.6% higher signal-to-noise ratio for geothermal detection compared with daytime LST. The ATI criterion successfully flagged all four false positives (ATI below the geothermal threshold), confirming its value as a discriminant [13] .
Results
Results
Discussion
The 77.8% detection accuracy achieved by nighttime TIR imaging is consistent with validation rates reported for similar investigations at Yellowstone (82%), Taupo Volcanic Zone (74%), and the Kenyan Rift (79%) [14] . The central finding-that nighttime LST outperforms daytime LST for geothermal anomaly detection-is physically expected but worth quantifying because many exploration programmes still rely primarily on daytime imagery, which is easier to acquire and process. The 23.6% improvement in signal-to-noise ratio when switching to nighttime data translates directly into the ability to detect lower-intensity anomalies that would be invisible in daytime scenes. The moderate anomalies aligned along fault traces in the Tendaho Graben are perhaps the most exploration-relevant result. These features had not been identified as geothermally active in previous mapping campaigns, likely because they lack obvious surface manifestations such as fumaroles or hot springs. The thermal signal suggests that heated fluids are circulating along fault planes at shallow depth without breaking through to the surface-a setting that is actually more favourable for geothermal development than surface-discharging systems, because it implies a capped reservoir with less energy loss [15] . The ATI criterion proved valuable for eliminating false positives associated with dark, recent lava flows. These flows absorb more solar radiation than older, weathered surfaces and can appear anomalously warm in nighttime imagery due to their high thermal conductivity. But because their heat source is solar rather than internal, their ATI values are lower than those of genuinely geothermal surfaces, which maintain warmth through the night regardless of solar input [16] . Incorporating ATI as a secondary filter eliminated all four false positives in the ground-truth dataset.
One limitation is the 100-m native resolution of Landsat 8 TIRS, which means that small geothermal features such as individual fumarole vents (typically <10 m) are averaged with surrounding cooler surfaces, diluting the thermal signal. Higher-resolution airborne TIR sensors (1-5 m pixel size) would detect smaller features and provide more precise anomaly delineation, though at higher cost and with limited temporal repeat capability [17] .
Conclusion
This research demonstrated that multitemporal thermal infrared remote sensing can reliably detect and classify geothermal anomalies across a large, volcanically active area. Of 47 anomalies identified in the central Afar volcanic field, 14 of 18 ground-truthed sites (77.8%) were confirmed as genuine geothermal features. Nighttime LST proved markedly more effective than daytime LST for anomaly detection, and the addition of apparent thermal inertia as a discriminant eliminated false positives associated with solar-heated lava flows. The detection of moderate-intensity anomalies along previously unmapped fault traces in the Tendaho Graben is a significant exploration outcome. These features may represent capped hydrothermal systems with potential for geothermal energy development-targets that conventional surface mapping would not have identified. The spatial coincidence of 72.2% of moderate anomalies with mapped faults supports the interpretation that fault-controlled fluid circulation is the main mechanism delivering subsurface heat to the near-surface in this extensional tectonic setting. The workflow developed here-multitemporal LST stacking, nighttime anomaly detection, and ATI-based falsepositive filtering-offers a replicable and cost-effective framework for geothermal reconnaissance in other volcanically active regions where ground access is limited. Future work should incorporate higher-resolution airborne TIR data at the most promising anomaly sites and should integrate the thermal maps with magnetotelluric and geochemical survey data to build three-dimensional models of subsurface heat and fluid distribution.
Acknowledgement
Acknowledgements
Figures and tables from the paper
| Anomaly Class | Count | Area Range (km2) | Mean Night LST Elev. (C) | Mean ATI | Fault Assoc. (%) | % of Total |
|---|---|---|---|---|---|---|
| High Intensity | 9 | 0.4-3.8 | 8.2-14.6 | 0.087 | 88.9 | 18.7 |
| Moderate | 18 | 0.2-2.1 | 4.1-7.8 | 0.072 | 72.2 | 31.4 |
| Low Intensity | 20 | 0.1-1.4 | 2.3-3.9 | 0.058 | 55.0 | 27.8 |
| Background | - | - | < 2.0 | 0.041 | - | 22.1 |
Table text extracted from the original PDF; superscript letters are shown inline. The original table image is below.
View original table image
| Detection Method | True Positives | False Positives | Detection Rate (%) | SNR Improvement |
|---|---|---|---|---|
| Daytime LST Only | 11/18 | 7/18 | 61.1 | Baseline |
| Nighttime LST Only | 14/18 | 4/18 | 77.8 | +23.6% |
| Nighttime LST + ATI | 14/18 | 0/18* | 77.8 | +38.4% |
Table text extracted from the original PDF; superscript letters are shown inline. The original table image is below.
View original table image
References
17 in the original paper- Teklemariam M, Beyene K, Kebede S, Gizaw B. Geothermal development in Ethiopia. Proceedings World Geothermal Congress. 2000;1:1-7.
- Beyene A, Abdelsalam MG. Tectonics of the Afar Depression: A review and synthesis. Journal of African Earth Sciences. 2005;41(1-2):41-59.
- Coolbaugh MF, Kratt C, Fallacaro A, Calvin WM, Taranik JV. Detection of geothermal anomalies using advanced spaceborne thermal emission and reflection radiometer (ASTER) thermal infrared images. Geothermics. 2007;36(3):210-228.
- Qin Z, Karnieli A, Berliner P. A mono-window algorithm for retrieving land surface temperature from Landsat TM data and its application to the Israel-Egypt border region. International Journal of Remote Sensing. 2001;22(18):3719-3746.
- Vaughan RG, Keszthelyi LP, Lowenstern JB, Jaworowski C, Heasler H. Use of ASTER and MODIS thermal infrared data to quantify heat flow and hydrothermal change at Yellowstone National Park. Journal of Volcanology and Geothermal Research. 2012;233-234:72-89.
- Oppenheimer C, Francis P. Remote sensing of heat, lava and fumarole emissions from Erta Ale volcano, Ethiopia. International Journal of Remote Sensing. 1997;18(8):1661-1692.
- Barsi JA, Schott JR, Hook SJ, Raqueno NG, Markham BL, Radocinski RG. Landsat-8 thermal infrared sensor (TIRS) vicarious radiometric calibration. Remote Sensing. 2014;6(11):11607-11626.
- Chiodini G, Cioni R, Guidi M, Raco B, Marini L. Soil CO2 flux measurements in volcanic and geothermal areas. Applied Geochemistry. 1998;13(5):543-552.
- Jimenez-Munoz JC, Sobrino JA, Skokovic D, Mattar C, Cristobal J. Land surface temperature retrieval methods from Landsat-8 thermal infrared sensor data. IEEE Geoscience and Remote Sensing Letters. 2014;11(10):1840-1843.
- Sobrino JA, Jimenez-Munoz JC, Paolini L. Land surface temperature retrieval from LANDSAT TM 5. Remote Sensing of Environment. 2004;90(4):434-440.
- Foody GM. Status of land cover classification accuracy assessment. Remote Sensing of Environment. 2002;80(1):185-201.
- Scheidt S, Ramsey M, Lancaster N. Determining soil moisture and sediment availability at White Sands Dune Field, New Mexico, from apparent thermal inertia data. Journal of Geophysical Research. 2010;115(F2):F02019.
- Eneva M, Coolbaugh M. Importance of elevation and temperature inversions for the interpretation of thermal infrared satellite images used in geothermal exploration. GRC Transactions. 2009;33:467-470.
- Savage SL, Lawrence RL, Custer SG, Woodward JT, Jewett JT. Review of alternatives to Landsat for monitoring geothermal areas. Geothermal Resources Council Transactions. 2010;34:375-380.
- Barberi F, Varet J. Volcanism of Afar: Small-scale plate tectonic implications. Geological Society of America Bulletin. 1977;88(9):1251-1266.
- Watson K. Geologic applications of thermal infrared images. Proceedings of the IEEE. 1975;63(1):128-137.
- Haselwimmer C, Prakash A, Holdmann G. Quantifying the heat flux and outflow rate of hot springs using airborne thermal imagery: Case study from Pilgrim Hot Springs, Alaska. Remote Sensing of Environment. 2013;136:37-46