
Research article · 2026 · Full text
International Journal of Geography Geology and EnvironmentResearch on the Influence of Prestress on the Formation of Rock Mass Reinforcement Arch around Coal Mine Roadways
Volume 8(4) · Pages 156–162 · DOI: 10.22271/27067483.2026.v8.i4a.615 ↗
Research areasGeomechanics and Mining EngineeringRock Mechanics and ModelingGeotechnical and Mining Engineering
Abstract
Author-writtenThe transition to deep-level mining below -200 m in Vietnam's coal sector, particularly at the Mao Khe mine, necessitates a shift from passive support systems to active reinforcement strategies to counteract high strata pressure and complex rock deformation. This study utilizes FLAC3D numerical simulation with a Mohr-Coulomb constitutive model to quantitatively analyze the formation of a
Summary
Source-checkedPlain-language reading of the full paper, prepared with AI and checked against the text. Each point links to the authors' own words.
Why it matters
- Vietnamese coal mining is moving to depths below -200 m, where high strata pressure and complex rock deformation make maintaining roadway stability difficult. View evidence ↗
The question
- The study aims to establish a quantitative relationship between bolt prestress levels and the thickness of the reinforcement arch to optimize safety and cost. View evidence ↗
What they did
- The study focused on the Southwest I cross-cut roadway at the -230 m level of the Mao Khe coal mine. View evidence ↗
- The simulation used D20 steel bolts 2.2 m long, installed in a 0.8 m by 0.8 m grid. View evidence ↗
- Numerical results were validated using field monitoring and on-site pull-out tests at the Mao Khe mine. View evidence ↗
What they found
- Increasing prestress from 20 kN to 40 kN expanded the compressive zone thickness by 2.16 times, but further increases only added about 0.18 m of thickness. View evidence ↗
- Increasing the prestress from 20 kN to 60 kN reduced the roof failure (plastic) zone from 1.2 m to 0.45 m. View evidence ↗
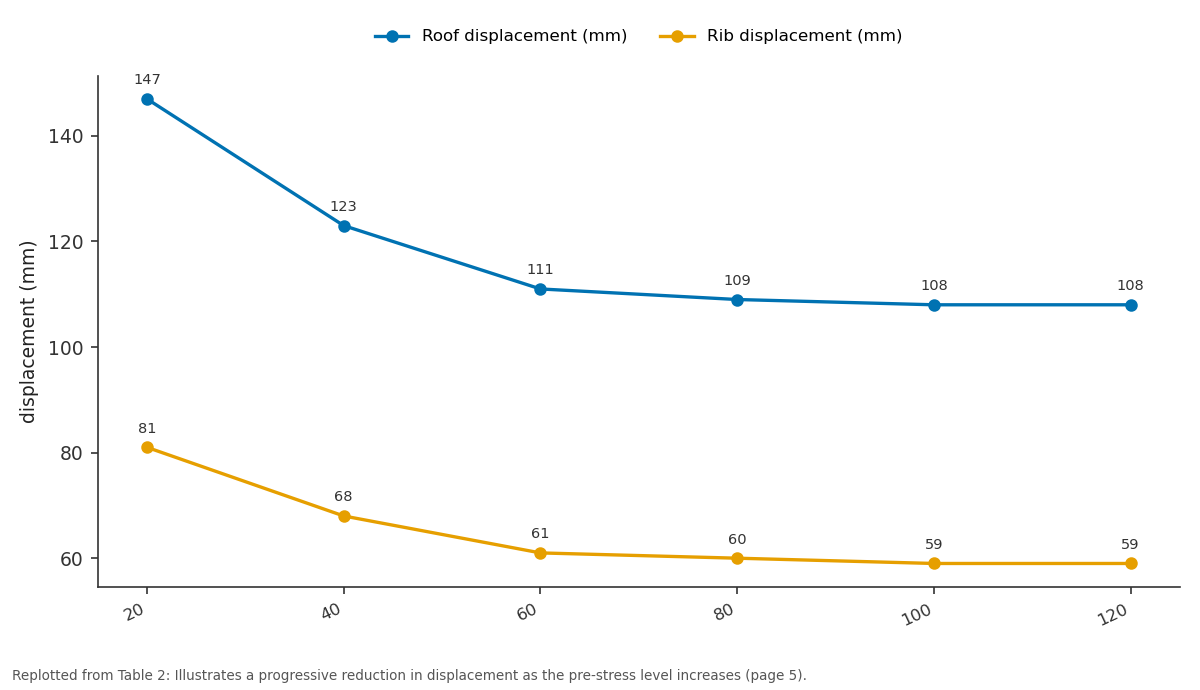
- Field measurements closely matched simulation predictions, with roof displacements of 110-115 mm and rib displacements of 60-63 mm. View evidence ↗
What it means
- The authors conclude that 60 kN is the optimal prestress level, as higher values provide minimal stability gains and increase the risk of bolt failure. View evidence ↗
- The authors state that future work is needed to study the long-term effects of mine humidity and dynamic stress from nearby mining on the arch's durability. View evidence ↗
Visual summary
1 visualsIllustrations explain the paper; charts are replotted from the paper's own table values.
Roof displacement (mm) and Rib displacement (mm): 20 vs 40 vs 60 vs 80 vs 100
Replotted from Table 2 (page 5) of the original paper. Every bar is the paper's own table value.
View source evidence ↗Figures & tables
From the original paper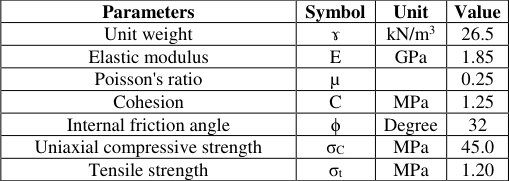 Table 1
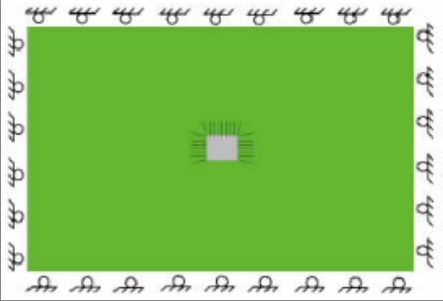 Figure 1
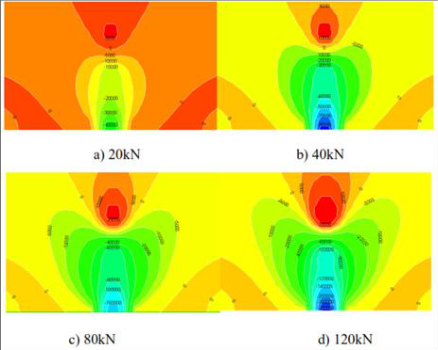 Figure 2
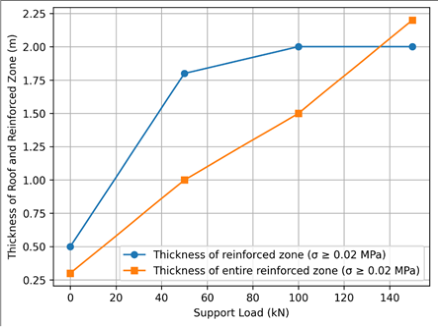 Figure 3
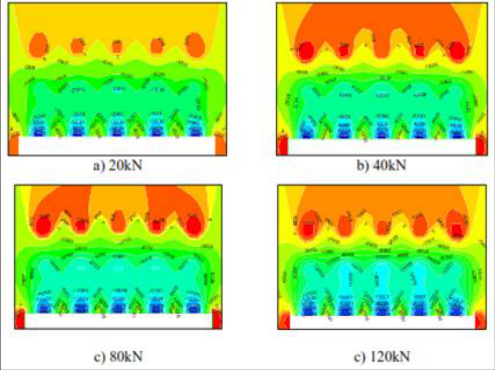 Figure 4
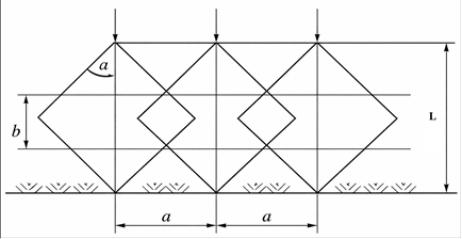 Figure 5
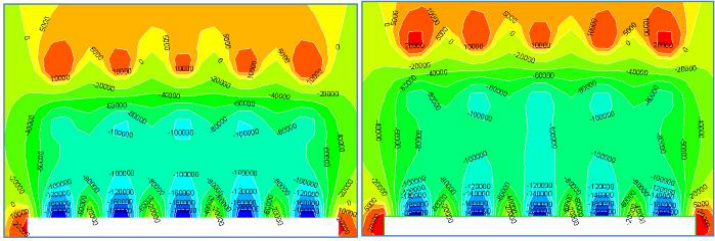 Figure 6
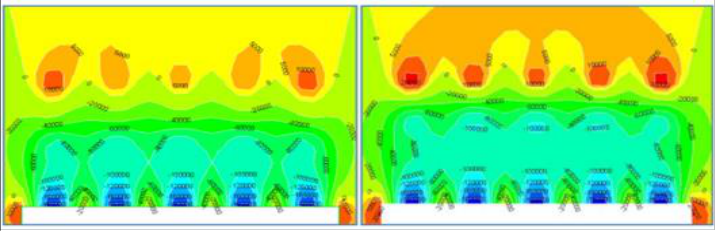 Figure 7
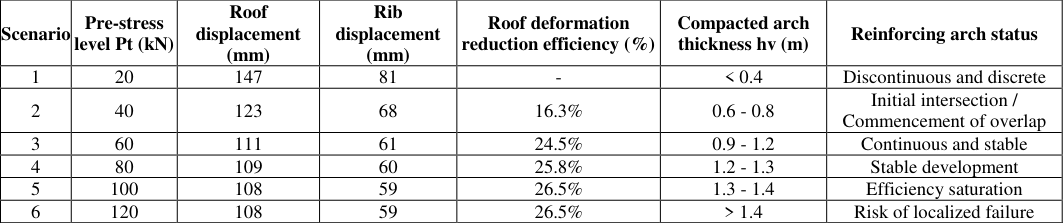 Table 2
 Figure 8
Introduction
In contemporary Vietnamese underground coal mining, as shallow coal seams are gradually being depleted, mines are simultaneously transitioning to deeper levels (below -200 m). Maintaining the stability of deep-level roadways faces significant challenges due to high strata pressure and complex surrounding rock deformation, particularly under the varying geological conditions of the Quang Ninh region. Traditional support methods using rigid steel sets, while possessing high load-bearing capacity, are inherently "passive", they only begin to resist pressure after the rock mass has already fractured and loosened. This results in high maintenance costs and significant safety risks. According to [1] , the combined support system of Rock Bolts -Wire Mesh -Shotcrete marks a pivotal shift toward "active" support methods, which focus on mobilizing the self-supporting capacity of the surrounding rock mass itself. The most critical link in this support technology is the prestressing force of the bolts. When a bolt is prestressed immediately after installation, it exerts a compressive force on the rock mass, shifting the stress state from tension or shear to multiaxial compression [2] . This compressive force significantly enhances the mechanical parameters of the rock, such as cohesion and the internal friction angle. When bolts are installed with an appropriate density, their residual compressive stress zones overlap, creating a continuous band around the roadway perimeter and forming a "Reinforcement Arch". This arch acts as a self-bearing structure, preventing the expansion of the plastic zone and preserving the integrity of the roadway [1] . Globally, the reinforcement arch theory has been extensively studied by numerous scholars, focusing on the concept of bolted rock mass stability within the surrounding stratab [3,4] . This study approaches the problem using a Mohr-Coulomb perfect plasticity model within a finite difference environment [5,6] . The selection of this model enables a realistic simulation of the plastic zone formation and stress redistribution processes under the influence of bolt prestressing force [7] . In Vietnam, numerous studies have demonstrated the effectiveness of prestressed rock bolts in replacing traditional steel sets. However, the majority of current research typically focuses on either ideal geological conditions (high-strength rock) or highly specific cases (such as weak roof strata within coal seams [1,8] .
Although the role of prestress has been widely recognized, determining the 'optimal' prestress level to form an effective reinforcement arch remains an open question under the specific conditions of the -230 m level cross-cut roadways at Mao Khe coal mine, where the rock mass possesses medium stability (f=4-6) and a lithological composition of interbedded sandstone and siltstone. Practical construction experience indicates that if the prestress is too low (< 20 kN), the reinforcement arch fails to connect continuously, leading to roof sagging or localized falls. Conversely, excessively high prestress (> 100 kN) results in extreme stress concentration at the bolt head, damaging the shotcrete layer and causing bolt failure at the threaded section. The lack of quantitative guidelines regarding the relationship between prestress and reinforcement arch thickness is a major barrier to design optimization [9] . While traditional calculation methods, such as those by Protodyakonov or Terzaghi, established the foundation for determining strata pressure, these approaches often treat the rock mass as a discrete medium and the support force as passive [10,11] . In the deep mining conditions at Mao Khe, relying solely on empirical formulas while ignoring the dynamic interaction between bolt prestress and the self-strengthening capacity of the rock mass (f=4-6) leads to inaccurate designs [1] . The current research gap lies in establishing a quantitative relationship between specific prestress values and the thickness of the Pre-stressed Reinforcement Arch to minimize costs while ensuring absolute safety. Based on the issues, this paper focuses on utilizing numerical simulation with FLAC3D software to quantitatively analyze the influence of different prestress levels on the formation of the reinforcement arch. The objectives of this research are: (1)To clarify the evolution of the plastic zone under the impact of various prestress levels.To determine the optimal prestressing force for sandstone with a stability coefficient of f=4-6; (2) To validate the results through in-situ monitoring data from the construction site; (3) The research findings not only contribute to refining the theoretical framework of the reinforcement arch but also offer high practical value in ensuring safety and reducing support costs for the Mao Khe coal mine in particular, and the Vietnamese underground coal mining industry in general.
Study Area
The direct object of this research is the Southwest I crosscut roadway at the -230 m level, part of the investment project for deep-level mining below -150 m at the Mao Khe coal mine. This is a vital roadway serving transportation and ventilation for the mine's Southwest sectors. The roadway features an arch-shaped design with an excavation crosssectional area of 9.5 m², a clear width of 3.4 m, and a height of 3.0 m. The lithological characteristics of this area are relatively complex, with interbedded sedimentary rock layers:Main composition: Primarily light gray sandstone, ranging from fine to medium-grained, interbedded with dark gray siltstone layers.Fracture state: The rock mass is moderately fractured; the fissures are often filled with weak argillaceous or silty materials, which reduces the continuity of the rock mass.Stability: The average stability coefficient (f) of the rock mass ranges from 4 to 6. This type of rock has medium strength but is susceptible to deformation and instability when subjected to strata pressure at great depths.At the -230 m level, the roadway is affected by in-situ stress caused by the weight of the overlying strata. With an average depth of 250 m to 300 m, the static pressure in this area is estimated at approximately 6.5-7.5 MPa. These pressure conditions, combined with the geomechanical properties of the rock (f = 4-6), make the roadway perimeter prone to the formation of a plastic zone (failure zone) if bolt prestress is not applied promptly to form an active reinforcement arch.To ensure the objectivity and reliability of the numerical model, the input parameters for the geomechanical properties of the sandstone (f = 4-6) at the -230 m level of Mao Khe mine were synthesized from field rock sample testing results and are presented in detail in Table 1.
| Parameters | Symbol | Unit | Value |
|---|---|---|---|
| Unit weight | ɤ | kN/m3 | 26.5 |
| Elastic modulus | E | GPa | 1.85 |
| Poisson's ratio | µ | 0.25 | |
| Cohesion | C | MPa | 1.25 |
| Internal friction angle | ϕ | Degree | 32 |
| Uniaxial compressive strength | σC | MPa | 45.0 |
| Tensile strength | σt | MPa | 1.20 |
Table text extracted from the original PDF; superscript letters are shown inline. The original table image is below.
View original table image
Methodology
This study combines theoretical rock mechanics with modern numerical simulation methods to quantitatively analyze the formation of the reinforcement arch.
Theoretical basis of the reinforcement arch
Based on the perspectives of international scholars and research in Vietnam, the methodology is founded on the following hypothesis: When a rock bolt is prestressed, it generates a residual compressive stress zone within the rock mass. If the bolt spacing (a) and bolt length (L) are designed appropriately, these compressive zones will overlap. The thickness of the reinforcement arch (hv) is determined by the intersection of these compressive stress zones, creating a closed arch-like structure capable of bearing strata loads transmitted from the surrounding rock mass.
FLAC3D numerical simulation method
To quantify the impact of prestress, the study employs FLAC3D (Fast Lagrangian Analysis of Continua in 3 Dimensions) software. This is a specialized program based on the finite difference method, allowing for the accurate simulation of the plastic deformation and failure processes of the rock mass.
Numerical Model Setup Model dimensions:
The model is established with dimensions of 50 m × 50 m × 1 m (length × height × thickness) to eliminate the influence of boundary effects. Element meshing: The rock mass is divided into zones (solid elements). The area surrounding the roadway is refined with a finer mesh to observe the stress variations and the failure zone in detail. Boundary conditions: Horizontal displacements are restricted at the lateral sides (roller boundaries), and the bottom of the model is fully fixed (fixed boundary).
Based on actual field parameters, the numerical model is established with the roadway cross-section and the layout of support elements (bolts, shotcrete) as described in Figure 1.
Constitutive models and support elementsrock mass
The Mohr-Coulomb perfect plasticity model is utilized, with geomechanical parameters specified in Table 1.Support elements: Cable elements are employed to simulate the rock bolts. The specifications include D20 steel bolts with a length of 2.2 m, and a grid spacing (both row spacing and bolt spacing within a row) of 0.8 m × 0.8 m.Prestressing force (Pt): This is assigned to the cable elements immediately upon installation in the model, accurately simulating the hydraulic tensioning process applied at the Mao Khe mine site.
Simulation Procedure
The simulation process is conducted through four main steps to closely replicate actual construction practices:
Evaluation Criteria
To evaluate the formation of the reinforcement arch, the following indicators are extracted from the model: Axial compressive stress distribution along the bolt: To determine the overlap between compression zones.
Plastic zone dimensions:
To evaluate the extent of failure zone reduction as prestress increases.
Roof and sidewall displacement: To quantify the deformation control effectiveness of the reinforcement arch.
Results and Discussion
Results and Discussion
Influence of Prestressing Force
When the prestressing force varies in the case of a single rock bolt installed in the roof, the distribution of the reinforced compressive stress in the roof is illustrated in Figure 2.
The following observations are drawn from the analysis of Figure 2:
As the prestressing force varies, the distribution pattern of stress along the bolt within the rock mass remains consistent, following a specific rule: stress concentration reaches its peak at the bolt tail (at the roadway perimeter); subsequently, the compressive stress gradually diminishes with depth into the rock mass. At a depth of approximately 3/4 of the bolt length from the perimeter, the stress decreases to zero and transitions into a tensile stress zone toward the bolt head (the deeper part of the rock mass).
As the prestress increases, both the magnitude and the extent of the reinforced compressive stress zone increase accordingly. Furthermore, the transition zone where the stress value is approximately zero between the compressive and tensile regions tends to narrow, indicating an enhanced efficiency in rock mass reinforcement by the bolting system. Figure 4 and Figure 5 demonstrate that with a 5-bolt reinforcement pattern, the mutual interaction between compressive stress zones effectively binds the rock mass into a cohesive, load-bearing reinforcing arch. Specifically, at a pre-stress level of 20 kN, the compressive stress in the arch is only 0.02 MPa, whereas at 120 kN, it increases to 0.12 MPa.When the pre-stress is set at 20 kN, compressive stress zones ≥ 0.04 MPa appear in isolation with very limited coverage, failing to interact between adjacent bolts. In this state, large areas of low stress predominate, preventing the formation of a continuous reinforcing zone. However, as the pre-stress increases to 120 kN, these highcompression zones expand and fill the gaps between bolts, interconnecting to establish a solid reinforcing arch. Furthermore, the boundary compressive stress between bolts increases from 0.005 MPa to 0.02 MPa, significantly enhancing the stability of the tunnel periphery. Increasing the bolt pre-stress effectively expands both the thickness and width of the reinforcing arch beyond the tunnel span, which is highly beneficial for maintaining the long-term stability of the underground opening.
Analysis of tunnel peripheral displacement
The effectiveness of the reinforcing arch is specifically quantified through the changes in roof and rib displacements. The observed rate of convergence reduction also followed the same trend as the simulation, indicating that the reinforcement arch had formed continuously around the roadway. Complementing displacement measurements, on-site pull-out tests demonstrated an average bond strength of 52.8 kN, aligning with the optimal prestressing range derived from the simulation. This confirms that the bolt-grout-rock interface could effectively transfer prestress without slippage, ensuring that the reinforcement mechanism functioned as theorized.
Long-term observation showed no cracking or deterioration in the shotcrete layer, nor any loss of prestress or signs of localized rock failure, confirming that the reinforcement arch remained stable throughout the monitoring period. The consistency among numerical predictions, deformation measurements, and pull-out test results provides strong evidence that a prestressing force of about 60 kN is both technically effective and structurally safe. Overall, the field validation confirms that the simulation accurately reflects real ground behavior and that the prestressed bolting system successfully establishes a stable reinforcement arch within the geological conditions of the Mao Khe mine.
Figures and tables from the paper
References
12 in the original paper- Huynh DX. Research and propose a combination of anchor-steel mesh-sprayed concrete support for application to support ventilation cross-seam tunnels at level -230 in f=4-6 rock in the vertical shaft project of Mao Khe Coal Company. University-level scientific research project. 2024.
- Yu P, et al. Cracking characteristics of rock-anchored beam system during construction of underground powerhouse under high in-situ stress and complex rock mass structures: a case study of Yebatan hydropower station. Tunnelling and Underground Space Technology. 2026;172:107506.
- Gerrard C. Rock bolting in theory: a keynote lecture. In: Rock bolting: theory and application in mining and underground construction. Routledge; 2021. p.3-32.
- Li Z, Li X. Research on surrounding rock-composite arch coupling support models considering pretightening force strengthening coefficients. Frontiers in Earth Science. 2025;13:1719406.
- Rajabi M. Effects of constitutive model on the stability analysis of roadway tunnels of coal mines. University of Wollongong; 2020.
- Puerta Mejia AF. Geological-material model complexity level and excavation sequencing on numerical modelling of progressive failure in deep open-pit slopes: a case study in a porphyry deposit mine. 2024.
- Li Q, et al. Research findings on the application of the arch structure model in coal mining: a review. Sustainability. 2022;14(22):14714.
- Huynh DX, Thanh PQ. Assessment of roadway stability supported by a bolt-mesh-shotcrete system at the Mao Khe vertical shaft project. Journal of Science and Technology QUI. 2025;4:6-13.
- Yuan Z, et al. Research on the barrier analysis and strength measurement of a prefabricated building design. Sustainability. 2020;12(7):2994.
- Tan Y, Wang Q. Study on the applicability of load calculation method for large-diameter shield tunnel in argillaceous sandstone stratum under high water pressure. KSCE Journal of Civil Engineering. 2023;27(12):5401-5416.
- Zhu H, Shi L. Application of typical engineering. In: Methodology of highway engineering structural design and construction. Springer; 2020. p.73-231.
- Standard N. TCVN 10568:2017. Technical requirements -high-strength cable bolt sets T13, T15 and D13, D15. 2017.