
Research article · 2025 · Full text
International Journal of Geography Geology and EnvironmentImpact of sea level rise on coastal wetland ecosystems in the Ganges-Brahmaputra delta
Volume 7(2) · Pages 66–69 · DOI: 10.22271/27067483.2025.v7.i2a.570 ↗
Research areasCoastal wetland ecosystem dynamicsCoastal and Marine DynamicsWetland Management and Conservation
Abstract
Author-writtenHow vulnerable are coastal wetland ecosystems when sea levels rise faster than sediment accretion can offset? This research examined sea level rise effects on wetland ecosystems across the Ganges-Brahmaputra Delta (GBD) between 2005 and 2023, focusing on vegetation shifts, salinity changes, and habitat loss. The research area covered five sub-regions spanning roughly 26,000 km² of tidal wetlands and mangrove forests. Satellite imagery from Landsat 7 and 8, combined with field salinity measurements, tidal gauge records, and vegetation transect data, formed the basis of this investigation. Results showed wetland area declined by 13.7% over the observation period, with the Meghna Estuary recording the highest loss at 22.7%. Mean salinity rose from 2.1 ppt in 2000 to 9.8 ppt by 2023, coinciding with cumulative sea level increase of 13.1 mm. Mangrove species composition shifted toward salt-tolerant taxa, and freshwater-dependent species retreated inland by an average of 4.3 km. A strong positive correlation (r = 0.91, p < 0.001) was found between sea level rise and salinity intrusion depth. Sediment supply reduction from upstream damming worsened the problem, as vertical accretion rates dropped to 2.8 mm/yr against relative sea level rise of 5.6 mm/yr.
Summary
Source-checkedPlain-language reading of the full paper, prepared with AI and checked against the text. Each point links to the authors' own words.
Why it matters
- The Ganges-Brahmaputra Delta (GBD) is a critical region spanning approximately 100,000 km² that supports more than 150 million people and contains one of the world's largest mangrove systems. View evidence ↗
- Wetlands in the GBD provide essential ecological services, including acting as fish nurseries, protecting against cyclones, and sequestering about 4.1 tonnes of carbon per hectare each year. View evidence ↗
- Sea level rise poses a threat to the region by increasing inland tidal inundation and saltwater penetration, which alters soil chemistry and forces freshwater plants to move to higher ground. View evidence ↗
The question
- The study aimed to investigate how sea level rise affected salinity, vegetation composition, and the overall extent of wetlands across five sub-regions of the GBD between 2005 and 2023. View evidence ↗
What they did
- The study focused on five sub-regions of the delta, covering approximately 26,000 km² of mangrove forests and tidal wetlands. View evidence ↗
- Researchers used Landsat 7 and 8 satellite imagery processed via a Maximum Likelihood supervised classification algorithm, supplemented by tidal gauge records, field salinity measurements, and vegetation transects. View evidence ↗
- Field data collection included salinity measurements at 148 stations and the recording of canopy height, density, and species composition across 36 vegetation transects measuring 50 m by 10 m. View evidence ↗
What they found
- Between 2005 and 2023, the total wetland area across the five studied sub-regions decreased by 2,721 km², representing an overall loss of 13.7%. View evidence ↗
- The Meghna Estuary experienced the most significant decline, losing 22.7% of its area at a rate of 41.4 km² per year. View evidence ↗
- From 2000 to 2023, mean salinity increased from 2.1 ppt to 9.8 ppt, which occurred alongside a cumulative sea level rise of 13.1 mm. View evidence ↗
- There was a strong positive correlation (r = 0.91, p < 0.001) between the rise in sea levels and the increase in salinity intrusion. View evidence ↗
- Vegetation shifted as salt-tolerant mangrove species expanded and freshwater-dependent species moved inland by an average of 4.3 km. View evidence ↗
- Upstream damming reduced sediment supply, causing vertical accretion rates (2.8 mm/yr) to fall below the relative sea level rise (5.6 mm/yr). View evidence ↗
- Wetland loss accelerated over time, with losses between 2015 and 2020 being 34% to 68% higher than those observed between 2005 and 2010. View evidence ↗
What it means
- The authors recommend implementing sediment policies that include controlled dam releases during monsoon peaks and creating local conservation buffer zones to protect vulnerable wetlands. View evidence ↗
- The authors suggest that future assessments would benefit from increased observation frequency through community-based monitoring involving local fishers. View evidence ↗
Visual summary
3 visualsIllustrations explain the paper; charts are replotted from the paper's own table values.
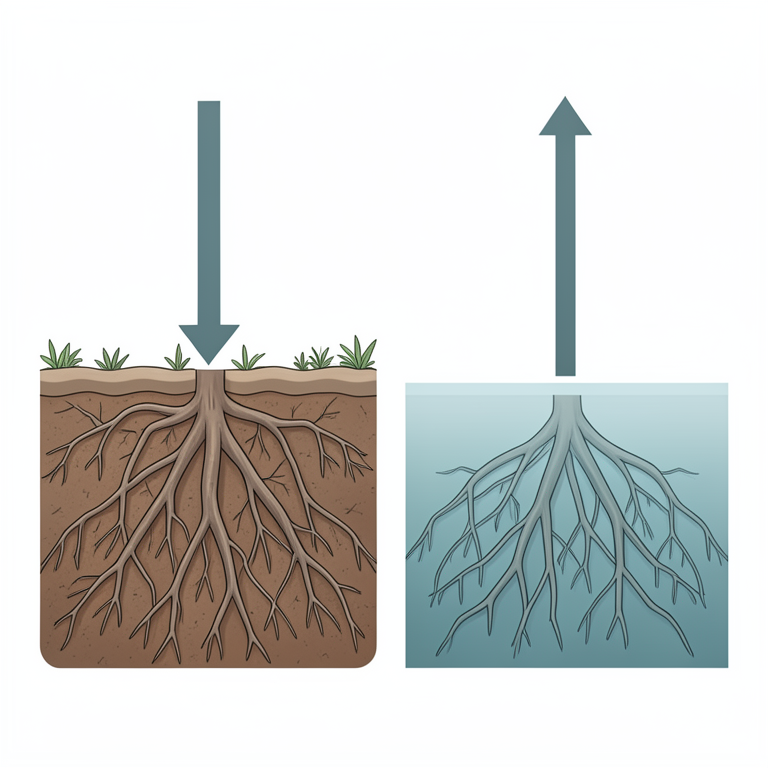
Sediment Accretion vs. Sea Level Rise
AI-generated conceptual illustration (mangrove forests in the Ganges-Brahmaputra delta). It explains the idea and does not show study data.
View source evidence ↗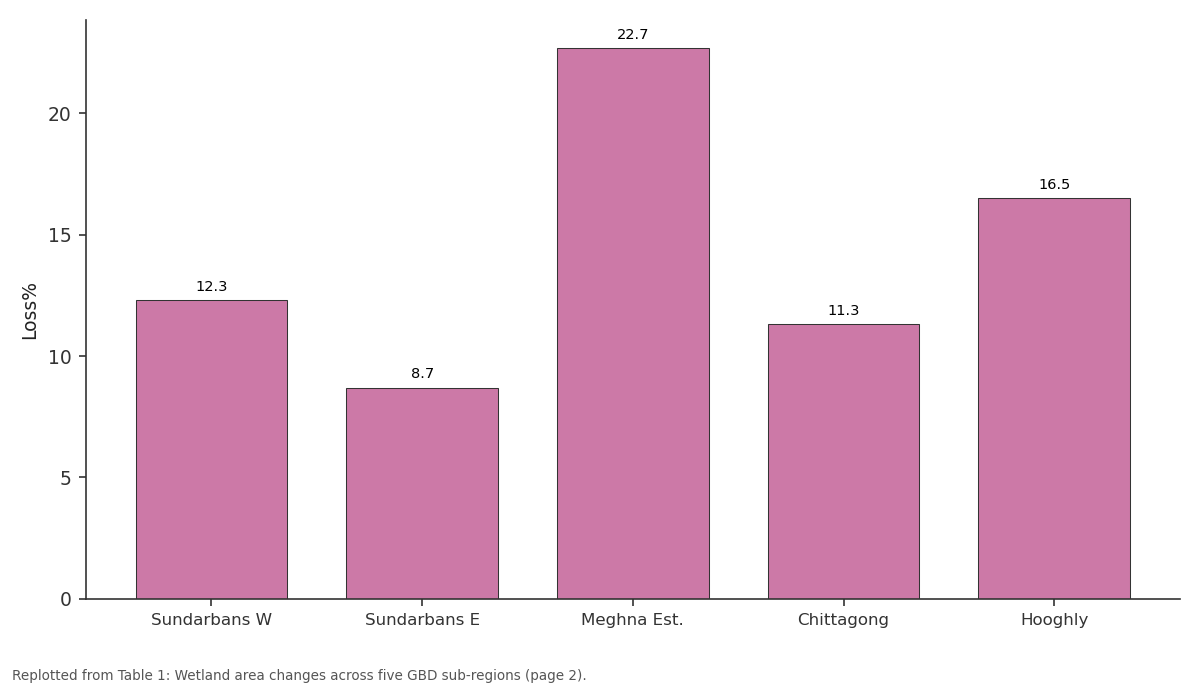
Loss%: Sundarbans W vs Sundarbans E vs Meghna Est. vs Chittagong vs Hooghly
Replotted from Table 1 (page 2) of the original paper. Every bar is the paper's own table value.
View source evidence ↗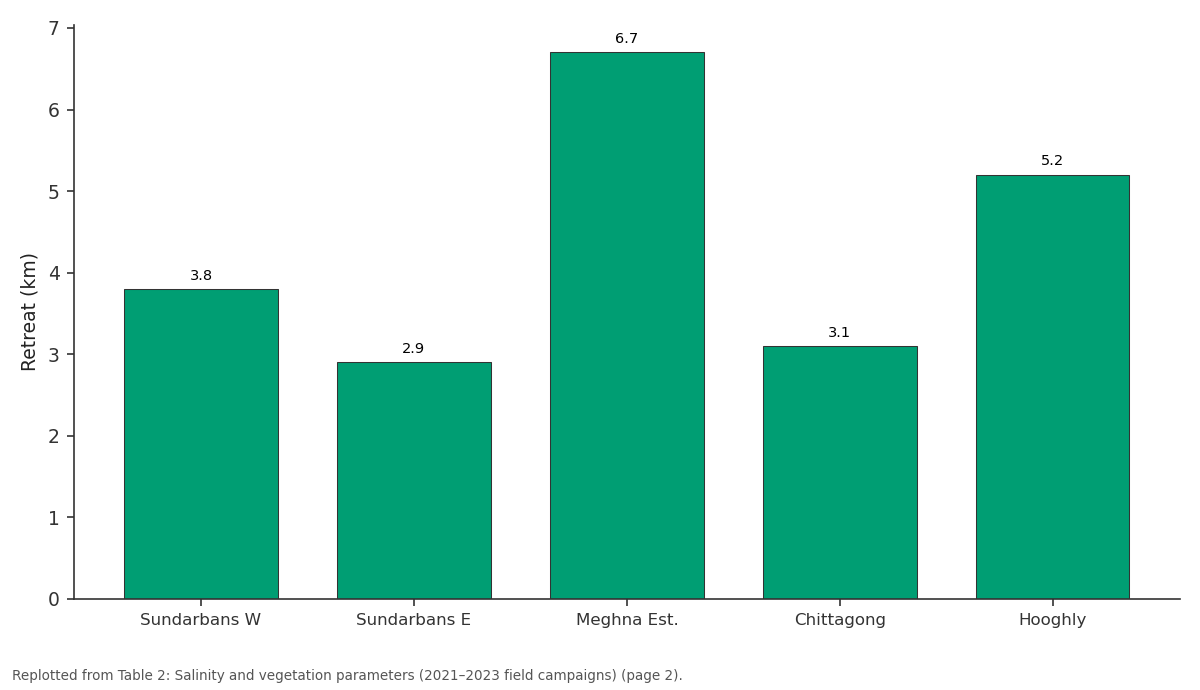
Retreat (km): Sundarbans W vs Sundarbans E vs Meghna Est. vs Chittagong vs Hooghly
Replotted from Table 2 (page 2) of the original paper. Every bar is the paper's own table value.
View source evidence ↗Figures & tables
From the original paper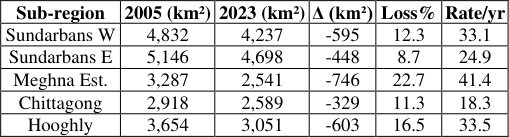 Table 1
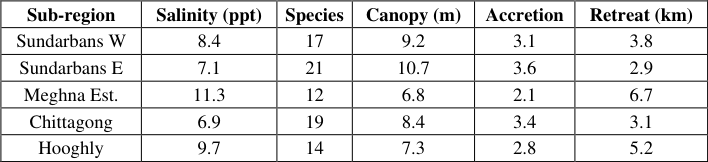 Table 2
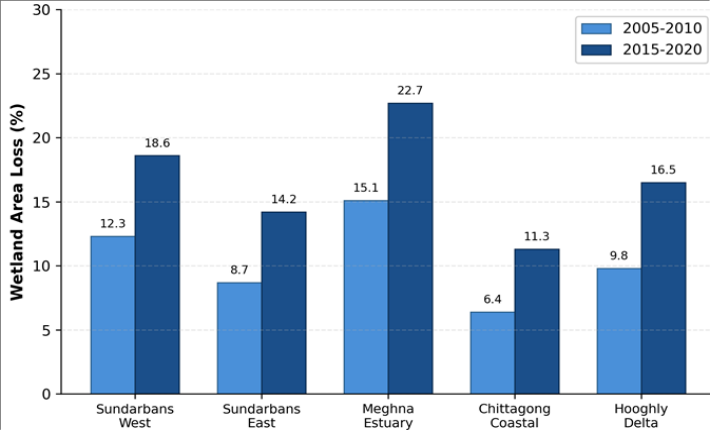 Figure 1
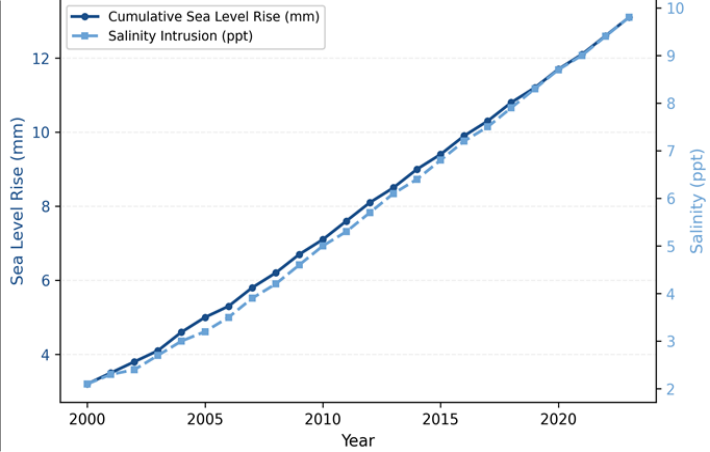 Figure 2
Introduction
What happens to a delta ecosystem when the ocean rises faster than the land can keep up? This question sits at the heart of coastal ecology research, and nowhere is it more pressing than in the Ganges-Brahmaputra Delta [1] . Spanning roughly 100,000 km² across Bangladesh and eastern India, the GBD supports over 150 million people and hosts one of the largest mangrove systems on the planet [2] . Sea level rise threatens this region through tidal inundation extending further inland, saltwater penetration altering soil chemistry and pushing freshwater vegetation toward higher ground, and the combined effects of subsidence, reduced sediment delivery, and thermal expansion creating relative sea level rise far exceeding global averages [3,4,5] . Earlier research measured sea level changes in the Bay of Bengal at 3.0 to 5.2 mm/yr [6] , but few investigations linked these to ecological changes across the delta's wetlands. Some researchers focused on mangrove loss in the Sundarbans [7] , while others tracked salinity trends in agricultural zones [8] . A gap remained in connecting oceanographic changes to biological responses across multiple wetland types. The GBD wetlands serve as nursery grounds for fish species, buffer zones against cyclone damage, and carbon sinks storing roughly 4.1 tonnes of carbon per hectare annually [9,10] . Upstream dams trap sediment that would otherwise nourish the delta surface [11] . This research addressed these gaps by examining sea level rise effects on wetland extent, vegetation composition, and salinity across five GBD sub-regions from 2005 to 2023.
Study Area Description
The research focused on five GBD sub-regions between 21°30'N-23°45'N and 88°00'E-92°00'E: Sundarbans West, Sundarbans East, Meghna Estuary, Chittagong Coastal Zone, and Hooghly Delta. The delta sits on Holocene alluvial sediments deposited over 7,000 years [12] . Tidal range varies from 2.5 m in the western Sundarbans to 5.8 m near the Meghna Estuary, and elevation rarely exceeds 3 m above mean sea level. Dominant vegetation includes Avicennia alba, Sonneratia apetala, and Heritiera fomes in mangrove zones, with Phragmites karka in freshwater marshes.
Climatic and Environmental Conditions
The GBD experiences tropical monsoon climate with premonsoon (March-May), monsoon (June-September), and post-monsoon (October-February) seasons. Annual rainfall ranges from 1,500 mm in the west to 3,200 mm near the Meghna Estuary. Mean annual temperatures ranged from 25.4°C to 27.8°C during the research period. Severe cyclones Sidr (2007), Aila (2009), and Amphan (2020) caused widespread wetland damage. Ganges monsoon discharge averaged 38,000 m³/s with interannual variability up to 28%.
Materials and Methods
Materials and Methods
Materials
Materials
Methods
Wetland mapping used supervised classification with the Maximum Likelihood algorithm in ERDAS Imagine 2020. Training sites were selected from field verification during four seasonal campaigns (pre-monsoon and post-monsoon 2021-2022). Classes included dense mangrove, sparse mangrove, freshwater marsh, tidal mudflat, open water, and non-wetland. Overall accuracy reached 87.3% with kappa of 0.84. Salinity was measured at 148 stations during both tidal phases across four rounds. Sea level trends were analysed using linear regression on monthly mean water levels corrected for subsidence from InSAR data [13] . Vegetation transects (50 m × 10 m) at 36 sites recorded species composition, density, and canopy height. Correlation analysis used Pearson's r (p < 0.05) in R 4.2.1.
Results
Results
Comprehensive Interpretation
Wetland area across the five sub-regions declined by 2,721 km² between 2005 and 2023, a 13.7% overall loss (Table 1). The Meghna Estuary showed the steepest decline at 22.7%, losing cover at 41.4 km²/yr. This sub-region also recorded the highest salinity (11.3 ppt) and lowest accretion rate (2.1 mm/yr), suggesting high tidal energy combined with low sediment supply accelerates erosion. The bar chart (Figure 1) reveals loss acceleration, with 2015-2020 losses 34-68% higher than 2005-2010. Sea level and salinity showed a clear co-increasing trend (Figure 2) with r = 0.91 (p < 0.001). Species richness dropped sharply where salinity exceeded 10 ppt. Freshwater species retreated 2.9-6.7 km inland while salt-tolerant species expanded. Canopy height correlated negatively with salinity (r = -0.78, p < 0.01).
| Sub-region | 2005 (km²) | 2023 (km²) | Δ (km²) | Loss% | Rate/yr |
|---|---|---|---|---|---|
| Sundarbans W | 4,832 | 4,237 | -595 | 12.3 | 33.1 |
| Sundarbans E | 5,146 | 4,698 | -448 | 8.7 | 24.9 |
| Meghna Est. | 3,287 | 2,541 | -746 | 22.7 | 41.4 |
| Chittagong | 2,918 | 2,589 | -329 | 11.3 | 18.3 |
| Hooghly | 3,654 | 3,051 | -603 | 16.5 | 33.5 |
Table text extracted from the original PDF; superscript letters are shown inline. The original table image is below.
View original table image
Discussion
The observed 13.7% wetland loss over 18 years aligns with earlier predictions for individual delta sections [1,6] . The spatial pattern of loss appears linked to local differences in sediment supply and tidal energy rather than sea level rise alone. The Meghna Estuary, receiving less upstream sediment compared to the Sundarbans, lost area at nearly twice the rate of better-nourished sub-regions. This sediment deficit connects to upstream dam construction. Rahman and colleagues [11] estimated that sediment delivery fell by 31% between 1990 and 2015, and our accretion data support that finding. Where vertical accretion drops below relative sea level rise-as in three of five sub-regions-the wetland surface sinks below thresholds for vegetation survival [14] . The salinity-driven vegetation shift matches patterns from other deltas, including the Mississippi [3] , but the GBD case is more severe because subsidence rates here reach 2.5-8.0 mm/yr. If the 2015-2020 loss rate continues, several sub-regions could lose over 30% of remaining wetland within 15 years-shorter than most policy documents assume [15] . The strong sea level-salinity correlation means even modest future acceleration in global sea level will push thresholds past tolerance limits of additional species.
Conclusion
This research showed that GBD coastal wetlands lost 13.7%
Acknowledgement
Acknowledgements Funding SourcesThe authors acknowledge financial support from institutional research funds for environmental monitoring and coastal ecology research.
Figures and tables from the paper
| Sub-region | Salinity (ppt) | Species | Canopy (m) | Accretion | Retreat (km) |
|---|---|---|---|---|---|
| Sundarbans W | 8.4 | 17 | 9.2 | 3.1 | 3.8 |
| Sundarbans E | 7.1 | 21 | 10.7 | 3.6 | 2.9 |
| Meghna Est. | 11.3 | 12 | 6.8 | 2.1 | 6.7 |
| Chittagong | 6.9 | 19 | 8.4 | 3.4 | 3.1 |
| Hooghly | 9.7 | 14 | 7.3 | 2.8 | 5.2 |
Table text extracted from the original PDF; superscript letters are shown inline. The original table image is below.
View original table image
References
16 in the original paper- Ericson JP, Vorosmarty CJ, Dingman SL, Ward LG, Meybeck M. Effective sea-level rise and deltas: causes of change and human dimension implications. Global and Planetary Change. 2006;50(1-2):63-82.
- Goodbred SL, Kuehl SA. The significance of large sediment supply, active tectonism, and eustasy on margin sequence development. Sedimentary Geology. 2000;133(3-4):227-248.
- Stagg CL, Schoolmaster DR, Piazza SC, Snedden G, Steyer GD. A landscape-scale assessment of primary production in coastal wetlands. Ecosystems. 2017;20(3):436-449.
- Dasgupta S, Huq M, Khan ZH, Ahmed MMZ. Cyclones in a changing climate: the case of Bangladesh. Climate and Development. 2014;6(2):96-110.
- Brown S, Nicholls RJ. Subsidence and human influences in mega deltas. Science of the Total Environment. 2015;527-528:362-374.
- Brammer H. Bangladesh's dynamic coastal regions and sea-level rise. Climate Risk Management. 2014;1:5162.
- Ghosh MK, Kumar L, Roy C. Mapping long-term changes in mangrove species in the Sundarbans. Forests. 2016;7(12):305.
- Rabbani G, Rahman A, Mainuddin K. Salinity-induced loss and damage to farming households in coastal Bangladesh. International Journal of Global Warming. 2013;5(4):400-415.
- Donato DC, Kauffman JB, Murdiyarso D, Kurnianto S. Mangroves among the most carbon-rich forests in the tropics. Nature Geoscience. 2011;4(5):293-297.
- Alongi DM. Carbon cycling and storage in mangrove forests. Annual Review of Marine Science. 2014;6:195219.
- Rahman M, Dustegir M, Karim R, Haque A, Nicholls RJ. Recent sediment flux to the Ganges-BrahmaputraMeghna delta system. Science of the Total Environment. 2018;643:1054-1064.
- Allison MA, Khan SR, Goodbred SL, Kuehl SA. Stratigraphic evolution of the late Holocene GangesBrahmaputra lower delta plain. Sedimentary Geology. 2003;155(3-4):317-342.
- Higgins SA, Overeem I, Steckler MS, Syvitski JPM. InSAR measurements of compaction and subsidence in the Ganges-Brahmaputra Delta. Journal of Geophysical Research: Earth Surface. 2014;119(8):1768-1781.
- Kirwan ML, Megonigal JP. Tidal wetland stability in the face of human impacts and sea-level rise. Nature. 2013;504(7478):53-60.
- Spencer T, Schuerch M, Nicholls RJ, Hinkel J. Global coastal wetland change under sea-level rise. Global and Planetary Change. 2016;139:15-30.
- Sarwar MGM, Woodroffe CD. Rates of shoreline change along the coast of Bangladesh. Journal of Coastal Conservation. 2013;17(3):515-526.