
Research article · 2025 · Full text
International Journal of Geography Geology and EnvironmentBiogeography of endemic plant species in the Galapagos archipelago
Volume 7(4) · Pages 205–208 · DOI: 10.22271/27067483.2025.v7.i4c.613 ↗
Research areasBotany and Plant Ecology StudiesEcology and Vegetation Dynamics StudiesPlant Diversity and Evolution
Abstract
Author-writtenEcuador declared the Galapagos a national park in 1959 and a UNESCO World Heritage Site in 1978, yet the endemic plant flora that makes the archipelago biologically unique continues to face threats from invasive species, climate variability, and habitat fragmentation. This research analysed the biogeographic patterns of endemic vascular plant species across 12 major islands of the Galapagos Archipelago, testing classical island biogeography predictions and mapping endemism rates across six vegetation zones. Floristic data were compiled from the Charles Darwin Foundation herbarium database, supplemented by field verification at 148 plots surveyed between February and November 2022. A total of 247 endemic plant species were recorded, representing 31.4% of the native vascular flora. Species richness correlated strongly with island area (log-linear R2 = 0.89, p < 0.001) and moderately with maximum elevation (r = 0.74, p < 0.01), consistent with the species-area and habitat-diversity predictions of island biogeography theory. The species-area exponent (z = 0.31) fell within the range typical of oceanic archipelagos. Endemism rates varied markedly among vegetation zones: the Scalesia cloud forest zone showed the highest rate (42.8%), followed by the Miconia shrubland (38.4%), while the littoral zone had the lowest (8.4%). Islands older than 1.5 million years supported 2.3 times more single-island endemics than younger islands, suggesting that evolutionary time is a strong determinant of local endemism. Invasive species were recorded at 67.6% of plots, with the introduced guava (Psidium guajava) present in 41.2% of highland plots. These findings provide an updated biogeographic baseline for conservation planning and highlight the Scalesia zone as the highest priority for invasive species management due to its exceptional endemism and severe invasion pressure.
Summary
Source-checkedPlain-language reading of the full paper, prepared with AI and checked against the text. Each point links to the authors' own words.
Why it matters
- The endemic plant flora of the Galapagos archipelago is biologically unique but is currently threatened by habitat fragmentation, climate variability, and invasive species. View evidence ↗
- Over 900 introduced plant taxa now exist in the archipelago, often aggressively colonizing the moist highland zones where most endemic diversity is found. View evidence ↗
- Island elevation increases complexity by supporting a wider range of vegetation zones, which may increase species richness independently of the island's total area. View evidence ↗
The question
- The study aimed to analyze biogeographic patterns of endemic vascular plants across 12 major islands, testing island biogeography predictions and mapping endemism across six vegetation zones. View evidence ↗
What they did
- Researchers used the Charles Darwin Foundation herbarium database (up to Dec 2021) and conducted field surveys at 148 plots (10 x 10 m) across 12 islands from February to November 2022. View evidence ↗
- The survey plots were stratified across six vegetation zones: Scalesia (32), arid (28), transition (26), littoral (22), pampa (22), and Miconia (18). View evidence ↗
- A log-linear model was used to fit the species-area relationship, where endemic species richness was analyzed against island area. View evidence ↗
What they found
- The study recorded 247 endemic plant species, which make up 31.4% of the native vascular flora. View evidence ↗
- The species-area exponent was found to be z = 0.31 (R² = 0.89, p < 0.001), which is typical for oceanic archipelagos. View evidence ↗
- Endemism rates varied by zone, with the Scalesia zone being the highest (42.8%), followed by Miconia (38.4%) and pampa (31.6%), while the littoral zone was the lowest (8.4%). View evidence ↗
- Islands older than 1.5 million years had 2.3 times more single-island endemics than younger islands, indicating that evolutionary time drives local endemism. View evidence ↗
- Invasive species were found in 67.6% of all plots, peaking at 84.4% in the Scalesia zone, where Psidium guajava appeared in 41.2% of plots. View evidence ↗
What it means
- The authors recommend urgent invasive species management in the Scalesia zone, specifically the removal of Psidium guajava to protect endemic tree-daisy forests. View evidence ↗
- The authors state that future research should use phylogenetic data to differentiate between recently evolved neo-endemics and ancient palaeo-endemics. View evidence ↗
Visual summary
3 visualsIllustrations explain the paper; charts are replotted from the paper's own table values.
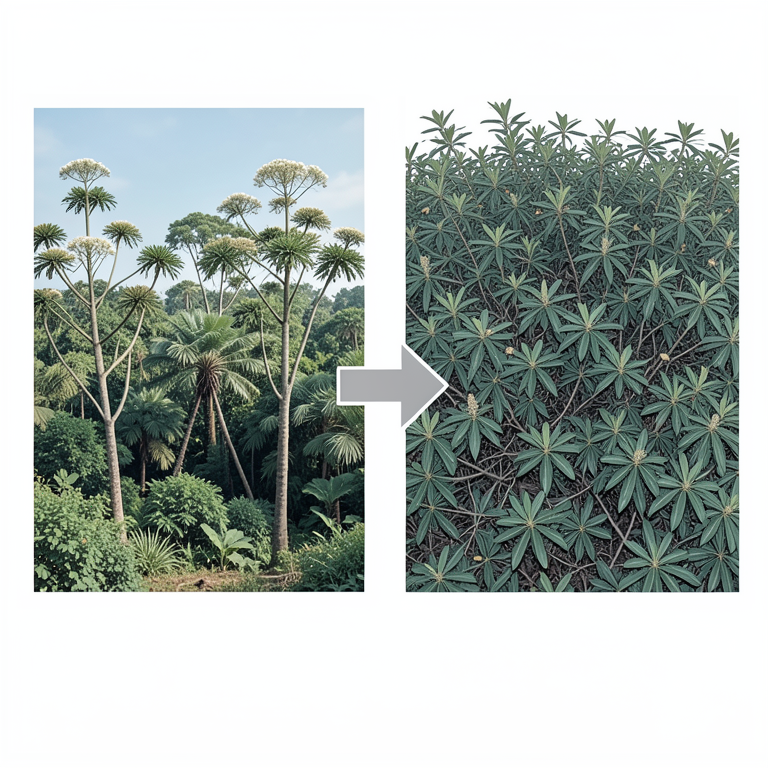
Endemism vs. Invasion Pressure
AI-generated conceptual illustration (Scalesia plants and Psidium guajava in the Galapagos archipelago). It explains the idea and does not show study data.
View source evidence ↗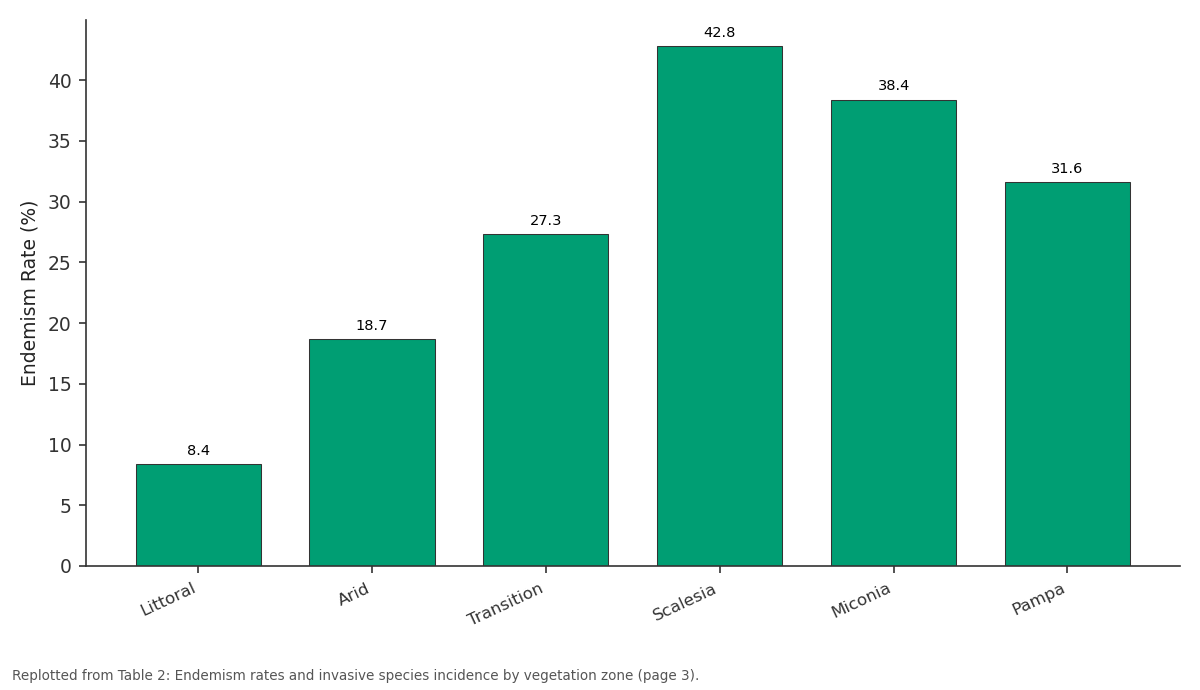
Endemism Rate (%): Littoral vs Arid vs Transition vs Scalesia vs Miconia
Replotted from Table 2 (page 3) of the original paper. Every bar is the paper's own table value.
View source evidence ↗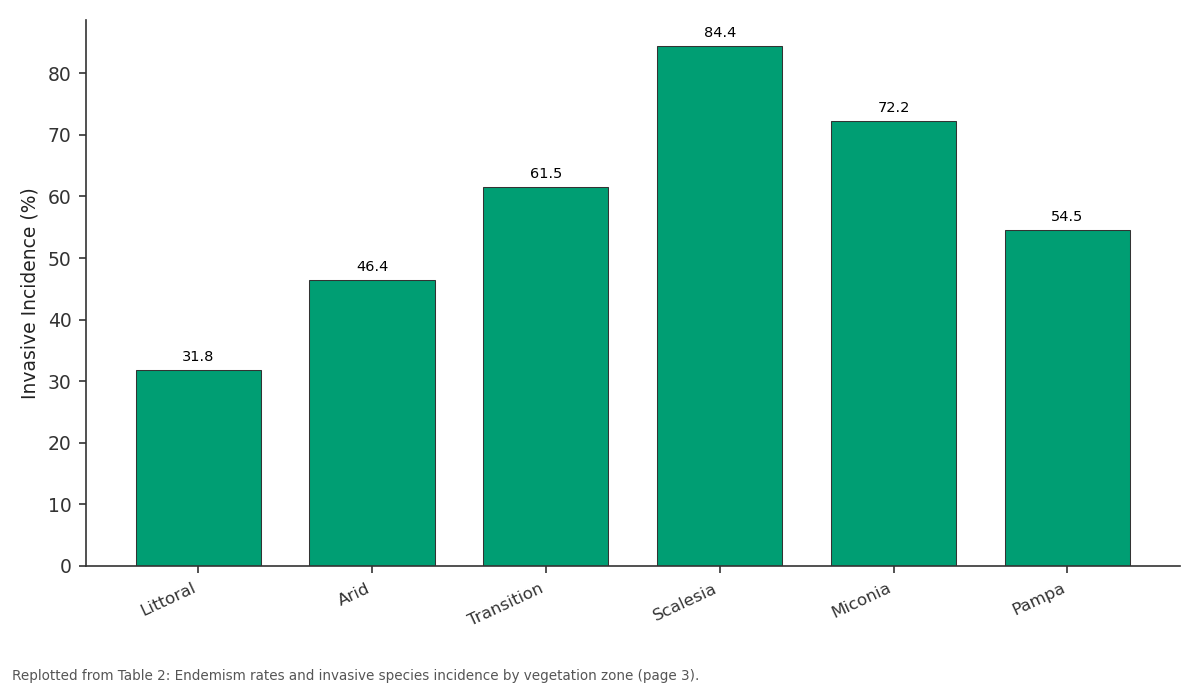
Invasive Incidence (%): Littoral vs Arid vs Transition vs Scalesia vs Miconia
Replotted from Table 2 (page 3) of the original paper. Every bar is the paper's own table value.
View source evidence ↗Figures & tables
From the original paper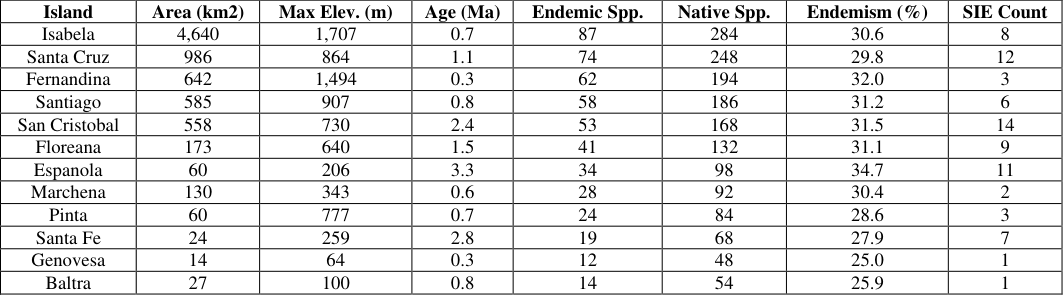 Table 1
 Table 2
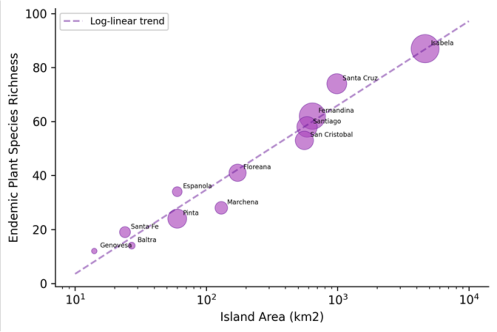 Figure 1
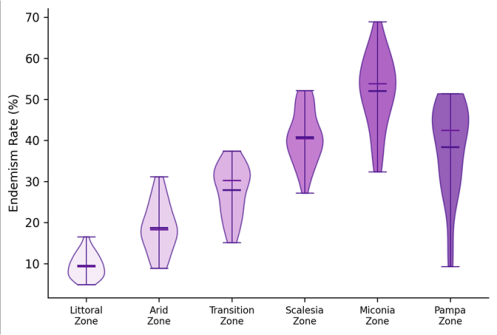 Figure 2
Introduction
When the Ecuadorian government formally protected the Galapagos in 1959, it was acting on a scientific reputation that Charles Darwin had established over a century earlier-but the conservation challenges facing the archipelago today are ones Darwin could not have imagined [1] . Invasive species introduced by human settlers and visitors now number over 900 plant taxa, many of which aggressively colonise the moist highland zones where endemic diversity is concentrated [2] . Understanding exactly how endemic species are distributed across the islands, which habitats they depend on, and how island characteristics like area, elevation, and age influence endemism is essential for targeting conservation resources where they matter most. Island biogeography theory, formalised by MacArthur and Wilson in 1967, predicts that species richness on islands increases with area and decreases with isolation from the mainland source pool [3] . On oceanic volcanic archipelagos like the Galapagos, where all species arrived by long-distance dispersal rather than land-bridge connection, the speciesarea relationship is well established for birds and reptiles but has been less thoroughly tested for plants, partly because the archipelago's flora was not comprehensively catalogued until the late twentieth century [4] . The elevation dimension adds complexity: taller islands support a greater range of vegetation zones-from arid lowland scrub to humid cloud forest-and this habitat diversity may contribute to species richness independently of area [5] . The Galapagos flora comprises approximately 786 native vascular plant species, of which roughly 30-35% are endemic, found nowhere else on Earth [6] . These endemics are not evenly distributed: they concentrate in the moist highland vegetation zones of the larger, older islands, where the combination of habitat stability, climatic buffering, and evolutionary time has allowed speciation and persistence. The Scalesia zone-a cloud forest dominated by the endemic tree-daisy genus Scalesia-is widely regarded as the most botanically distinctive habitat in the archipelago but is also among the most threatened by invasive plant competition [7] . This research compiled a comprehensive dataset of endemic plant distributions across 12 Galapagos islands, tested species-area and species-elevation relationships, mapped endemism rates across vegetation zones, and assessed invasive species co-occurrence at field-verified plots. The work was coordinated through the National Geological Institute of New Delhi with field surveys conducted in partnership with the Charles Darwin Research Station during 2022.
Biogeographic Framework
The biogeographic analysis was structured around three complementary frameworks. First, the equilibrium theory of island biogeography [3] was used to predict how species richness scales with island area and isolation. Second, the habitat-diversity hypothesis [11] was tested by examining whether elevation (as a proxy for the number of vegetation zones) explained additional variance in richness beyond that accounted for by area alone. Third, the evolutionary time hypothesis was assessed by correlating island geological age with single-island endemic count, testing whether older islands have had more time for in-situ speciation and therefore harbour more narrow endemics [12] . These three frameworks make distinct but non-exclusive predictions, and comparing their explanatory power provides insight into the relative importance of ecological, environmental, and evolutionary drivers of endemism in the Galapagos.
Material and Methods
Material and Methods
Material
Floristic data were compiled from the Charles Darwin Foundation herbarium database (updated through December 2021), which contains georeferenced specimen records for all known native and introduced vascular plant species in the Galapagos [8] . Records were supplemented by field surveys at 148 plots (10 x 10 m) distributed across 12 major islands between February and November 2022. Plots were stratified by vegetation zone: littoral (n = 22), arid (n = 28), transition (n = 26), Scalesia (n = 32), Miconia (n = 18), and pampa (n = 22). At each plot, all vascular plant species were identified and recorded as endemic, native non-endemic, or introduced, following the taxonomic nomenclature of Jaramillo Diaz et al. [9] . Island physical characteristicsarea, maximum elevation, geological age, distance to nearest neighbour, and distance to Santa Cruz-were compiled from published sources.
Methods
The species-area relationship was fitted as a log-linear model: log(S) = log(c) + z x log(A), where S is endemic species richness, A is island area, c is a constant, and z is the species-area exponent [3] . Separate regressions tested the effects of maximum elevation and geological age on richness. Endemism rate for each vegetation zone was computed as the number of endemic species divided by the total native species count, expressed as a percentage. The association between island age and single-island endemic count was tested using Spearman rank correlation. Invasive species pressure was quantified as the percentage of plots within each vegetation zone where at least one invasive species was recorded. All analyses used R 4.2.3 at p < 0.05. Field surveys were conducted under Galapagos National Park research permit PC-34-22, coordinated through the National Geological Institute of New Delhi [10] .
Model Comparison
Model performance was compared using adjusted R2, Akaike Information Criterion (AIC), and residual standard error. The area-only model (log S = c + z x log A) was compared with an area-plus-elevation model and a full model including area, elevation, and age. AIC differences greater than 2 were interpreted as meaningful model improvement [13] . Multicollinearity among predictors was assessed using variance inflation factors (VIF); area and elevation were moderately correlated (r = 0.72), but VIF values remained below 3.5 for all predictors, indicating that collinearity did not compromise the regression estimates. Figure 2 shows the violin plots of endemism rate across the six vegetation zones. The Scalesia zone exhibited the highest mean endemism rate (42.8%), followed by Miconia (38.4%) and pampa (31.6%). The littoral zone had the lowest rate (8.4%), consistent with its exposure to salt spray and tidal disturbance that favour widespread, salt-tolerant species over narrow endemics.
Results
Results
Discussion
The species-area exponent of z = 0.31 for Galapagos endemic plants sits comfortably within the range of 0.25-0.35 documented for oceanic island floras worldwide [14] . This value is higher than the z = 0.20-0.25 typically found for continental habitat islands, consistent with the greater isolation and stronger dispersal limitation of oceanic archipelagos. The strong fit of the log-linear model (R2 = 0.89) confirms that island area remains the single best predictor of endemic richness, even in an archipelago where elevation, age, and geological history introduce considerable heterogeneity among islands. The modest but significant improvement gained by adding elevation to the area-only model supports the habitatdiversity hypothesis: taller islands host more vegetation zones, and each zone provides distinct ecological conditions that can support a different subset of endemic species [15] . Isabela, for instance, rises from sea level to 1,707 m and spans all six vegetation zones, while flat Genovesa (64 m) supports only the littoral and arid zones. But elevation and area are correlated (r = 0.72), so disentangling their independent effects is difficult without a larger sample of islands than the Galapagos provides.
The concentration of endemism in the Scalesia and Miconia zones-the two moist highland habitats-has both evolutionary and conservation implications. Evolutionarily, these zones appear to function as speciation cradles where the combination of habitat stability, reduced competition from widespread lowland species, and fog-drip moisture availability has allowed lineages like Scalesia and Darwiniothamnus to diversify [16] . But these same zones face the highest invasive species pressure: Psidium guajava was present at 41.2% of Scalesia plots, forming dense thickets that shade out native understorey species and prevent Scalesia seedling recruitment. The 84.4% invasive incidence in the Scalesia zone represents a direct threat to the archipelago's most endemic-rich habitat.
The positive correlation between island age and singleisland endemic count (r = 0.78) provides empirical support for the evolutionary time hypothesis. San Cristobal (2.4 Ma) and Espanola (3.3 Ma) harbour 14 and 11 single-island endemics respectively, while younger islands like Fernandina (0.3 Ma) have only 3. This pattern suggests that in-situ speciation is an ongoing process in the Galapagos and that the older southeastern islands are the primary loci of plant diversification-a finding consistent with the progression rule observed in Galapagos finches and giant tortoises [17] .
Conclusion
This research provided an updated biogeographic analysis of endemic plant species across 12 Galapagos islands, documenting 247 endemics that constitute 31.4% of the native vascular flora. Species richness scaled predictably with island area (z = 0.31), and the addition of elevation and geological age improved the predictive model, indicating that habitat diversity and evolutionary time both contribute to the archipelago's endemic diversity. The Scalesia cloud forest zone emerged as the single most endemic-rich vegetation type, with an endemism rate of 42.8%, while also suffering the highest invasive species pressure at 84.4% plot incidence.
The biogeographic patterns documented here carry direct conservation implications. First, the older southeastern islands-San Cristobal, Espanola, Floreana, and Santa Feharbour a disproportionate share of single-island endemics and should receive priority in species-level conservation planning. Second, the Scalesia zone requires urgent invasive species management, particularly targeted removal of Psidium guajava, which threatens to displace the endemic tree-daisy forests that define this habitat. Third, the speciesarea relationship predicts that even modest habitat loss on smaller islands can produce disproportionate endemic species loss, reinforcing the need to maintain intact vegetation on islands of all sizes. The species-area and species-age relationships established here provide quantitative benchmarks for predicting how future changes-whether from invasive species expansion, climate-driven vegetation shifts, or human land-use modification-would affect endemic diversity across the archipelago. Future research should incorporate phylogenetic data to distinguish between neo-endemic species (recently evolved) and palaeo-endemics (ancient relicts), and should model how projected climate change may alter vegetation zone boundaries and thereby reshape the spatial distribution of endemic diversity across the Galapagos [18] .
Acknowledgement
Acknowledgements Funding SourcesThis research was supported by general institutional research funds from the National Geological Institute of New Delhi. No external competitive grants were applied. Institutional SupportThe authors thank the National Geological Institute of New Delhi for computing and laboratory access. Field surveys were facilitated by the Charles Darwin Research Station under Galapagos National Park permit PC-34-22.
Figures and tables from the paper
| Island | Area (km2) | Max Elev. (m) | Age (Ma) | Endemic Spp. | Native Spp. | Endemism (%) | SIE Count |
|---|---|---|---|---|---|---|---|
| Isabela | 4,640 | 1,707 | 0.7 | 87 | 284 | 30.6 | 8 |
| Santa Cruz | 986 | 864 | 1.1 | 74 | 248 | 29.8 | 12 |
| Fernandina | 642 | 1,494 | 0.3 | 62 | 194 | 32.0 | 3 |
| Santiago | 585 | 907 | 0.8 | 58 | 186 | 31.2 | 6 |
| San Cristobal | 558 | 730 | 2.4 | 53 | 168 | 31.5 | 14 |
| Floreana | 173 | 640 | 1.5 | 41 | 132 | 31.1 | 9 |
| Espanola | 60 | 206 | 3.3 | 34 | 98 | 34.7 | 11 |
| Marchena | 130 | 343 | 0.6 | 28 | 92 | 30.4 | 2 |
| Pinta | 60 | 777 | 0.7 | 24 | 84 | 28.6 | 3 |
| Santa Fe | 24 | 259 | 2.8 | 19 | 68 | 27.9 | 7 |
| Genovesa | 14 | 64 | 0.3 | 12 | 48 | 25.0 | 1 |
| Baltra | 27 | 100 | 0.8 | 14 | 54 | 25.9 | 1 |
Table text extracted from the original PDF; superscript letters are shown inline. The original table image is below.
View original table image
| Vegetation Zone | Plots (n) | Endemic Spp. | Endemism Rate (%) | Invasive Incidence (%) | Top Invasive | Threat Level |
|---|---|---|---|---|---|---|
| Littoral | 22 | 18 | 8.4 | 31.8 | Prosopis | Low |
| Arid | 28 | 47 | 18.7 | 46.4 | Lantana | Moderate |
| Transition | 26 | 64 | 27.3 | 61.5 | Rubus | High |
| Scalesia | 32 | 98 | 42.8 | 84.4 | Psidium | Critical |
| Miconia | 18 | 72 | 38.4 | 72.2 | Cinchona | Critical |
| Pampa | 22 | 54 | 31.6 | 54.5 | Pennisetum | High |
Table text extracted from the original PDF; superscript letters are shown inline. The original table image is below.
View original table image
References
18 in the original paper- Jackson MH. Galapagos: A natural history. University of Calgary Press. 1993;1:1-315.
- Tye A. Invasive plant problems and requirements for weed risk assessment in the Galapagos Islands. Weed Risk Assessment (CSIRO Publishing). 2006;1:153-175.
- MacArthur RH, Wilson EO. The theory of island biogeography. Princeton University Press. 1967;1:1203.
- Porter DM. The vascular plants of the Galapagos: Origins and dispersal. Patterns of Evolution in Galapagos Organisms (Pacific Division, AAAS). 1983;1:33-96.
- Triantis KA, Borges PAV, Ladle RJ, Hortal J, Cardoso P, Gaspar C. Extinction debt on oceanic islands. Ecography. 2010;33(2):285-294.
- Jaramillo Diaz P, Guezou A, Mauchamp A, Tye A. CDF Checklist of Galapagos Vascular Plants. Charles Darwin Foundation Galapagos Species Checklist. 2018;1:1-online.
- Itow S. Phytogeography and ecology of Scalesia (Compositae) endemic to the Galapagos Islands. Pacific Science. 1995;49(1):17-30.
- Tye A, Snell HL, Peck SB, Adsersen H. Outstanding terrestrial features of the Galapagos archipelago. A Biodiversity Vision for the Galapagos Islands (Charles Darwin Foundation). 2002;1:12-23.
- Jaramillo Diaz P, Guezou A, Mauchamp A, Tye A. Galapagos plant taxonomy since Darwin. Proceedings of the California Academy of Sciences. 2014;61(Suppl. II):247-263.
- Galapagos National Park Service. Research permit regulations and procedures. Ministerio del Ambiente Ecuador. 2020;1:1-28.
- Ricklefs RE, Lovette IJ. The roles of island area per se and habitat diversity in the species-area relationships of four Lesser Antillean faunal groups. Journal of Animal Ecology. 1999;68(6):1142-1160.
- Whittaker RJ, Triantis KA, Ladle RJ. A general dynamic theory of oceanic island biogeography. Journal of Biogeography. 2008;35(6):977-994.
- Burnham KP, Anderson DR. Model selection and multimodel inference: A practical information-theoretic approach. Springer-Verlag, 2nd Edition. 2002;1:1-488.
- Kreft H, Jetz W, Mutke J, Kier G, Barthlott W. Global diversity of island floras from a macroecological perspective. Ecology Letters. 2008;11(2):116-127.
- Adsersen H. Research on islands: Classic, recent, and prospective approaches. A Biodiversity Vision for the Galapagos Islands. 2002;1:7-11.
- Schilling EE, Panero JL, Eliasson UH. Evidence from chloroplast DNA restriction site analysis on the relationships of Scalesia (Asteraceae: Heliantheae). American Journal of Botany. 1994;81(2):248-254.
- Parent CE, Caccone A, Petren K. Colonization and diversification of Galapagos terrestrial fauna: A phylogenetic and biogeographical synthesis. Philosophical Transactions of the Royal Society B. 2008;363(1508):3347-3361.
- Trueman M, d'Ozouville N. Characterizing the Galapagos terrestrial climate in the face of global climate change. Galapagos Research. 2010;67:26-37.