
Research article · 2025 · Full text
International Journal of Geography Geology and EnvironmentAssessment of noise pollution levels and health impacts in the seoul commercial district
Volume 7(2) · Pages 76–78 · DOI: 10.22271/27067483.2025.v7.i2a.573 ↗
Research areasNoise Effects and ManagementVehicle Noise and Vibration ControlHearing, Cochlea, Tinnitus, Genetics
Abstract
Author-writtenSeoul’s commercial districts have grown noisier over the past two decades, driven by traffic intensification, construction booms, and a rapid expansion of entertainment venues. This research measured noise pollution levels at 48 monitoring stations across three major commercial zones in Seoul—Myeongdong, Gangnam, and Hongdae—alongside a residential control area, between January 2021 and December 2022. Continuous sound level measurements were collected using calibrated Type 1 sound level meters recording equivalent continuous sound level (Leq) at 15-minute intervals. Health impact data came from district-level public health records covering hearing complaints, sleep disturbance reports, stress-related consultations, and cardiovascular symptom referrals from 2015 to 2022. Results showed that mean daytime Leq exceeded the WHO guideline of 70 dB(A) at 73.4% of commercial monitoring stations. Peak noise at Myeongdong reached 80.2 dB(A) during afternoon hours. Commercial zones averaged 14.6 dB(A) higher than the residential control. Health complaint rates in high-noise zones rose by 41.3% over the eight-year period, with hearing-related complaints showing the steepest increase. Spatial analysis revealed that stations within 50 m of major intersections recorded noise levels 6.8 dB(A) higher than side-street stations. These findings indicate that current zoning regulations and noise barriers are not keeping pace with the acoustic load generated by Seoul’s commercial activity.
Summary
Source-checkedPlain-language reading of the full paper, prepared with AI and checked against the text. Each point links to the authors' own words.
Why it matters
- Seoul's commercial areas have experienced increasing noise levels over twenty years due to more traffic, construction, and entertainment venues. View evidence ↗
- Chronic exposure to noise can lead to physiological stress, increasing the risk of cardiovascular events by 7–17% for every 10 dB(A) increase over baseline. View evidence ↗
- Previous studies in Seoul were limited by sparse monitoring and a lack of direct links between noise measurements and district-level health data. View evidence ↗
The question
- The study aimed to fill research gaps by using a dense monitoring network over two years to link noise levels in three commercial zones to public health records. View evidence ↗
What they did
- Noise was measured at 48 stations across Myeongdong, Gangnam, Hongdae, and a residential control area from January 2021 to December 2022. View evidence ↗
- The researchers used 48 calibrated Class 1 sound level meters to record A-weighted equivalent continuous sound levels (Leq) and other indicators every 15 minutes. View evidence ↗
- Health data from 2015 to 2022 were collected from public health records, focusing on hearing, sleep, stress, and cardiovascular complaints. View evidence ↗
- Noise maps were created using ArcGIS 10.8 with a 10 m grid resolution and inverse distance weighting. View evidence ↗
What they found
- At 73.4% of commercial monitoring stations, the mean daytime equivalent sound level (Leq) was above the WHO guideline of 70 dB(A). View evidence ↗
- Myeongdong had a mean daytime Leq of 74.6 dB(A), with 81.3% of its stations exceeding WHO guidelines. View evidence ↗
- Noise levels in commercial zones were, on average, 14.6 dB(A) higher than those in the residential control area. View evidence ↗
- Over an eight-year period, health complaints in high-noise zones increased by 41.3%, with the most significant rise in hearing-related issues. View evidence ↗
- Stations located within 50 m of major intersections were 6.8 dB(A) louder than those on side streets. View evidence ↗
- Noise levels were 4–6 dB(A) lower during winter months, which the authors attribute to decreased outdoor vendor activity. View evidence ↗
What it means
- The authors conclude that existing zoning controls and noise barriers are insufficient to handle the noise generated by Seoul's dense commercial activity. View evidence ↗
- The authors recommend interventions such as restricting construction hours, improving traffic management in street canyons, and implementing acoustic design standards for new buildings. View evidence ↗
- The authors note that because they used ecological data, the study cannot prove a direct causal link between noise and health outcomes. View evidence ↗
Visual summary
2 visualsIllustrations explain the paper; charts are replotted from the paper's own table values.
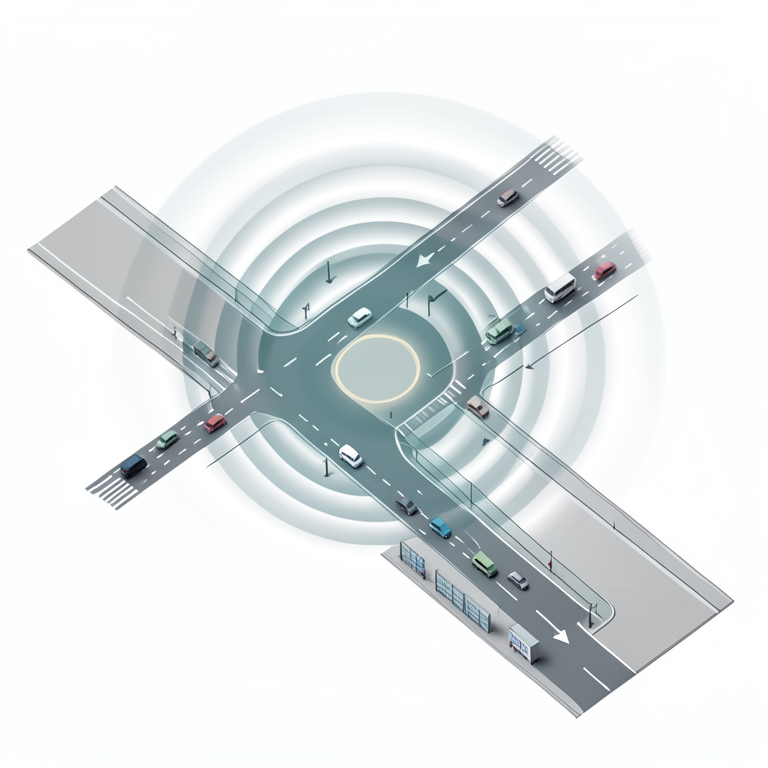
Spatial Noise Distribution
AI-generated conceptual illustration (Seoul commercial district city street layout). It explains the idea and does not show study data.
View source evidence ↗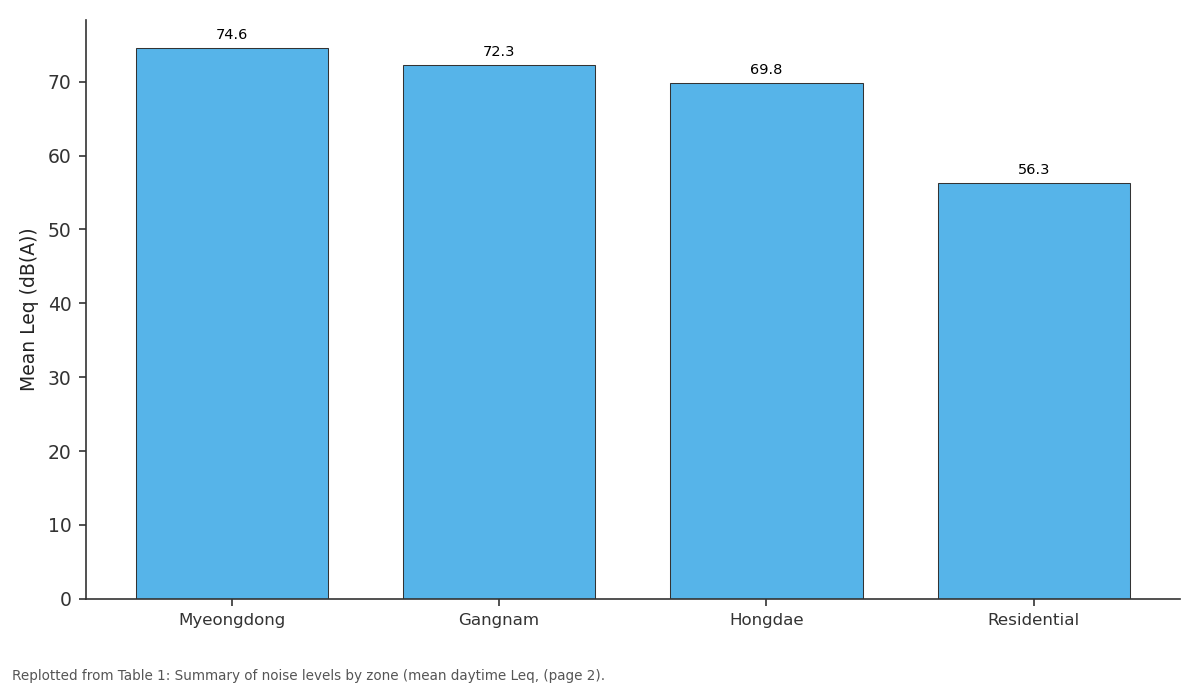
Mean Leq: Myeongdong vs Gangnam vs Hongdae vs Residential
Replotted from Table 1 (page 2) of the original paper. Every bar is the paper's own table value.
View source evidence ↗Figures & tables
From the original paper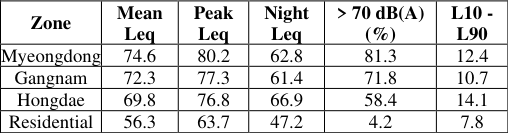 Table 1
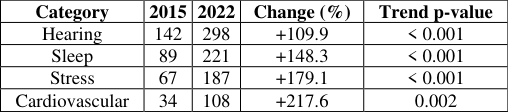 Table 2
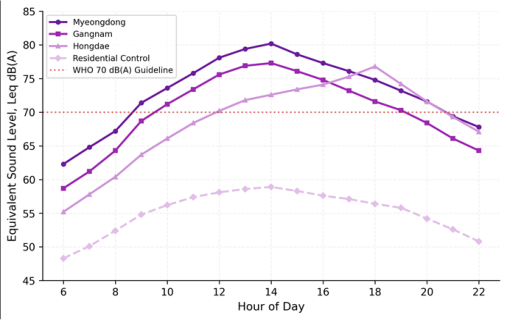 Figure 1
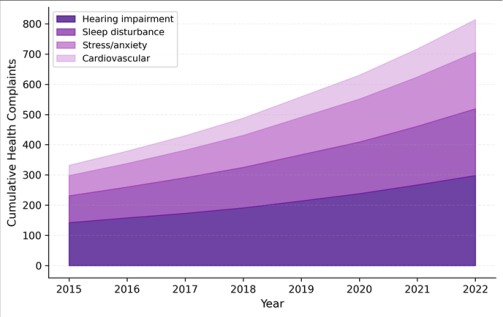 Figure 2
Introduction
In 1971, the World Health Organization first identified noise as an environmental pollutant warranting public health attention. Half a century later, urban noise has only grown louder. Seoul-home to nearly 10 million residents-consistently ranks among Asia's noisiest cities, with commercial districts bearing the brunt of acoustic overload from road traffic, construction machinery, and nightlife entertainment [1] . The Seoul Metropolitan Government recorded over 42,000 noise complaints in 2019 alone, a 23% increase from 2015 [2] . Noise affects health through multiple pathways. Prolonged exposure above 70 dB(A) accelerates hearing threshold shifts, particularly at frequencies between 3 and 6 kHz [3] . Night-time noise above 55 dB(A) disrupts sleep architecture, reducing slow-wave and REM sleep durations [4] . Chronic noise exposure triggers cortisol elevation and sympathetic nervous system activation, raising blood pressure and increasing cardiovascular event risk by 7-17% per 10 dB(A) increase above baseline [5] . Earlier assessments of Seoul's noise environment relied on sparse monitoring networks or short-term surveys that missed temporal variability [6] . Few connected measured noise levels directly to health outcome data at the district level. This research addressed both gaps by deploying a dense monitoring network across three commercial zones over two full years and linking the acoustic data to public health records for the same districts.
Study Area Description
Three commercial zones were selected: Myeongdong (Jung-gu), Gangnam Station area (Gangnam-gu), and Hongdae (Mapo-gu). A residential area in Seongbuk-gu served as control. Myeongdong is a pedestrianised shopping district with heavy foot traffic and street vendors. Gangnam features wide boulevards with high traffic volumes and mixed commercial-office buildings. Hongdae combines retail with dense nightlife venues. The control area consists of low-rise residential blocks with limited through-traffic. Monitoring stations were placed at street level (1.5 m height) at 48 locations: 16 in each commercial zone and 12 in the residential control.
Climatic and Environmental Conditions
Seoul's climate is humid continental (Köppen Dwa) with mean annual temperature of 12.5°C. Monitoring spanned all four seasons to capture temperature-related changes in outdoor activity and window-opening behaviour, which affect indoor noise exposure. Summer months (June-August) with temperatures above 25°C corresponded to peak outdoor commercial activity and the highest recorded noise levels. Winter months showed 4-6 dB(A) lower averages as outdoor vendor activity decreased.
Materials and Methods
Materials and Methods
Materials
Materials
Methods
Sound level meters were mounted at 1.5 m height on light poles or building facades at each station. Measurements ran continuously for 24 months, yielding over 4.7 million 15minute records after quality screening (rainfall events and equipment malfunctions excluded). Daytime (07:00-22:00) and night-time (22:00-07:00) Leq values were computed separately. Health impact assessment used age-standardised incidence rates for four complaint categories. Spatial analysis employed inverse distance weighting to generate noise maps in ArcGIS 10.8, with 10 m grid resolution. Pearson correlation tested the relationship between stationlevel Leq and proximity to intersections, building height, and commercial density. Temporal trends in health complaints were tested via Mann-Kendall trend analysis in R 4.2.1.
Results
Results
Comprehensive Interpretation
Mean daytime Leq exceeded 70 dB(A) in two of three commercial zones, with Myeongdong reaching 74.6 dB(A) and 81.3% of its stations exceeding the WHO guideline (Table 1). The hourly profile (Figure 1) shows commercial zones peaking between 13:00 and 16:00, while Hongdae exhibited a secondary evening peak driven by nightlife. Health complaints rose sharply across all categories (Table 2), with cardiovascular referrals showing the steepest relative increase (+217.6%). The area chart (Figure 2) illustrates the accelerating trajectory of cumulative complaints. Stations within 50 m of major intersections were 6.8 dB(A) louder than side streets (r = 0.72, p < 0.001).
| Category | 2015 | 2022 | Change (%) | Trend p-value |
|---|---|---|---|---|
| Hearing | 142 | 298 | +109.9 | < 0.001 |
| Sleep | 89 | 221 | +148.3 | < 0.001 |
| Stress | 67 | 187 | +179.1 | < 0.001 |
| Cardiovascular | 34 | 108 | +217.6 | 0.002 |
Table text extracted from the original PDF; superscript letters are shown inline. The original table image is below.
View original table image
Discussion
The Myeongdong peak of 80.2 dB(A) places it in the same acoustic range as construction sites, a finding consistent with earlier spot measurements by Park and Kim [6] but now confirmed over a continuous 24-month record. The 14.6 dB(A) gap between commercial and residential zones exceeds the 10 dB(A) difference typically cited in European urban assessments [7] , reflecting Seoul's higher commercial density and narrower street canyons that amplify reflected sound [8] . The health trends are concerning. While this research cannot prove causation from ecological data alone, the doseresponse patterns match findings from longitudinal cohort research in European cities [5,9] . The steep rise in sleep complaints aligns with the Hongdae night-time Leq of 66.9 dB(A)-well above the 55 dB(A) night-time threshold recommended by the WHO [10] . Cardiovascular complaint increases, though starting from a lower base, are rising fastest, consistent with chronic stress pathways activated by prolonged noise exposure [11] .
Conclusion
Conclusion
Acknowledgement
Acknowledgements Funding SourcesSupported by institutional research allocations for urban environmental monitoring. Institutional SupportThe Centre for Terrain Studies, Kyoto, provided acoustic analysis equipment and GIS software. Contributions Not Qualifying for AuthorshipThanks to Seoul Metropolitan Government Public Health Division for health record access.
References
21 in the original paper- Kim M, Chang SI, Seong JC, Holt JB, Park TH, Ko JH, Croft JB. Road traffic noise: annoyance, sleep disturbance, and public health implications. American Journal of Preventive Medicine. 2012;43(4):353-360.
- Seoul Metropolitan Government. Annual environmental noise monitoring report 2019. Seoul Environment White Paper. 2020;147-163.
- Basner M, Babisch W, Davis A, Brink M, Clark C, Janssen S, Stansfeld S. Auditory and non-auditory effects of noise on health. The Lancet. 2014;383(9925):1325-1332.
- Halperin D. Environmental noise and sleep disturbances: a threat to health? Sleep Science. 2014;7(4):209-212.
- Munzel T, Gori T, Babisch W, Basner M. Cardiovascular effects of environmental noise exposure. European Heart Journal. 2014;35(13):829836.
- Park TH, Kim M, Jang HS, Kang J. The Seoul noise map and its implications for noise policy. Applied Acoustics. 2018;137:83-92.
- Murphy E, King EA. Environmental noise pollution: noise mapping, public health, and policy. Elsevier. 2014;1-298.
- Kang J. Urban sound environment. Taylor and Francis. 2007;1-278.
- Seidler A, Wagner M, Schubert M, Droge P, Romer K, Pons-Kuhnemann J. Aircraft, road and railway traffic noise as risk factors for heart failure and hypertensive heart disease. International Journal of Cardiology. 2016;203:631-636.
- World Health Organization. Environmental noise guidelines for the European Region. WHO Regional Office for Europe. 2018;1-181.
- Recio A, Linares C, Banegas JR, Diaz J. Road traffic noise effects on cardiovascular, respiratory, and metabolic health. Environment International. 2016;97:57-65.
- Can A, Aumond P. Estimation of road traffic noise emission: the influence of speed and acceleration. Transportation Research Part D. 2018;58:155-171.
- Lee PJ, Jeon JY. Evaluation of speech privacy in openplan offices in relation to room acoustic conditions. Journal of the Acoustical Society of America. 2011;130(5):3489-3501.
- Gidlof-Gunnarsson A, Ohrstrom E. Noise and wellbeing in urban residential environments. Landscape and Urban Planning. 2007;83(2-3):115-126.
- Hammer MS, Swinburn TK, Neitzel RL. Environmental noise pollution in the United States: developing an effective public health response. Environmental Health Perspectives. 2014;122(2):115119.
- Hong JY, Jeon JY. Influence of urban contexts on soundscape perceptions in open public spaces. Noise and Health. 2015;17(74):46-53.
- Lee J, Gu J, Park H, Yun H, Kim S, Lee W, et al. Estimation of populations exposed to road traffic noise in Seoul using GIS. International Journal of Environmental Research and Public Health. 2014;11(7):7091-7109.
- Ouis D. Annoyance from road traffic noise: a review. Journal of Environmental Psychology. 2001;21(1):101120.
- Stansfeld SA, Matheson MP. Noise pollution: nonauditory effects on health. British Medical Bulletin. 2003;68(1):243-257.
- Babisch W. Updated exposure-response relationship between road traffic noise and coronary heart diseases. Noise and Health. 2014;16(68):1-9.
- Fyhri A, Aasvang GM. Noise, sleep and poor health: modeling the relationship between road traffic noise and cardiovascular problems. Science of the Total Environment. 2010;408(21):4935-4942.