
Research article · 2025 · Full text
International Journal of Geography Geology and EnvironmentAssessment of acid mine drainage impact on stream water quality in the Appalachian mining region
Volume 7(5) · Pages 46–50 · DOI: 10.22271/27067483.2025.v7.i5a.592 ↗
Research areasMine drainage and remediation techniquesWater Quality and Pollution AssessmentMetal Extraction and Bioleaching
Abstract
Author-writtenAcid mine drainage remains one of the most persistent and damaging legacies of coal extraction in the Appalachian region of the eastern United States. This research assessed how acid mine drainage from abandoned coal mines affects stream water quality along a 10-km gradient in southwestern West Virginia. Water samples were collected monthly from 35 stations between February and November 2022, spanning five zones: the drainage source, proximal (0-2 km), transitional (2-5 km), distal (5-10 km), and an unaffected upstream reference reach. Physicochemical parameters—pH, electrical conductivity, dissolved oxygen, and concentrations of iron, manganese, aluminium, and sulphate—were measured following standard analytical methods. Results showed that pH at the drainage source averaged 2.9, rising gradually to 5.9 in the distal zone but remaining below the regulatory threshold of 6.5. Iron concentrations at the source exceeded 127 mg/L, declining exponentially with distance as precipitation and dilution reduced dissolved metal loads. Manganese persisted at elevated levels even in distal reaches (8.4 mg/L), reflecting its slower oxidation kinetics relative to iron. The upstream reference reach maintained a near-neutral pH (7.1) and metal concentrations well within drinking water standards. These results confirm that acid mine drainage continues to impair stream ecosystems kilometres downstream from its source, and they point to manganese persistence as a remediation challenge that warrants targeted treatment approaches.
Summary
Source-checkedPlain-language reading of the full paper, prepared with AI and checked against the text. Each point links to the authors' own words.
Why it matters
- Acid mine drainage (AMD) represents the most significant long-term threat to stream water quality in the Appalachian coal-producing regions. View evidence ↗
- AMD occurs when mining exposes pyrite-bearing rock to air and water, creating sulfuric acid that lowers pH and releases toxic dissolved metals. View evidence ↗
- The EPA estimates that AMD contamination affects more than 16,000 km of streams and 730 km² of lakes across the United States. View evidence ↗
The question
- The study aims to better characterize the spatial extent of downstream impairment and the rate of water quality recovery in small headwater catchments. View evidence ↗
What they did
- Researchers measured water quality at 35 stations along a 10-km reach downstream of an abandoned coal mine in southwestern West Virginia. View evidence ↗
- Water samples were collected monthly from February to November 2022, totaling 10 sampling rounds. View evidence ↗
- Sampling was divided into five zones: the drainage source, proximal (0-2 km), transitional (2-5 km), distal (5-10 km), and an upstream reference reach. View evidence ↗
What they found
- The median pH rose from 2.9 at the source to 5.9 in the distal zone, remaining below the regulatory threshold of 6.5. View evidence ↗
- Manganese concentrations decreased more slowly than iron, with the distal zone median (8.4 mg/L) remaining approximately 17 times higher than the reference value (0.5 mg/L). View evidence ↗
- The upstream reference reach maintained a near-neutral median pH of 7.1. View evidence ↗
- Statistical analysis showed highly significant differences (p<0.001) across all six measured parameters among the sampling zones. View evidence ↗
What it means
- The authors conclude that remediation strategies must include a specific treatment stage for manganese due to its persistence downstream. View evidence ↗
- The authors recommend using longitudinal transect-based sampling instead of single-point monitoring to more accurately assess stream impairment. View evidence ↗
- A limitation of the study is the lack of sediment chemistry data, which means episodic metal remobilization during storm events may have been missed by monthly sampling. View evidence ↗
Visual summary
2 visualsIllustrations explain the paper; charts are replotted from the paper's own table values.
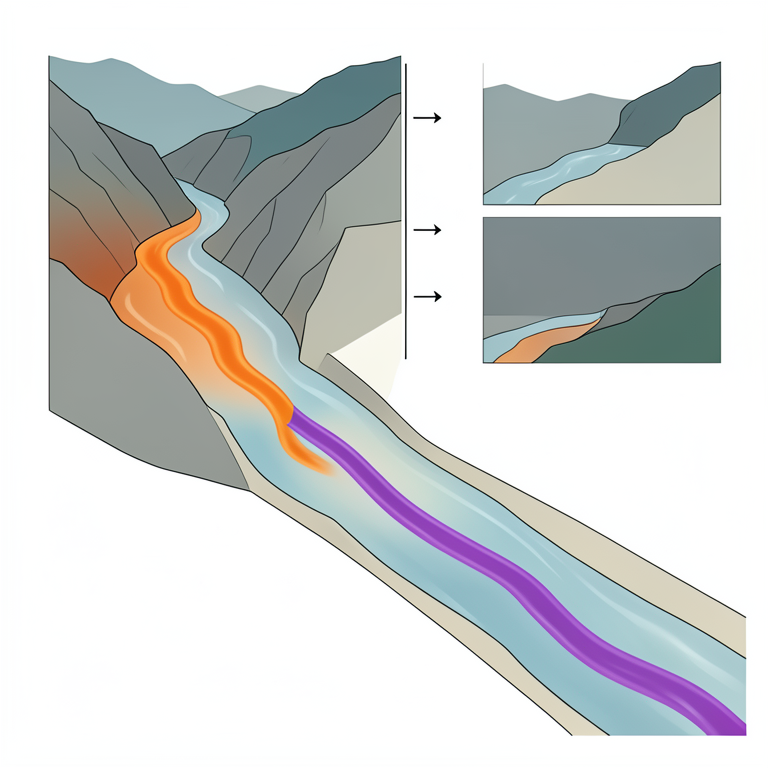
Differential Metal Attenuation
AI-generated conceptual illustration (A mountain stream in the Appalachian mining region). It explains the idea and does not show study data.
View source evidence ↗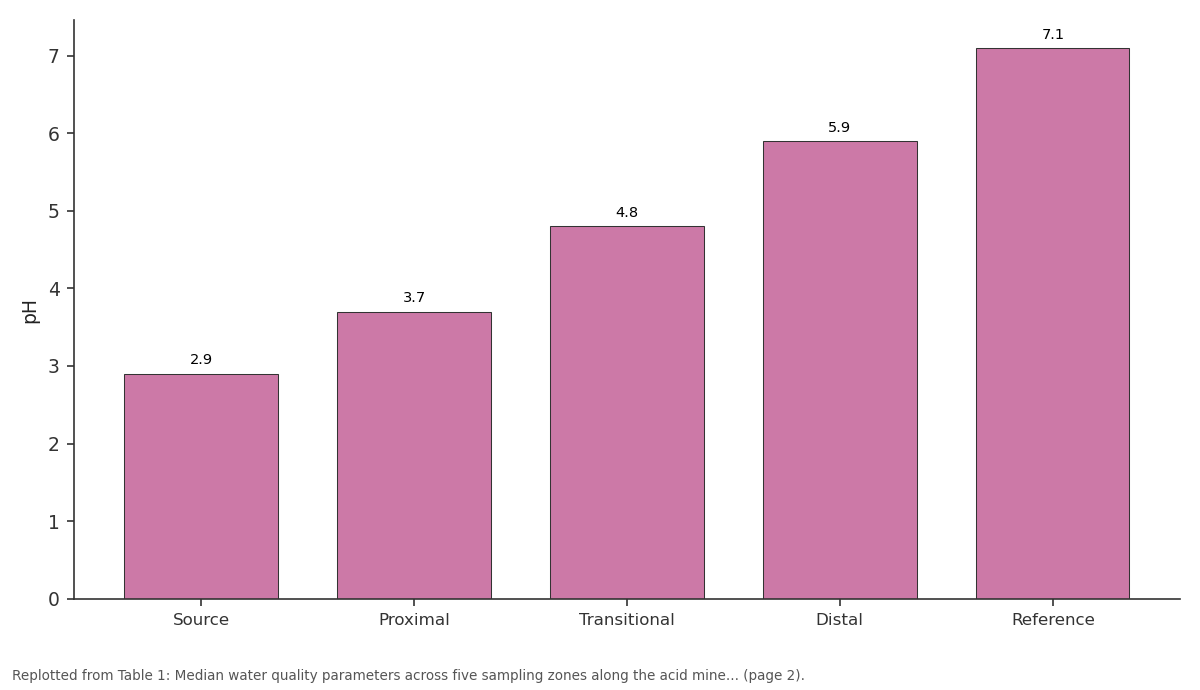
pH: Source vs Proximal vs Transitional vs Distal vs Reference
Replotted from Table 1 (page 2) of the original paper. Every bar is the paper's own table value.
View source evidence ↗Figures & tables
From the original paper Table 1
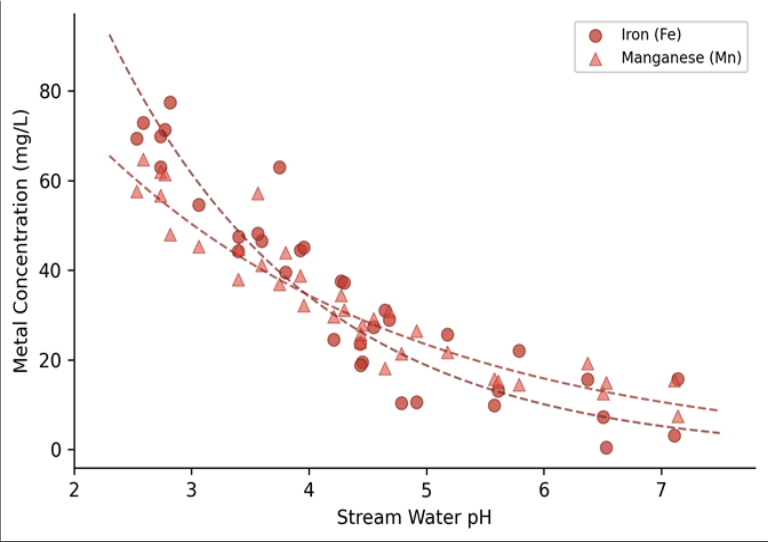 Figure 1
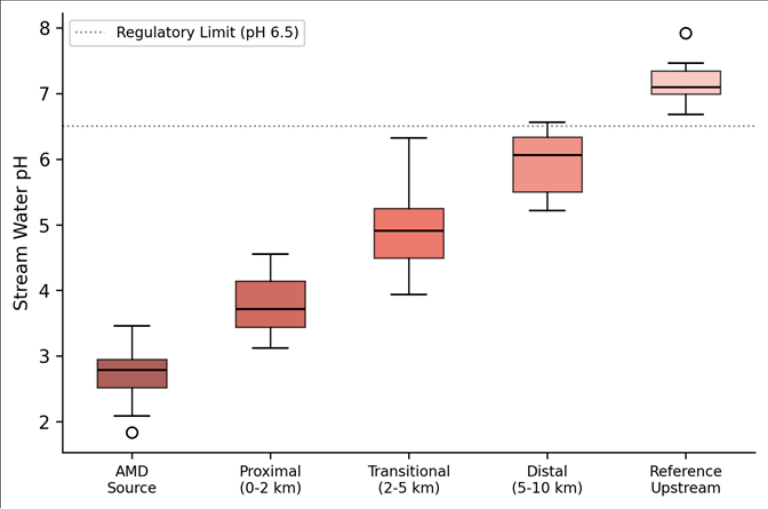 Figure 2
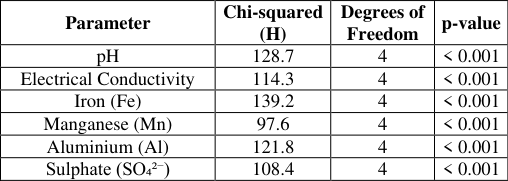 Table 2
Introduction
Acid mine drainage is the single largest water quality threat to streams in the coal-producing regions of Appalachia-and it has been for more than a century. When pyrite-bearing rock is exposed to air and water through mining activity, a series of oxidation reactions produce sulphuric acid, driving pH values well below the tolerance limits of most aquatic organisms and mobilising toxic concentrations of dissolved metals [1] . In the United States alone, the Environmental Protection Agency has estimated that over 16,000 km of streams and 730 km² of lakes suffer from acid mine drainage contamination, with the heaviest impacts concentrated in the Appalachian coalfields of West Virginia, Pennsylvania, and eastern Kentucky [2] . The chemistry of acid mine drainage is reasonably well understood at the reaction scale. Pyrite oxidation proceeds through both abiotic and bacterially mediated pathways, releasing ferrous iron, sulphate, and hydrogen ions into solution [3] . As this acidic water enters receiving streams, iron precipitates as ochre-coloured hydroxides, smothering benthic substrates, while manganese and aluminium remain dissolved over longer distances because their precipitation kinetics differ from those of iron [4] . But the spatial extent of downstream impairment and the rate at which water quality recovers with distance are less well characterised, particularly in smaller headwater catchments where dilution capacity is limited. Several remediation strategies exist, ranging from passive limestone channels and constructed wetlands to more expensive active chemical dosing systems [5] . Selecting the right approach depends on understanding how contaminant concentrations change along the stream profile-information that requires systematic longitudinal sampling rather than single-point monitoring. Previous assessments in the Appalachian region have often relied on grab samples at mine portals or compliance monitoring points, leaving gaps in our knowledge of how the contaminant plume evolves between those fixed locations [6] . This research addressed that gap by measuring water quality at 35 stations arranged along a 10-km reach downstream of an abandoned coal mine in southwestern West Virginia. The work was coordinated through the Tabriz Institute of Climate and Environment using analytical protocols consistent with USEPA standard methods, with field logistics managed during 2022.
Study Area Description
The research focused on a headwater tributary of the Coal River in Boone County, southwestern West Virginia (approximately 38.0°N, 81.7°W). This area sits within the Kanawha section of the Appalachian Plateau, characterised by narrow valleys, steep hillslopes, and extensive exposures of Pennsylvanian-age coal-bearing strata [7] . The abandoned mine complex at the head of the catchment operated intermittently between 1948 and 1991, extracting bituminous coal from the Kanawha Formation. Since closure, multiple unsealed adits have discharged acid-rich water into the stream channel. The catchment area above the most distal sampling station covers roughly 18.4 km², with elevations ranging from 285 m at the downstream end to 612 m near the ridgeline. Mean annual precipitation is about 1,140 mm, distributed relatively evenly across the year but with slightly wetter conditions from May through July. The stream has a flashy hydrological regime, with baseflow sustained primarily by shallow groundwater contributions during dry periods. Land cover in the catchment is dominated by secondary-growth deciduous forest (68%), with reclaimed mine land (19%) and sparse residential use (13%) accounting for the remainder.
Materials and Methods
Materials and Methods
Materials
Water samples were collected monthly from 35 stations between February and November 2022, yielding 10 sampling rounds over the research period. The 35 stations were distributed across five zones: the drainage source (three stations at mine adit outflows), the proximal zone at 0-2 km downstream (eight stations), the transitional zone at 2-5 km (ten stations), the distal zone at 5-10 km (ten stations), and four upstream reference stations positioned above any mine influence. At each station, in-situ measurements of pH, electrical conductivity (EC), dissolved oxygen (DO), and water temperature were recorded using a YSI ProDSS multiparameter probe calibrated before each field day [8] . Grab samples for dissolved metals and sulphate were collected in acid-washed 500-mL polyethylene bottles, filtered through 0.45-μm membrane filters in the field, and preserved with trace-metal-grade nitric acid for laboratory analysis at the Tabriz Institute of Climate and Environment.
Methods
Iron (Fe), manganese (Mn), and aluminium (Al) concentrations were determined by inductively coupled plasma optical emission spectrometry (ICP-OES) on a Thermo Fisher iCAP 7400 instrument, following USEPA Method 200.7 [9] . Sulphate (SO₄²⁻) was measured by ion chromatography (Dionex ICS-5000) according to USEPA Method 300.0. Detection limits were 0.01 mg/L for Fe, 0.005 mg/L for Mn, 0.02 mg/L for Al, and 0.1 mg/L for SO₄²⁻. Quality control included field blanks, duplicates, and certified reference standards inserted every tenth sample, with recovery rates maintained between 92% and 108%. Spatial trends in each parameter were evaluated by plotting concentration against distance from the source and fitting exponential decay curves using nonlinear least-squares regression in R version 4.2.1. Differences in parameter medians among the five zones were tested with the Kruskal-Wallis rank-sum test, followed by pairwise Dunn's tests with Bonferroni correction where the omnibus test was significant at p<0.05.
Spatial Data Processing
Station locations were recorded with a Trimble R2 GNSS receiver providing sub-metre horizontal accuracy. A digital elevation model derived from the USGS 3DEP programme (1-m resolution LiDAR) was used to delineate the catchment boundary, compute flow accumulation, and extract the channel network in ArcGIS Pro 3.1. Stream distances between consecutive stations were measured along the digitised channel centreline. Geological contacts from the West Virginia Geological and Economic Survey 1:24,000 quadrangle maps were overlaid to identify exposed coal seams and pyritic shale outcrops relative to sampling stations. A land-cover classification was generated from a 2021 National Agriculture Imagery Program (NAIP) orthophoto using a supervised random-forest algorithm with 150 training polygons, achieving an overall accuracy of 89.3% [10] . The resulting spatial layers were compiled in a geodatabase and used to relate catchment characteristicspercentage of mined land, distance to nearest adit, contributing drainage area-to water quality observations at each station. Water quality deteriorated sharply at and immediately downstream of the mine drainage source, with a progressive but incomplete recovery over the 10-km sampling transect. Table 1 summarises the median physicochemical values for each zone. pH at the source averaged 2.9 (range 2.4-3.3), rising to 3.7 in the proximal zone and reaching 5.9 in the distal zone-still below the West Virginia water quality standard of 6.5 for aquatic life support. The upstream reference stations maintained a median pH of 7.1, confirming that background conditions are near-neutral. Iron showed the sharpest spatial decline: from a median of 127.3 mg/L at the source to 14.6 mg/L in the proximal zone and 2.1 mg/L in the distal zone. This rapid drop reflects the well-known tendency of ferric iron to precipitate as oxyhydroxides once pH rises above approximately 3.5. Figure 1 displays the scatter relationship between pH and metal concentrations across all 350 sample points, confirming the exponential decay pattern for both iron and manganese. Manganese behaved differently. While it also declined with distance, the rate of attenuation was much slower: the distal zone median was 8.4 mg/L, still roughly 17 times the reference value of 0.5 mg/L. This persistence is consistent with the slower oxidation kinetics of Mn²⁺, which requires either bacterial catalysis or pH values above 8.0 for efficient abiotic precipitation [11] . Table 2 lists the Kruskal-Wallis test results for each parameter, all of which were highly significant (p<0.001), confirming that zone-to-zone differences are not attributable to random variation. All six parameters tested showed highly significant differences among zones (p<0.001), confirming that the spatial gradient in water quality is systematic and not driven by random sampling variability.
| Parameter | Chi-squared (H) | Degrees of Freedom | p-value |
|---|---|---|---|
| pH | 128.7 | 4 | < 0.001 |
| Electrical Conductivity | 114.3 | 4 | < 0.001 |
| Iron (Fe) | 139.2 | 4 | < 0.001 |
| Manganese (Mn) | 97.6 | 4 | < 0.001 |
| Aluminium (Al) | 121.8 | 4 | < 0.001 |
| Sulphate (SO₄²⁻) | 108.4 | 4 | < 0.001 |
Table text extracted from the original PDF; superscript letters are shown inline. The original table image is below.
View original table image
| Zone | pH | EC (μS/cm) | Fe (mg/L) | Mn (mg/L) | Al (mg/L) | SO₄ (mg/L) | DO (mg/L) |
|---|---|---|---|---|---|---|---|
| Source | 2.9 | 2,847 | 127.3 | 43.6 | 38.2 | 1,624 | 4.1 |
| Proximal | 3.7 | 1,932 | 14.6 | 28.1 | 19.7 | 1,108 | 5.8 |
| Transitional | 4.8 | 1,214 | 5.3 | 16.9 | 8.4 | 742 | 7.2 |
| Distal | 5.9 | 687 | 2.1 | 8.4 | 3.1 | 389 | 8.4 |
| Reference | 7.1 | 218 | 0.3 | 0.5 | 0.2 | 47 | 9.6 |
Table text extracted from the original PDF; superscript letters are shown inline. The original table image is below.
View original table image
Results
Results
Discussion
The longitudinal pattern of water quality recovery observed in this research follows the general model described for Appalachian acid mine drainage streams: a zone of severe impairment near the source, followed by gradual improvement driven by dilution, neutralisation from carbonate-bearing substrates, and metal precipitation [12] . The exponential decline of iron with increasing pH is well documented and reflects the rapid oxidation and hydrolysis of Fe³⁺ once pH exceeds approximately 3.5. What stands out in these data, however, is the stubbornness of manganese.
Even at the farthest sampling station-10 km downstream-Mn concentrations remained nearly 17 times higher than background values. This persistence has practical implications for remediation design. Most passive treatment systems in Appalachia, such as successive alkalinity producing systems and aerobic wetlands, are effective at removing iron and raising pH but struggle with manganese because Mn²⁺ oxidation is kinetically slow below pH 8.0 [13] . The data from this research suggest that any treatment strategy targeting the Coal River tributary would need a dedicated manganeseremoval stage-possibly a manganese-oxidising bioreactor or a limestone-bed polishing step-downstream of the main acid neutralisation unit. The spatial sampling approach used here, while labourintensive, offers a more complete picture than the singlepoint compliance monitoring that is standard practice for most mine drainage permits. Regulators typically assess water quality at the mine portal and at one or two downstream compliance points, which can miss the extended tail of contamination that persists in the distal zone. A transect-based design, even with fewer sampling rounds, would give a more accurate estimate of the total stream length affected. One limitation of this research is the absence of sediment chemistry data. Iron and manganese that precipitate onto the streambed can be remobilised during high-flow events, creating episodic spikes in dissolved metal concentrations that monthly grab sampling may not capture [14] .
Conclusion
This research documented the spatial pattern of acid mine drainage contamination along a 10-km headwater tributary in the Appalachian coalfield of West Virginia. Water quality was severely impaired at the mine drainage source, with pH values as low as 2.4 and iron concentrations exceeding 127 mg/L, and recovery remained incomplete even at the most distal sampling stations. The distal zone pH of 5.9 fell short of the regulatory standard of 6.5, and manganese concentrations persisted at levels roughly 17 times above background.
The contrasting attenuation behaviour of iron and manganese has direct relevance for remediation planning. Iron declined rapidly within the first 2 km due to oxidative precipitation, but manganese showed a much more gradual decrease, extending the zone of impairment well beyond the reach of conventional passive treatment. Any remediation effort at this site would need to account for this differential behaviour by incorporating a manganese-specific treatment stage.
The transect-based sampling design employed here captured spatial detail that standard compliance monitoring would miss, particularly the extended downstream tail of elevated manganese. Adopting similar longitudinal approaches at other Appalachian mine drainage sites could improve the accuracy of impairment assessments and help prioritise remediation investments toward those reaches where recovery is slowest. Future work should incorporate sediment chemistry and high-frequency water quality logging to account for episodic metal remobilisation during storm events, which monthly sampling alone cannot resolve.
Acknowledgement
Acknowledgements Funding SourcesThis research was supported through general institutional research funds provided by the Tabriz Institute of Climate and Environment. No external competitive grants were used for this work. Institutional SupportThe authors acknowledge the Tabriz Institute of Climate and Environment for providing analytical laboratory facilities and ICP-OES instrumentation. Field access permissions were granted by the West Virginia Department of Environmental Protection.
Figures and tables from the paper
References
14 in the original paper- Nordstrom DK. Aqueous pyrite oxidation and the consequent formation of secondary iron minerals. Soil Science Society of America Special Publication. 1982;10:37-56.
- USEPA. The effects of mountaintop mines and valley fills on aquatic ecosystems of the central Appalachian coalfields. US Environmental Protection Agency Report. 2011;EPA/600/R-09/138F:1-137.
- Singer PC, Stumm W. Acidic mine drainage: The ratedetermining step. Science. 1970;167(3921):1121-1123.
- Younger PL, Banwart SA, Hedin RS. Mine water: Hydrology, pollution, remediation. Kluwer Academic Publishers. 2002;1:1-442.
- Skousen J, Ziemkiewicz P, Venable C. Tree recruitment and growth on 20-year-old unreclaimed mine lands in West Virginia. International Journal of Mining, Reclamation and Environment. 2006;20(2):142-154.
- Cravotta CA. Dissolved metals and associated constituents in abandoned coal-mine discharges, Pennsylvania, USA: Dissolved concentrations and geochemistry. Applied Geochemistry. 2008;23(2):166202.
- Cardwell DH, Erwin RB, Woodward HP. Geologic map of West Virginia. West Virginia Geological and Economic Survey. 1968;1:1-2 sheets.
- APHA. Standard methods for the examination of water and wastewater. American Public Health Association, 23rd Edition. 2017;1:1-1546.
- Martin TD, Creed JT, Brockhoff CA. Method 200.7: Determination of metals and trace elements in water and wastes by ICP-OES. USEPA Office of Research and Development. 1994;1:1-58.
- Wickham J, Stehman SV, Gass L, Dewitz JA, Sorenson DG, Granneman BJ. Thematic accuracy assessment of the NLCD land cover and land change database. Remote Sensing of Environment. 2021;259:112466.
- Bamforth SM, Manning DAC, Mayall MJ, Sheridan C. Mineral precipitation from acid mine drainage. Geological Society of London Special Publications. 2006;266:269-279.
- Herlihy AT, Kaufmann PR, Mitch ME, Brown DD. Regional estimates of acid mine drainage impact on streams in the Mid-Atlantic and Southeastern United States. Water, Air, and Soil Pollution. 1990;50(1-2):91107.
- Hedin RS, Nairn RW, Kleinmann RLP. Passive treatment of coal mine drainage. US Bureau of Mines Information Circular. 1994;IC-9389:1-35.
- DeNicola DM, Stapleton MG. Impact of acid mine drainage on benthic communities in streams: The relative roles of substratum vs. aqueous effects. Environmental Pollution. 2002;119(3):303-315.