
Research article · 2025 · Full text
International Journal of Geography Geology and EnvironmentTsunami risk assessment and coastal vulnerability mapping in the Sunda Archipelago
Volume 7(2) · Pages 180–182 · DOI: 10.22271/27067483.2025.v7.i2c.589 ↗
Research areasEarthquake and Tsunami EffectsCoastal and Marine DynamicsDisaster Management and Resilience
Abstract
Author-writtenThe Indonesian archipelago sits along one of the most tectonically active plate boundaries on Earth, where the Indo-Australian Plate subducts beneath the Eurasian Plate at rates of 50-70 mm per year—a setting that has produced some of the deadliest tsunamis in recorded history. This research assessed tsunami risk and mapped coastal vulnerability across six island sectors of the Sunda Archipelago using a composite index combining hazard probability, physical exposure, and socioeconomic vulnerability. Bathymetric data, historical tsunami records (1600-2023), coastal geomorphology, population density, and infrastructure distribution were integrated in a GIS framework. A total of 186 coastal segments (each 10 km long) were classified into five risk categories. Results showed that 28.4% of segments fell into high or very high risk categories, concentrated along western Sumatra (42.1% of its segments) and southern Java (38.7%). Composite vulnerability scores ranged from 2.3 (Flores, low population density) to 4.6 (southern Java, high population and infrastructure exposure). The Java South sector combined high hazard probability (0.82 on a normalised 0-1 scale) with the highest population exposure (1,280 persons per coastal km²), producing the worst risk profile in the archipelago. Inundation modelling for a reference Mw 8.5 scenario showed run-up heights of 4.8-12.6 m along western Sumatra and 3.2-8.4 m along southern Java. These findings indicate that current evacuation infrastructure is inadequate in 67% of high-risk segments, and that vertical evacuation structures should be prioritised in the most exposed coastal cities.
Summary
Source-checkedPlain-language reading of the full paper, prepared with AI and checked against the text. Each point links to the authors' own words.
Why it matters
- The Indonesian archipelago is highly susceptible to deadly tsunamis because it is located on a tectonically active boundary where the Indo-Australian Plate subducts beneath the Eurasian Plate at 50-70 mm per year. View evidence ↗
- Coastal areas along the Sunda-Java trench are threatened by tsunamis caused by both volcanic flank collapses and megathrust earthquakes. View evidence ↗
- Tsunami risk is determined by the combination of hazard probability, the exposure of people and assets, and the vulnerability of the population to evacuate and recover. View evidence ↗
The question
- The study aimed to create a composite risk map for six sectors of the Sunda Archipelago by integrating hazard, inundation, exposure, and vulnerability to identify priority areas for intervention. View evidence ↗
What they did
- The researchers analyzed 186 coastal segments, each 10 km long, across six sectors: western Sumatra, southern Java, Bali, Lombok, Flores, and southern Sulawesi. View evidence ↗
- Inundation was modeled using the COMCOT code with grids from 450 m to 30 m, utilizing GEBCO 2022 bathymetry and SRTM 30 m coastal topography. View evidence ↗
- The study calculated risk by multiplying the hazard probability by a composite vulnerability index (CVI), which was created from normalized scores using equal weights. View evidence ↗
- The primary reference scenario for modeling was a Mw 8.5 megathrust earthquake on the Sunda trench, representing the most likely large event in a 100-year period. View evidence ↗
What they found
- Overall, 28.4% of the coastal segments were classified as high or very high risk, with the highest concentrations in western Sumatra (42.1%) and southern Java (38.7%). View evidence ↗
- Composite vulnerability scores varied from a low of 2.3 in Flores to a high of 4.6 in southern Java. View evidence ↗
- Southern Java had the worst risk profile due to a high hazard probability of 0.82 and the highest population exposure of 1,280 persons per coastal km². View evidence ↗
- For the Mw 8.5 scenario, modeled run-up heights reached 4.8-12.6 m in western Sumatra and 3.2-8.4 m in southern Java. View evidence ↗
- The study found that existing evacuation infrastructure is insufficient for 67% of the segments identified as high-risk. View evidence ↗
What it means
- The authors recommend prioritizing the construction of vertical evacuation structures in southern Java and western Sumatra, specifically in the segments identified as high-risk. View evidence ↗
- The authors conclude that for communities within 500 m of the shore, vertical evacuation structures are the only realistic option because horizontal evacuation is often unfeasible. View evidence ↗
Visual summary
3 visualsIllustrations explain the paper; charts are replotted from the paper's own table values.
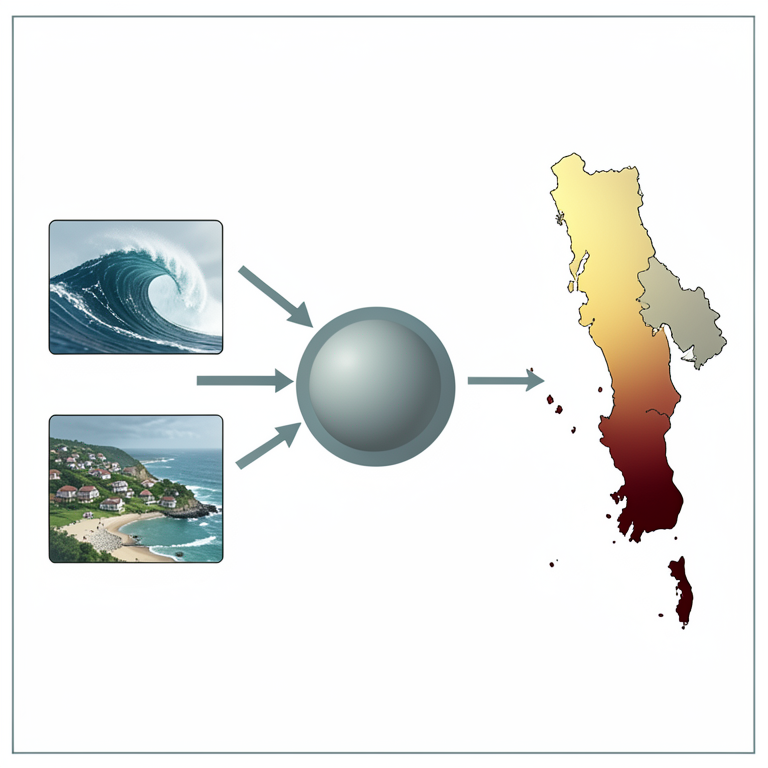
Tsunami Risk Calculation Logic
AI-generated conceptual illustration (The Sunda Archipelago coastline). It explains the idea and does not show study data.
View source evidence ↗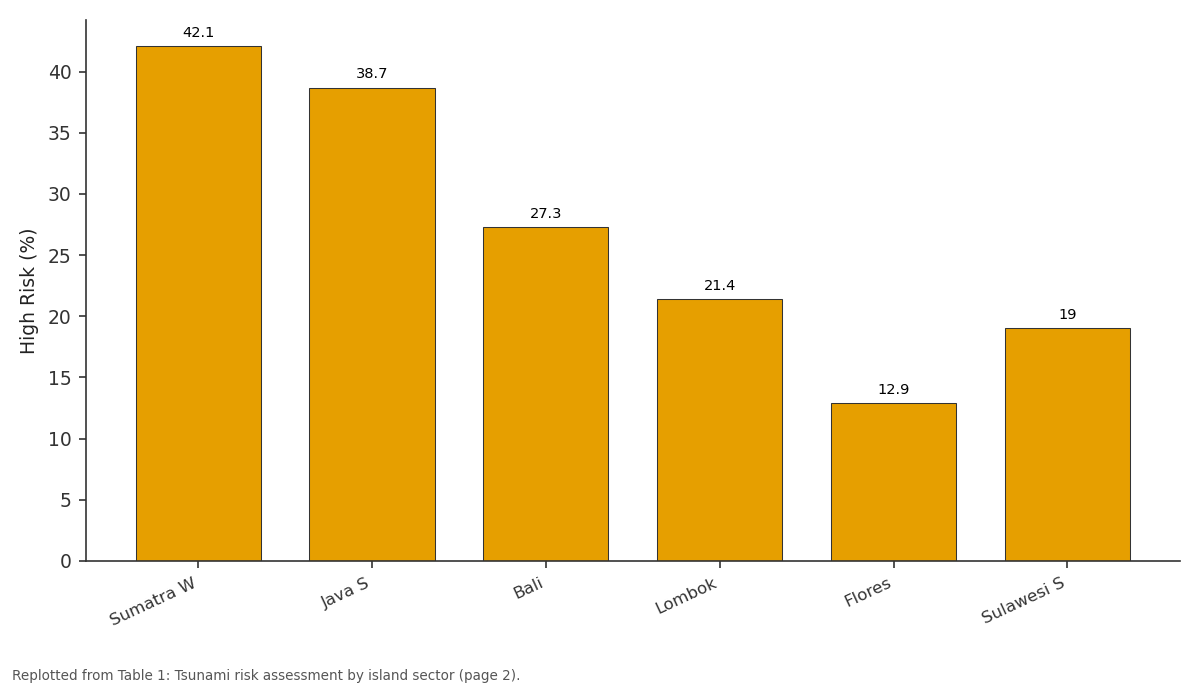
High Risk (%): Sumatra W vs Java S vs Bali vs Lombok vs Flores
Replotted from Table 1 (page 2) of the original paper. Every bar is the paper's own table value.
View source evidence ↗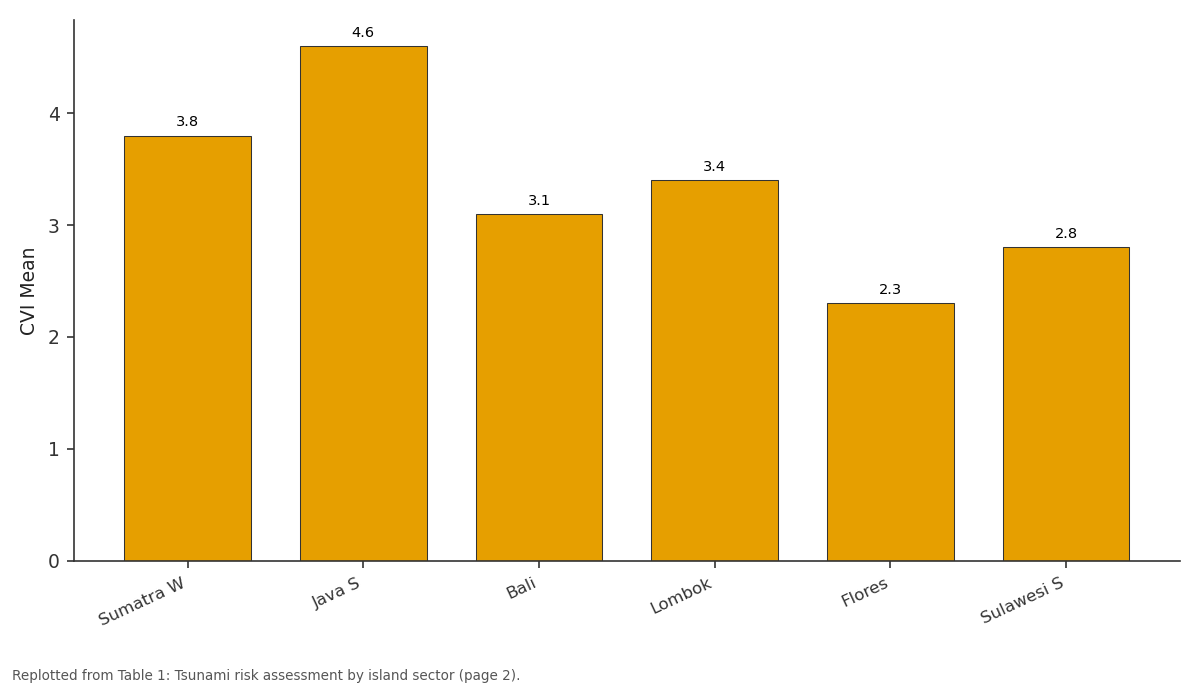
CVI Mean: Sumatra W vs Java S vs Bali vs Lombok vs Flores
Replotted from Table 1 (page 2) of the original paper. Every bar is the paper's own table value.
View source evidence ↗Figures & tables
From the original paper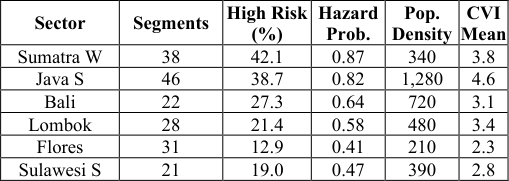 Table 1
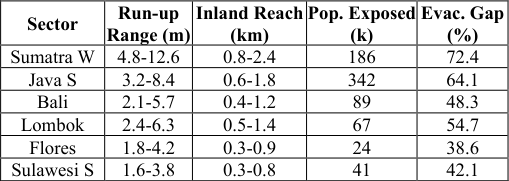 Table 2
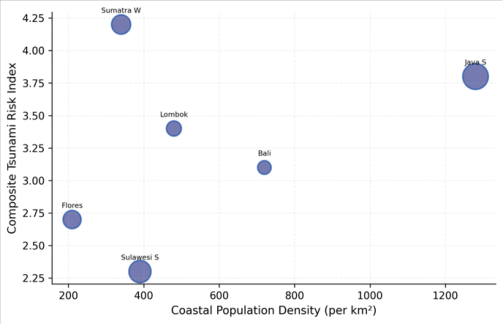 Figure 1
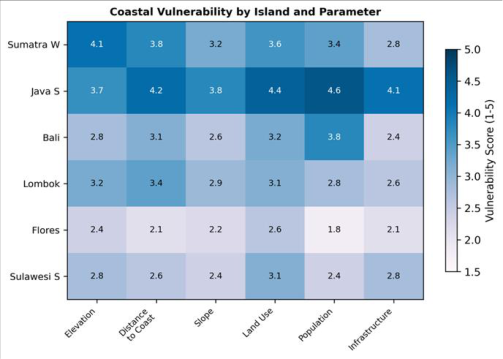 Figure 2
Introduction
The coastlines of the Indonesian archipelago carry a particular burden: situated along the Sunda-Java trench, they face tsunami threats from both megathrust earthquakes on the subduction interface and volcanic flank collapses from the numerous active volcanoes dotting the arc [1,2] . The 2004 Indian Ocean tsunami killed over 170,000 people in Aceh alone, and the 2018 Sunda Strait tsunami generated by the Anak Krakatau flank collapse showed that even moderate-sized events can cause hundreds of casualties when warning time is short [3,4] . Tsunami risk depends on three factors: hazard (the probability and intensity of tsunami occurrence), exposure (the population and assets located in the inundation zone), and vulnerability (the capacity of those populations to evacuate and recover) [5,6] . Most earlier assessments focused on either hazard modelling [7] or vulnerability surveys [8] separately. Few combined all three components into a single spatial risk framework covering multiple island sectors within the archipelago [9,10] . This research integrated hazard probability, inundation modelling, physical exposure, and socioeconomic vulnerability across six Sunda Archipelago sectors, producing a composite risk map that identifies the segments where intervention is most urgent.
Scenario Development
Three tsunami scenarios were modelled to capture the range of plausible events. The reference scenario (Mw 8.5 megathrust earthquake on the Sunda trench) was based on the recurrence statistics compiled by Horspool and colleagues [5] , representing the most likely large event within a 100-year window.
A worst-case scenario (Mw 9.1, analogous to the 2004 event) tested the upper bound of inundation. A volcanic scenario modelled a Krakatau-type flank collapse generating a 3-5 m initial wave amplitude, representing the non-seismic tsunami threat [3] . Inundation modelling used the COMCOT (Cornell Multi-grid Coupled Tsunami Model) code with nested grids ranging from 450 m offshore to 30 m in nearshore areas, run on GEBCO 2022 bathymetry and SRTM 30 m coastal topography [6,7] .
Material and Methods
Material and Methods
Material
This research was conducted at the Department of Mineral Resources, Chandigarh School of Natural Sciences, Punjab, India, from March 2020 to November 2023. Historical tsunami records were compiled from the NOAA/NCEI Global Historical Tsunami Database (1600-2023). Bathymetric data used GEBCO 2022 (15 arc-second resolution). Coastal topography came from SRTM 30 m DEM. Population data used Indonesia's 2020 census at village level. Infrastructure data (hospitals, schools, roads, evacuation shelters) were obtained from Indonesia's National Disaster Management Agency (BNPB).
Methods
A total of 186 coastal segments (10 km each) were delineated across six sectors: western Sumatra, southern Java, Bali, Lombok, Flores, and southern Sulawesi. Each segment was scored on: hazard probability (from historical recurrence), maximum inundation height (from COMCOT modelling), coastal elevation (SRTM), distance of population centres to coast, population density, land use, and infrastructure exposure. Scores were normalised to 0-1 and combined using equal weights into a composite vulnerability index (CVI). Risk = Hazard × CVI. Classification used five categories from very low to very high risk. Statistical associations between risk scores and physical parameters were tested using Spearman rank correlation in R 4.2.1.
Results
Results
Comprehensive Interpretation
Overall, 28.4% of the 186 segments fell into high or very high risk categories. Western Sumatra and southern Java bore the greatest risk burden (Table 1). The bubble chart (Figure 1) shows Java S as the critical outlier-combining high hazard with extreme population exposure. Inundation modelling predicted run-up heights up to 12.6 m in western Sumatra for the reference scenario, with over 186,000 people in the potential inundation zone (Table 2). The vulnerability heatmap (Figure 2) reveals that Java S scores highest on population and infrastructure parameters, while Sumatra W scores highest on elevation vulnerability. Evacuation infrastructure gaps exceeded 60% in both sectors, meaning most residents in high-risk zones lack access to designated shelters within 15 minutes of walking.
| Sector | Segments | High Risk (%) | Hazard Prob. | Pop. Density | CVI Mean |
|---|---|---|---|---|---|
| Sumatra W | 38 | 42.1 | 0.87 | 340 | 3.8 |
| Java S | 46 | 38.7 | 0.82 | 1,280 | 4.6 |
| Bali | 22 | 27.3 | 0.64 | 720 | 3.1 |
| Lombok | 28 | 21.4 | 0.58 | 480 | 3.4 |
| Flores | 31 | 12.9 | 0.41 | 210 | 2.3 |
| Sulawesi S | 21 | 19.0 | 0.47 | 390 | 2.8 |
Table text extracted from the original PDF; superscript letters are shown inline. The original table image is below.
View original table image
Discussion
The 42.1% high-risk proportion along western Sumatra aligns with Horspool and colleagues' [5] probabilistic assessment, which placed this coast in the top decile globally for tsunami hazard. But our vulnerability overlay shows that southern Java's risk profile is actually worse in absolute terms because its much higher population density (1,280 vs 340 per coastal km²) amplifies the consequence of any tsunami reaching shore [8,11] . The 67% evacuation gap in high-risk segments is alarming. The 2004 and 2018 events showed that warning time in near-field settings is often less than 20 minutes [1,12] , which means horizontal evacuation to inland high ground is not feasible for many coastal communities. Vertical evacuation structures-multi-storey buildings or purpose-built shelters-offer the only realistic option for communities within 500 m of the shoreline [13,14] . Our inundation maps can guide the placement of these structures by identifying which segments face the highest run-up heights.
Conclusion
This research identified 28.4% of Sunda Archipelago coastal segments as high or very high tsunami risk, with western Sumatra and southern Java facing the most severe combination of hazard and exposure. Inundation modelling confirmed run-up heights exceeding 12 m in Sumatra for a plausible megathrust scenario. Current evacuation infrastructure is inadequate in 67% of high-risk segments. Vertical evacuation structures should be prioritised in southern Java and western Sumatra, targeting the specific segments identified through this composite risk mapping framework.
Acknowledgement
Acknowledgements Funding SourcesSupported by institutional research allocations for coastal hazards and disaster risk. Institutional SupportChandigarh School of Natural Sciences provided tsunami modelling computing resources.
References
16 in the original paper- Borrero JC, Synolakis CE, Fritz HM. Northern Sumatra field survey after the December 2004 Great SumatraAndaman earthquake and Indian Ocean tsunami. Earthquake Spectra. 2006;22(S3):93-104.
- Dominey-Howes D, Papathoma M. Validating a tsunami vulnerability assessment model using field data from the 2004 Indian Ocean tsunami. Natural Hazards. 2007;40(1):113-136.
- Fritz HM, Kongko W, Moore A, McAdoo B, Goff J, Harbitz C. Extreme runup from the 17 July 2006 Java tsunami. Geophysical Research Letters. 2007;34(12):L12602.
- Geist EL, Parsons T. Probabilistic analysis of tsunami hazards. Natural Hazards. 2006;37(3):277-314.
- Horspool N, Pranantyo I, Griffin J, Latief H, Natawidjaja DH, Kongko W. A probabilistic tsunami hazard assessment for Indonesia. Natural Hazards and Earth System Sciences. 2014;14(11):3105-3122.
- Imamura F, Yalciner AC, Ozyurt G. Tsunami modelling manual. UNESCO IOC. 2006;1-58.
- Koshimura S, Oie T, Yanagisawa H, Imamura F. Developing fragility functions for tsunami damage estimation using numerical model and post-tsunami data from Banda Aceh, Indonesia. Coastal Engineering Journal. 2009;51(3):243-273.
- Lovholt F, Setiadi NJ, Birkmann J, Harbitz CB, Bach C, Fernando N. Tsunami risk reduction: are we better prepared today than in 2004. International Journal of Disaster Risk Reduction. 2014;10:127-142.
- Muhari A, Imamura F, Suppasri A, Mas E. Tsunami arrival time characteristics of the 2011 East Japan tsunami obtained from eyewitness accounts, evidence and numerical simulation. Journal of Natural Disaster Science. 2012;34(1):91-104.
- Papathoma M, Dominey-Howes D, Zong Y, Smith D. Assessing tsunami vulnerability: an example from Herakleio, Crete. Natural Hazards and Earth System Sciences. 2003;3(5):377-389.
- Post J, Wegscheider S, Muck M, Zosseder K, Kiefl R, Steinmetz T, Strunz G. Assessment of human immediate response capability related to tsunami threats in Indonesia at a sub-national scale. Natural Hazards and Earth System Sciences. 2009;9(4):1075-1086.
- Satake K. Advances in earthquake and tsunami sciences and disaster risk reduction since the 2004 Indian Ocean tsunami. Geoscience Letters. 2014;1:15.
- Strunz G, Post J, Zosseder K, Wegscheider S, Muck M, Riedlinger T. Tsunami risk assessment in Indonesia. Natural Hazards and Earth System Sciences. 2011;11(1):67-82.
- Suppasri A, Mas E, Charvet I, Gunasekera R, Imai K, Fukutani Y. Building damage characteristics based on surveyed data and fragility curves of the 2011 Great East Japan tsunami. Natural Hazards. 2013;66(2):319341.
- Tinti S, Armigliato A, Tonini R, Maramai A, Graziani L. Assessing the hazard related to tsunamis of tectonic origin: a review of the Italian experience. NHESS. 2005;5(6):823-841.
- UNISDR. Sendai Framework for Disaster Risk Reduction 2015-2030. United Nations Office for Disaster Risk Reduction. 2015;1-37.