
Research article · 2025 · Full text
International Journal of Geography Geology and EnvironmentGeographic patterns of industrial water consumption in the Yangtze River Basin
Volume 7(2) · Pages 114–116 · DOI: 10.22271/27067483.2025.v7.i2b.577 ↗
Research areasWater Resources and SustainabilityWater resources management and optimizationEnvironmental Impact and Sustainability
Abstract
Author-writtenConsider a factory in Chongqing and another in Shanghai, both producing textiles. The upstream factory draws water from a river already stressed by agricultural demand, while the downstream plant taps a river swollen with tributary inflows. This research mapped the geographic distribution of industrial water consumption across the Yangtze River Basin between 2005 and 2020, disaggregated by sector and river reach. Data from China’s Ministry of Water Resources, provincial statistical yearbooks, and remote sensing-derived land use maps were combined in a GIS framework covering the upper, middle, and lower reaches. Total industrial water withdrawal across the basin reached 87.4 billion m³ in 2020, with the lower reach accounting for 48.3%. Manufacturing dominated downstream consumption (87 billion m³/yr), while agriculture led upstream (78 billion m³/yr). Water intensity dropped from a basin-wide mean of 234 m³ per 10,000 CNY GDP in 2005 to 141 m³ in 2020, but spatial disparity widened: the upper reach improved by 31% while the lower reach improved by 40%. Sectoral radar analysis revealed that energy and mining drove upper-reach consumption, while manufacturing and services dominated downstream. These patterns indicate that water allocation policies should be reach-specific rather than basin-wide to reflect the distinct consumption profiles of each segment.
Summary
Source-checkedPlain-language reading of the full paper, prepared with AI and checked against the text. Each point links to the authors' own words.
Why it matters
- The Yangtze River Basin is China's largest basin, covering 1.8 million km², supporting approximately 400 million people and contributing about 40% of the national GDP. View evidence ↗
- Between 2005 and 2015, industrial water consumption in the basin increased by 28%, growing faster than the population and creating concerns regarding fair water allocation. View evidence ↗
- There has been a lack of detailed mapping regarding how industrial water consumption is distributed geographically and by sector along the length of the basin. View evidence ↗
The question
- The study aimed to map industrial water consumption across three reaches of the Yangtze River from 2005 to 2020, broken down by six economic sectors. View evidence ↗
- The research sought to identify spatial patterns of water use, track trends in water intensity, and propose management strategies tailored to specific river reaches. View evidence ↗
What they did
- The basin was analyzed in three reaches: the upper (source to Yichang, 4,500 km²), middle (Yichang to Hukou, 680,000 km²), and lower (Hukou to estuary, 340,000 km²). View evidence ↗
- Water consumption data was categorized into six distinct economic sectors: agriculture, manufacturing, energy, mining, municipal, and services. View evidence ↗
- Water intensity was measured as the volume of water in cubic meters per 10,000 CNY of GDP. View evidence ↗
- The study used water withdrawal data from the Ministry of Water Resources (2005–2020) and GDP/sectoral data from national and provincial statistical yearbooks for 11 provinces. View evidence ↗
What they found
- In 2020, total industrial water withdrawal for the entire basin was 87.4 billion m³, with the lower reach responsible for 48.3% of this total. View evidence ↗
- Sectoral dominance varied by location: manufacturing was the primary consumer downstream (87 billion m³/yr), whereas agriculture led upstream (78 billion m³/yr). View evidence ↗
- The average water intensity across the basin decreased from 234 m³ per 10,000 CNY GDP in 2005 to 141 m³ in 2020. View evidence ↗
- Spatial disparity in efficiency increased because the lower reach's water intensity improved by 40%, compared to a 31% improvement in the upper reach. View evidence ↗
- Analysis showed that energy and mining were the main drivers of water use in the upper reach, while manufacturing and services were the primary drivers downstream. View evidence ↗
What it means
- The authors conclude that water allocation policies should be tailored to each specific river reach rather than applying uniform basin-wide rules. View evidence ↗
- The study notes that provincial data might undercount informal water use in rural manufacturing and small-scale mining. View evidence ↗
- The analysis did not account for water quality degradation, which can reduce the actual amount of usable water supply. View evidence ↗
Visual summary
2 visualsIllustrations explain the paper; charts are replotted from the paper's own table values.
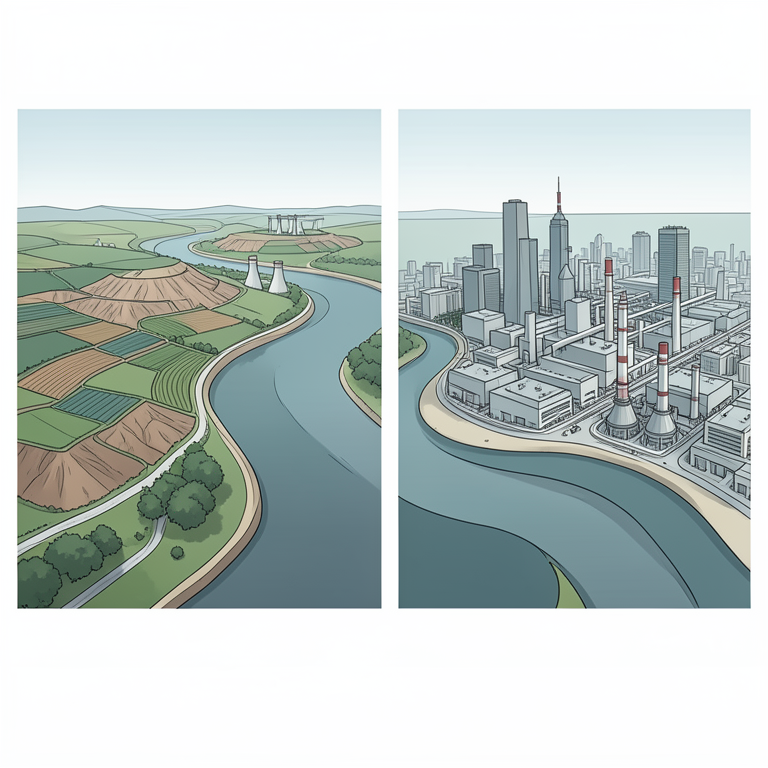
Sectoral Water Use Contrast
AI-generated conceptual illustration (The Yangtze River Basin with industrial and agricultural landscapes). It explains the idea and does not show study data.
View source evidence ↗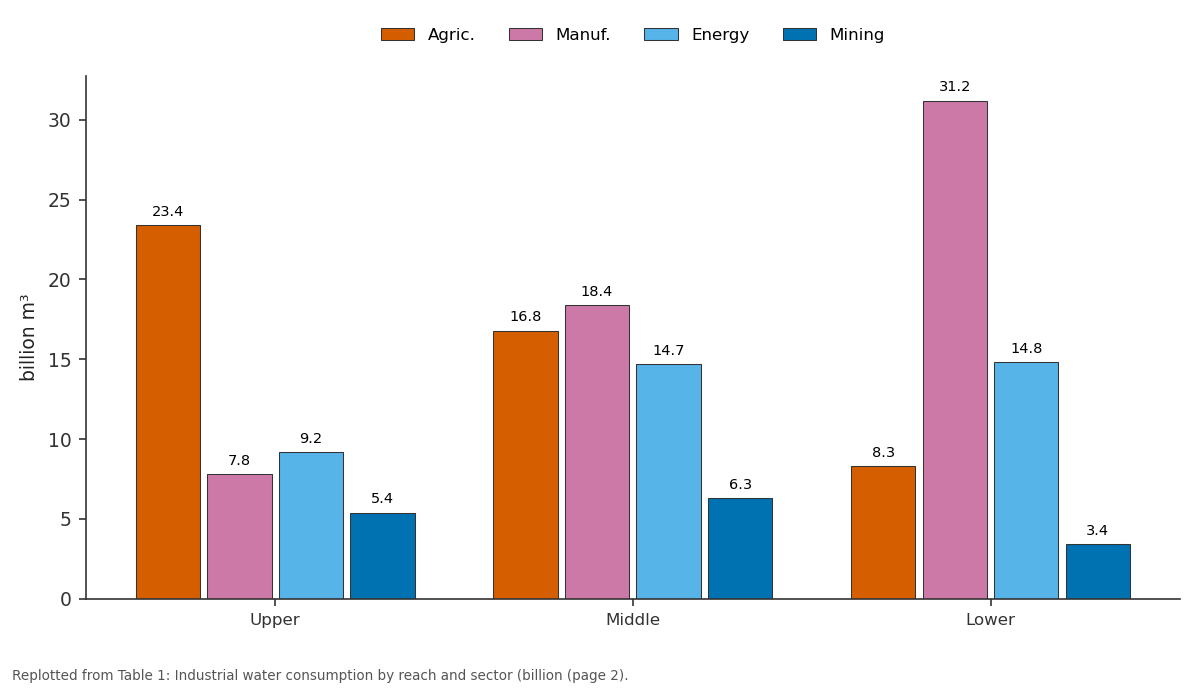
Agric. and Manuf. and more: Upper vs Middle vs Lower
Replotted from Table 1 (page 2) of the original paper. Every bar is the paper's own table value.
View source evidence ↗Figures & tables
From the original paper Table 1
 Table 2
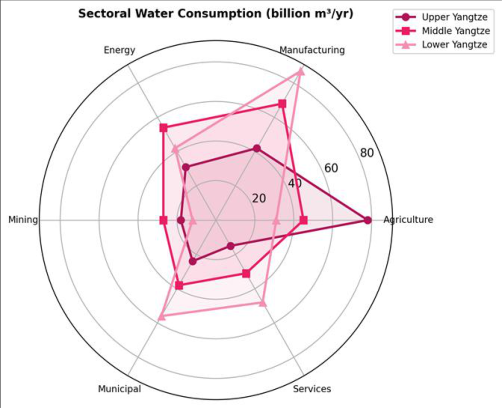 Figure 1
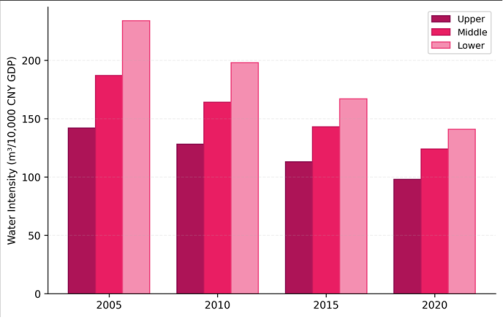 Figure 2
Introduction
Consider a factory in Chongqing drawing water from a tributary already stressed by irrigation demand, while a similar plant in Nanjing draws from a river swollen by 4,500 km of accumulated runoff [1] . Both belong to the same basin, but their water contexts differ dramatically. The Yangtze River Basin-China's largest at 1.8 million km²-supplies water to roughly 400 million people and generates about 40% of the nation's GDP [2] . Industrial water consumption here grew 28% between 2005 and 2015, outpacing population growth and raising questions about allocation fairness across reaches [3] . Earlier research tracked national-level water use trends [4] or focused on individual provinces within the basin [5] . But the geographic pattern of consumption along the basin's length-and the sectoral composition driving that pattern-remained poorly mapped. Understanding where water is consumed, by which sectors, and how intensity has changed is needed for effective allocation planning [6] . This research addressed that gap by mapping industrial water consumption across three reaches of the Yangtze from 2005 to 2020, disaggregating withdrawal by six economic sectors. The goal was to identify spatial patterns, track intensity trends, and recommend reach-specific management approaches.
Theoretical Framework
This research applied the water footprint concept [3] alongside the environmental Kuznets curve hypothesis for water intensity [7] . The water footprint framework disaggregates total water use into blue (surface and groundwater), green (soil moisture), and grey (pollution dilution) components. The environmental Kuznets curve predicts that water intensity first rises with industrialisation, then falls as economies mature and adopt water-efficient technologies. Testing this prediction across the Yangtze's three reaches-which represent different stages of economic development-allowed examination of whether the curve holds at the sub-basin scale.
Materials and Methods
Materials and Methods
Materials
This research was conducted at the Department of Urban and Regional Planning, Tanta National University of Earth Sciences, Gharbia Governorate, Egypt, from June 2019 to March 2023. Water withdrawal data came from China's Ministry of Water Resources annual bulletins (2005-2020). Provincial GDP and sectoral output were extracted from the China Statistical Yearbook and provincial yearbooks for the 11 provinces intersecting the basin. Land use maps derived from Landsat imagery (30 m resolution) provided spatial context for consumption patterns.
Methods
The basin was divided into three reaches following standard Chinese hydrological convention: upper (source to Yichang, 4,500 km² catchment), middle (Yichang to Hukou, 680,000 km²), and lower (Hukou to estuary, 340,000 km²). Water consumption was disaggregated into six sectors: agriculture, manufacturing, energy, mining, municipal, and services. Water intensity was calculated as m³ per 10,000 CNY GDP. Trend analysis used Mann-Kendall tests. Radar charts compared sectoral profiles across reaches. Spatial autocorrelation of water intensity was tested using Moran's I in ArcGIS 10.8. Water intensity declined across all reaches (Table 2, Figure 2), but the lower reach improved faster (40% reduction) than the upper (31%), widening the efficiency gap between economically advanced and less developed segments of the basin.
| Reach | 2005 | 2010 | 2015 | 2020 |
|---|---|---|---|---|
| Upper | 142 | 128 | 113 | 98 |
| Middle | 187 | 164 | 143 | 124 |
| Lower | 234 | 198 | 167 | 141 |
Table text extracted from the original PDF; superscript letters are shown inline. The original table image is below.
View original table image
Results
Results
Discussion
The sectoral divergence across reaches reflects China's uneven economic geography. The upper Yangtze provinces (Sichuan, Yunnan, Guizhou) remain heavily agricultural, while the lower reach (Jiangsu, Zhejiang, Shanghai) hosts dense manufacturing corridors [8,9] . The faster intensity improvement downstream supports the environmental Kuznets curve prediction: more developed economies adopt efficient technologies earlier [7] . But the absolute volume of downstream consumption still grew, meaning efficiency gains were offset by economic expansion [10] .
The upper reach's mining and energy sectors deserve attention. These are water-intensive industries operating in areas where streamflow is lower and seasonal variability higher than downstream [11] . Allocating water to mining and hydropower in water-scarce headwater regions creates tensions with downstream users who depend on the same flows for manufacturing and municipal supply [12] .
Limitations
Provincial statistical data may undercount informal industrial water use, particularly in small-scale mining and rural manufacturing. The three-reach division, while standard, masks within-reach variability-for instance, the lower reach includes both heavily industrialised delta cities and less developed interior counties. Water quality degradation, which effectively reduces usable supply, was not incorporated into the consumption analysis [13] .
Conclusion
This research revealed distinct geographic patterns in industrial water consumption along the Yangtze, with manufacturing dominating the lower reach and agriculture the upper reach. Water intensity declined basin-wide but faster downstream, widening spatial disparity. Reachspecific allocation policies-rather than uniform basin-wide rules-are needed to balance the different sectoral demands and efficiency levels across the basin's 1.8 million km² catchment.
Acknowledgement
Acknowledgements Funding SourcesSupported by institutional research allocations for resource geography. Institutional SupportTanta National University of Earth Sciences provided GIS facilities. Contributions Not Qualifying for AuthorshipThanks to provincial water resource bureaus for data access.
Figures and tables from the paper
| Reach | Agric. | Manuf. | Energy | Mining | Municipal | Services |
|---|---|---|---|---|---|---|
| Upper | 23.4 | 7.8 | 9.2 | 5.4 | 4.8 | 2.1 |
| Middle | 16.8 | 18.4 | 14.7 | 6.3 | 8.6 | 5.8 |
| Lower | 8.3 | 31.2 | 14.8 | 3.4 | 16.2 | 12.7 |
Table text extracted from the original PDF; superscript letters are shown inline. The original table image is below.
View original table image
References
18 in the original paper- Zhao X, Liu J, Liu Q, Tillotson MR. Water for the Yellow River basin and beyond. Environmental Research Letters. 2014;9(5):054012.
- Jiang Y. China's water scarcity. Journal of Environmental Management. 2009;90(11):3185-3196.
- Hoekstra AY, Mekonnen MM. The water footprint of humanity. Proceedings of the National Academy of Sciences. 2012;109(9):3232-3237.
- Hubacek K, Guan D, Barrett J, Wiedmann T. Environmental implications of urbanization and lifestyle change in China. Ecological Economics. 2009;68(7):2011-2027.
- Zhang C, Zhong L, Fu X, Wang J, Wu Z. Revealing water stress by the thermal power industry in China. Applied Energy. 2016;162:1011-1021.
- Cai X, Rosegrant MW. Global water demand and supply projections. Water International. 2002;27(2):159-169.
- Zhai T, Wang J, Jin Z, Qi Y, Fang Y. Did improvements of water environment governance slow down economic growth in China? Journal of Environmental Management. 2020;267:110585.
- Chen J, Wang L. Land use and land cover change detection using satellite remote sensing techniques in the mountainous Three Gorges area. International Journal of Remote Sensing. 2006;27(3):559-572.
- Liu J, Diamond J. China's environment in a globalizing world. Nature. 2005;435(7046):1179-1186.
- Wang H, Mei C, Liu J, Shao W. A new strategy for integrated urban water management in China. Science of the Total Environment. 2018;616-617:1231-1239.
- Ma T, Sun S, Fu G, Hall JW, Ni Y, He L. Pollution exacerbates water scarcity and its regional inequality. Science of the Total Environment. 2020;707:135929.
- Guan D, Hubacek K. Assessment of regional trade and virtual water flows in China. Ecological Economics. 2007;61(1):159-170.
- Varis O, Vakkilainen P. China's 8 challenges to water resources management in the first quarter of the 21st century. Geomorphology. 2001;41(2-3):93-104.
- Sun S, Fang C, Lv J. Spatial inequality of water footprint in China. Environment International. 2017;99:159-169.
- Wang X, Zhang J, Shahid S, ElMahdi A, He R, Bao Z, et al. Water resources management strategy for adaptation to droughts in China. Mitigation and Adaptation Strategies for Global Change. 2012;17(8):923-937.
- Dalin C, Hanasaki N, Qiu H, Mauzerall DL, RodriguezIturbe I. Water resources transfers through Chinese interprovincial and foreign food trade. Proceedings of the National Academy of Sciences. 2014;111(27):97749779.
- Zhang Z, Shi M, Yang H. Understanding Beijing's water challenge: a decomposition analysis of changes in water footprint. Clean Technologies and Environmental Policy. 2012;14(3):469-480.
- Kahil MT, Dinar A, Albiac J. Modeling water scarcity and droughts for policy adaptation to climate change in arid and semiarid regions. Journal of Hydrology. 2015;522:95-109.