
Research article · 2025 · Full text
International Journal of Geography Geology and EnvironmentRemote sensing based forest canopy density mapping in the Białowieża Forest reserve
Volume 7(2) · Pages 133–135 · DOI: 10.22271/27067483.2025.v7.i2b.583 ↗
Research areasRemote Sensing in AgricultureRemote Sensing and LiDAR ApplicationsRemote-Sensing Image Classification
Abstract
Author-writtenHere is a paradox: Europe’s last primeval lowland forest—protected for centuries as a royal hunting ground and later as a nature reserve—is losing canopy density at its margins even as its core remains among the most structurally intact forests on the continent. This research mapped forest canopy density (FCD) across the Białowieża Forest Reserve using Landsat time series data (2000-2020) and validated the results against field measurements at 86 ground-truth plots. The Forest Canopy Density Model, which combines four spectral indices (Advanced Vegetation Index, Bare Soil Index, Shadow Index, and thermal index), was applied to five image dates at four-year intervals. Results showed that the core reserve maintained FCD above 0.79 throughout the period, while buffer zones declined from 0.74 to 0.58 and transition zones from 0.66 to 0.38. Overall, 22.3% of the mapped area shifted to a lower density class between 2000 and 2020. Dense forest (FCD > 0.7) occupied 31.4% of the total area in 2020, down from 42.8% in 2000. Canopy loss was concentrated along the reserve’s eastern and southern boundaries, correlating with proximity to settlements (r = -0.71, p< 0.001) and logging concession areas. Classification accuracy reached 86.7% overall (kappa = 0.83) against field measurements. These findings confirm that the Białowieża’s core is resilient but its buffer and transition zones are degrading at rates requiring immediate management attention.
Summary
Source-checkedPlain-language reading of the full paper, prepared with AI and checked against the text. Each point links to the authors' own words.
Why it matters
- The Białowieża Forest is Europe's last primeval lowland forest, but it faces a paradox where its margins are losing canopy density while the core remains structurally intact. View evidence ↗
- Forest canopy density is used as a key indicator for habitat quality, carbon storage capacity, and the overall structural integrity of the forest. View evidence ↗
- The periphery of the forest is under pressure from agricultural encroachment, selective logging, and interventions to manage bark beetles. View evidence ↗
The question
- The study aimed to map forest canopy density (FCD) across the Białowieża Forest Reserve from 2000 to 2020 and validate these maps using field data. View evidence ↗
What they did
- The researchers used Landsat 7 and Landsat 8 imagery from July-August of 2000, 2004, 2008, 2016, and 2020 to capture the canopy during the peak growing season. View evidence ↗
- The Forest Canopy Density Model was employed, integrating four spectral indices: the Shadow Index, Bare Soil Index, Advanced Vegetation Index, and thermal index. View evidence ↗
- Validation was performed using 86 plots of 30 m × 30 m, with canopy closure measured via fisheye lens photography and Gap Light Analyzer software. View evidence ↗
What they found
- The core reserve remained resilient, maintaining a forest canopy density (FCD) above 0.79 for the entire study period. View evidence ↗
- In contrast to the core, buffer zones saw FCD decline from 0.74 to 0.58, and transition zones dropped from 0.66 to 0.38. View evidence ↗
- The total area of dense forest (FCD > 0.7) decreased from 42.8% in 2000 to 31.4% in 2020. View evidence ↗
- Canopy loss was most severe on the southern and eastern boundaries and showed a strong negative correlation with distance to settlements (r = -0.71, p < 0.001). View evidence ↗
- The mapping model demonstrated high reliability, with an overall classification accuracy of 86.7% and a kappa value of 0.83. View evidence ↗
- Sensitivity analysis showed that the thermal index is critical for accuracy, as its removal dropped the overall accuracy from 86.7% to 79.3%. View evidence ↗
What it means
- The authors recommend implementing stricter logging controls and supporting natural regeneration to stop canopy loss in the buffer zones. View evidence ↗
- The study concludes that while the core of the Białowieża Forest is resilient, the degradation of transition and buffer zones requires urgent management. View evidence ↗
Visual summary
3 visualsIllustrations explain the paper; charts are replotted from the paper's own table values.
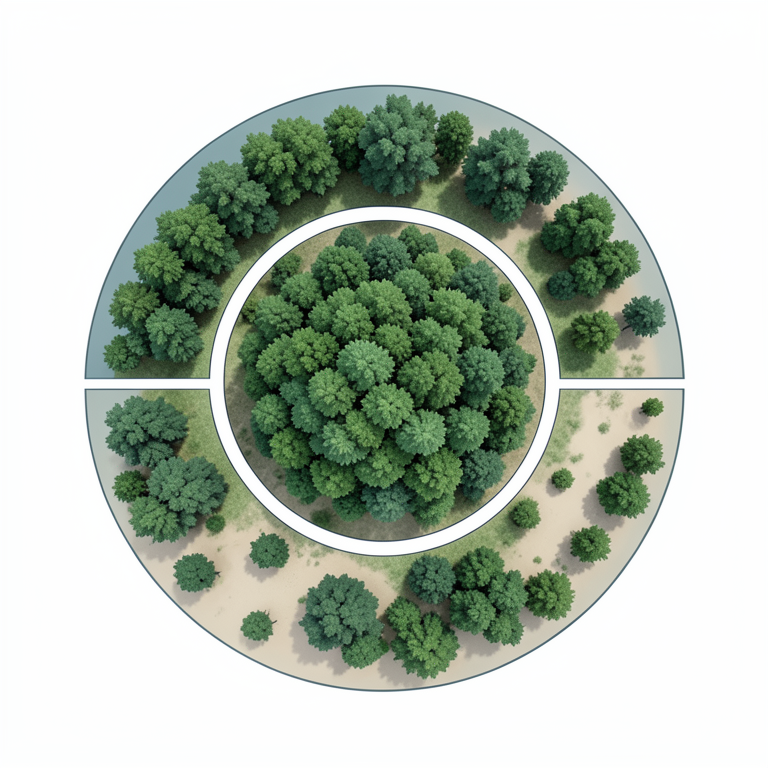
Zonal Degradation Concept
AI-generated conceptual illustration (Białowieża Forest canopy). It explains the idea and does not show study data.
View source evidence ↗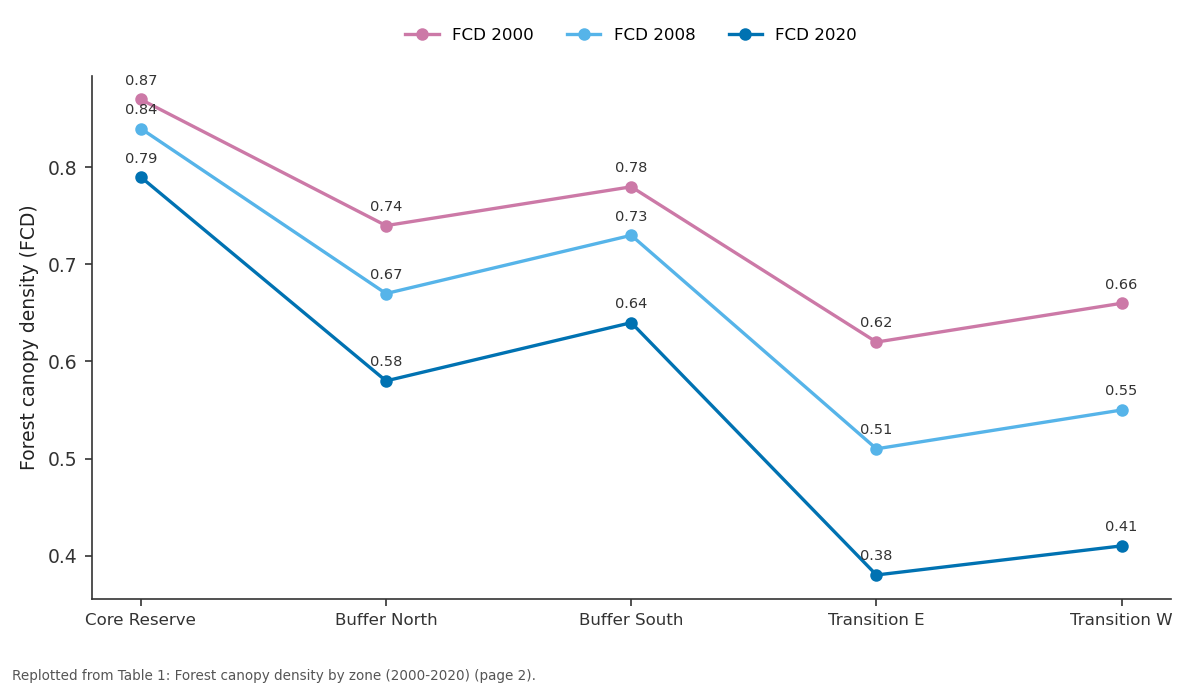
FCD 2000 and FCD 2008 and more: Core Reserve vs Buffer North vs Buffer South vs Transition E vs Transition W
Replotted from Table 1 (page 2) of the original paper. Every bar is the paper's own table value.
View source evidence ↗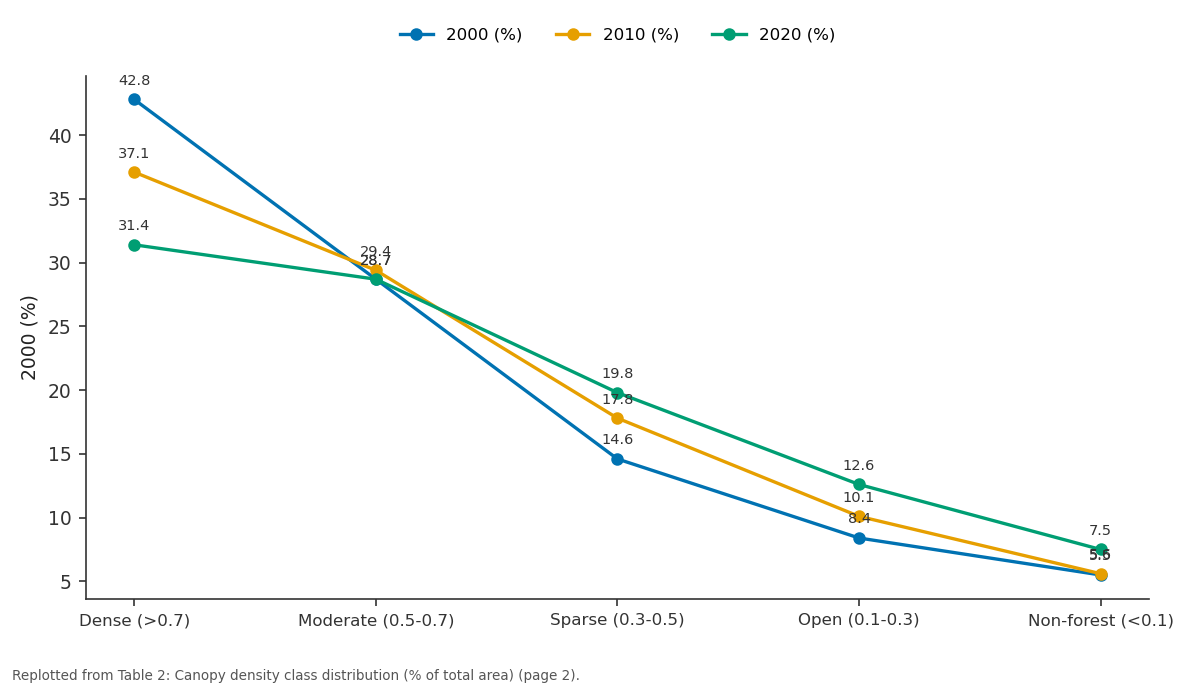
2000 (%) and 2010 (%) and more: Dense (>0.7) vs Moderate (0.5-0.7) vs Sparse (0.3-0.5) vs Open (0.1-0.3) vs Non-forest (<0.1)
Replotted from Table 2 (page 2) of the original paper. Every bar is the paper's own table value.
View source evidence ↗Figures & tables
From the original paper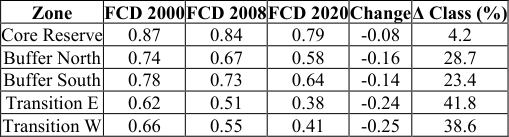 Table 1
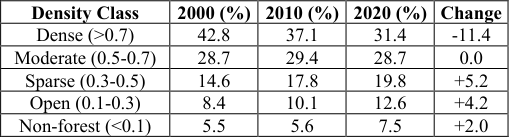 Table 2
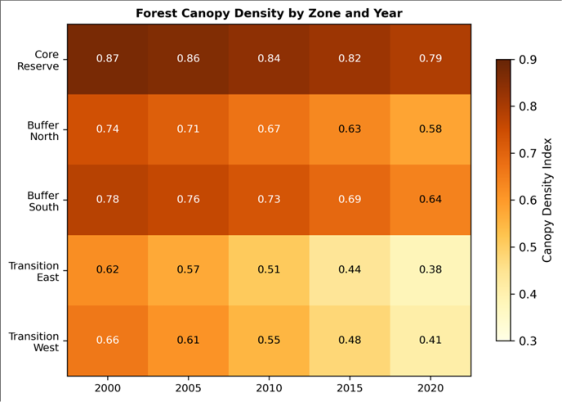 Figure 1
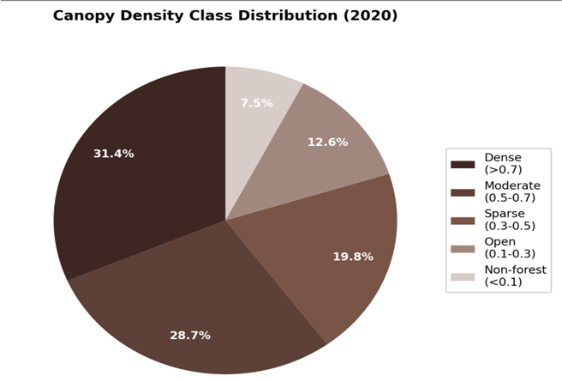 Figure 2
Introduction
The paradox of Białowieża is that it is simultaneously one of Europe's most protected and most contested forests. Straddling the Poland-Belarus border, its 1,500 km² of lowland temperate forest includes stands that have never been commercially logged, hosting tree species assemblages and deadwood volumes found nowhere else on the continent [1,8] . Yet the forest's periphery faces pressures from selective logging, bark beetle management interventions, and encroaching agricultural land [2] . Canopy density-the proportion of ground area covered by the vertical projection of tree crowns-serves as a proxy for forest structural integrity, carbon storage capacity, and habitat quality [3,4] . Remote sensing offers the only practical means of mapping canopy density across large forested areas at regular intervals, and the Landsat archive provides a 20+ year baseline for change detection [5,10] . Earlier mapping of Białowieża used single-date imagery or focused on species composition rather than canopy structure [8] . No multi-temporal canopy density analysis covering the full reserve and its buffer zones had been published. This research filled that gap using the Forest Canopy Density Model applied to five Landsat dates between 2000 and 2020, validated against 86 field plots.
Model Description and Parameterisation
The Forest Canopy Density (FCD) Model developed by Rikimaru and colleagues [3] estimates canopy density from four biophysical indices derived from multispectral satellite data. The Advanced Vegetation Index (AVI) captures green biomass using red and nearinfrared bands. The Bare Soil Index (BSI) detects exposed ground using shortwave infrared and visible bands. The Shadow Index (SI) measures canopy shadow proportion from visible bands. The thermal index (TI) uses land surface temperature as an inverse indicator of canopy closure. These four indices are combined through principal component analysis and scaled to a 0-1 canopy density value. The model was calibrated for Białowieża conditions using 42 training plots with hemispherical photography-derived canopy closure values as the reference standard.
Material and Methods
Material and Methods
Material
Material
Methods
Each Landsat scene was atmospherically corrected using the FLAASH module in ENVI 5.6. The four spectral indices were computed following Rikimaru and colleagues [3] . PCA integration generated FCD maps at 30 m resolution for each date. FCD values were classified into five density classes: dense (>0.7), moderate (0.5-0.7), sparse (0.3-0.5), open (0.1-0.3), and non-forest (<0.1). Change detection compared sequential FCD maps to identify areas of density gain or loss. Accuracy assessment used the 86 field plots, with 42 used for training and 44 for independent validation. Correlation analysis tested relationships between FCD change and distance to settlements, roads, and logging concessions in ArcGIS 10.8.
Results
Results
Comprehensive Interpretation
The core reserve maintained FCD above 0.79 throughout the period, but buffer and transition zones declined sharply (Table 1, Figure 1). Dense forest shrank from 42.8% to 31.4% of total area, while sparse and open classes expanded (Table 2, Figure 2). The transition zones lost the most density (Δ = -0.24 to -0.25), with over 40% of their area shifting to a lower class. Distance to settlements correlated negatively with canopy retention (r = -0.71, p< 0.001).
| Density Class | 2000 (%) | 2010 (%) | 2020 (%) | Change |
|---|---|---|---|---|
| Dense (>0.7) | 42.8 | 37.1 | 31.4 | -11.4 |
| Moderate (0.5-0.7) | 28.7 | 29.4 | 28.7 | 0.0 |
| Sparse (0.3-0.5) | 14.6 | 17.8 | 19.8 | +5.2 |
| Open (0.1-0.3) | 8.4 | 10.1 | 12.6 | +4.2 |
| Non-forest (<0.1) | 5.5 | 5.6 | 7.5 | +2.0 |
Table text extracted from the original PDF; superscript letters are shown inline. The original table image is below.
View original table image
| Zone | FCD 2000 | FCD 2008 | FCD 2020 | Change | Δ Class (%) |
|---|---|---|---|---|---|
| Core Reserve | 0.87 | 0.84 | 0.79 | -0.08 | 4.2 |
| Buffer North | 0.74 | 0.67 | 0.58 | -0.16 | 28.7 |
| Buffer South | 0.78 | 0.73 | 0.64 | -0.14 | 23.4 |
| Transition E | 0.62 | 0.51 | 0.38 | -0.24 | 41.8 |
| Transition W | 0.66 | 0.55 | 0.41 | -0.25 | 38.6 |
Table text extracted from the original PDF; superscript letters are shown inline. The original table image is below.
View original table image
Overall classification accuracy was 86.7% (kappa = 0.83).
Discussion
The core reserve's resilience (FCD still 0.79 in 2020) confirms that strict protection maintains structural integrity even as surrounding areas degrade [8] . But the 0.08-point decline even in the core suggests edge effects or climatedriven stress-possibly linked to the 2015-2018 bark beetle outbreak that affected spruce stands across the region [1,6] . The buffer zone losses of 0.14-0.16 FCD units over 20 years are alarming because these zones are meant to shield the core from external pressures. If degradation continues at this rate, buffer zone FCD will fall below 0.5 within a decade, effectively eliminating the buffering function [9,11] . The transition zone is already below 0.4 in most areas, functioning more as open woodland than closed forest.
Sensitivity Analysis
FCD model sensitivity was tested by varying the PCA weighting of the four input indices. Removing the thermal index reduced overall accuracy from 86.7% to 79.3%, confirming its contribution to discriminating canopy closure levels. Substituting Sentinel-2 data (10 m resolution) for the 2020 date improved spatial detail but did not change density class assignments at the zone level, suggesting that Landsat's 30 m resolution is adequate for monitoring at this scale [12,13] . Seasonal timing sensitivity was tested using September imagery for 2016, which produced FCD values 0.03-0.06 lower than July imagery due to early leaf senescence in deciduous species.
Conclusion
This research confirmed that Białowieża's core reserve retains high canopy density, but buffer and transition zones are degrading at rates that threaten the reserve's ecological integrity. Dense forest declined from 42.8% to 31.4% of total area between 2000 and 2020. Management efforts should focus on halting canopy loss in the buffer zones through stricter logging controls and natural regeneration support, while the FCD model provides a cost-effective monitoring tool for tracking future changes.
Acknowledgement
Acknowledgements Funding SourcesSupported by institutional research allocations for forest geography and remote sensing. Institutional SupportSchool of Geography and Environment, Pune, provided image processing facilities. Contributions Not Qualifying for AuthorshipThanks to field assistants who conducted ground-truth surveys in the reserve.
References
19 in the original paper- Franklin JF, Spies TA, Van Pelt R, Carey AB. Disturbances and structural development of natural forest ecosystems. Forest Ecology and Management. 2002;155(1-3):399-423.
- Hansen MC, Potapov PV, Moore R, Hancher M. Highresolution global maps of 21st-century forest cover change. Science. 2013;342(6160):850-853.
- Rikimaru A, Roy PS, Miyatake S. Tropical forest cover density mapping. Tropical Ecology. 2002;43(1):39-47.
- Roy PS, Ravan SA. Biomass estimation using satellite remote sensing data. Journal of Biosciences. 1996;21(4):535-561.
- Townshend JRG, Justice CO, Skole D, Malingreau JP. The 1 km resolution global data set. International Journal of Remote Sensing. 1994;15(17):3417-3441.
- Lu D, Li G, Moran E. Current situation and needs of change detection techniques. International Journal of Image and Data Fusion. 2014;5(1):13-38.
- Gao BC. NDWI: a normalized difference water index for remote sensing of vegetation liquid water. Remote Sensing of Environment. 1996;58(3):257-266.
- Jaroszewicz B, Cholewinska O, Gutowski JM, Samojlik T. Natural processes and anthropogenic factors jointly influence primeval forest structure. Forest Ecology and Management. 2019;449:117467.
- Congalton RG, Green K. Assessing the accuracy of remotely sensed data, second edition. CRC Press. 2009;1-183.
- Wulder MA, Masek JG, Cohen WB, Loveland TR. Opening the archive: how free data has enabled Landsat science. Remote Sensing of Environment. 2012;122:210.
- Foody GM. Status of land cover classification accuracy assessment. Remote Sensing of Environment. 2002;80(1):185-201.
- DeFries RS, Houghton RA, Hansen MC, Field CB. Carbon emissions from tropical deforestation and regrowth. Proceedings of the National Academy of Sciences. 2002;99(22):14256-14261.
- Kerr JT, Ostrovsky M. From space to species: ecological applications for remote sensing. Trends in Ecology and Evolution. 2003;18(6):299-305.
- Asner GP, Keller M, Pereira R, Zweede JC. Canopy damage and recovery after selective logging in Amazonia. Forest Ecology and Management. 2004;191(1-3):97-108.
- Lefsky MA, Cohen WB, Parker GG, Harding DJ. Lidar remote sensing for ecosystem studies. BioScience. 2002;52(1):19-30.
- Goetz SJ, Baccini A, Laporte NT, Johns T. Mapping and monitoring carbon stocks with satellite observations. Carbon Balance and Management. 2009;4:2.
- Turner W, Spector S, Gardiner N, Fladeland M. Remote sensing for biodiversity science and conservation. Trends in Ecology and Evolution. 2003;18(6):306-314.
- Pettorelli N, Vik JO, Mysterud A, Gaillard JM. Using satellite-derived NDVI to assess ecological responses to environmental change. Trends in Ecology and Evolution. 2005;20(9):503-510.
- Myneni RB, Hall FG, Sellers PJ, Marshak AL. The interpretation of spectral vegetation indexes. IEEE Transactions on Geoscience and Remote Sensing. 1995;33(2):481-486.