
Research article · 2025 · Full text
International Journal of Geography Geology and EnvironmentSustainable sand mining practices and river morphological response in the Niger Basin
Volume 7(5) · Pages 41–45 · DOI: 10.22271/27067483.2025.v7.i5a.591 ↗
Research areasHydrology and Sediment Transport ProcessesCoastal and Marine DynamicsGeological formations and processes
Abstract
Author-writtenAn estimated 40 to 50 billion tonnes of sand and gravel are extracted from rivers, coastlines, and quarries each year worldwide, making sand the most consumed natural resource after water. A large share of this extraction occurs informally in tropical river basins across West Africa, where demand for construction aggregate has surged alongside rapid urbanisation. This research examined the relationship between sand mining intensity and river channel morphological change along five reaches of the Niger River basin, spanning from the upper catchment near Bamako (Mali) through the middle and lower sections in Nigeria. Satellite-derived channel planforms from Landsat imagery (2015-2023) were compared with field-based cross-sectional surveys conducted between January and September 2022 at 35 monitoring transects. Extraction volumes were estimated through interviews with mining operators and local government records. Results indicated that the middle Niger reach near Ségou experienced the greatest channel bed degradation, averaging 4.4 m of incision over eight years, while the Mopti reach showed the least change at 2.6 m. Sand extraction rates correlated positively with channel widening (r = 0.81, p<0.01) and negatively with bank stability indices (r = −0.67, p<0.05). Reaches where regulated extraction quotas had been enforced since 2018 showed 31.7% less bed lowering compared with unregulated sites. The findings suggest that simple management interventions-fixed seasonal extraction calendars and volume caps-can slow morphological damage without eliminating the livelihood benefits that mining provides to riverine communities. This research contributes field evidence to support policy discussions on balancing economic demand for river sediment with geomorphic sustainability across the Niger basin.
Summary
Source-checkedPlain-language reading of the full paper, prepared with AI and checked against the text. Each point links to the authors' own words.
Why it matters
- Sand is the most consumed natural resource globally after water, with 40 to 50 billion tonnes of sand and gravel extracted annually from various sources. View evidence ↗
- Excessive sand extraction leads to river channel bed lowering, steeper banks, and unpredictable widening or migration when removal exceeds replenishment. View evidence ↗
The question
- The study aimed to quantify morphological changes across five Niger River reaches with varying mining intensities and determine if regulated extraction leads to different outcomes than unregulated mining. View evidence ↗
What they did
- The study analyzed five representative reaches of the Niger River: Bamako, Ségou, and Mopti in Mali, Niamey in Niger Republic, and Lokoja in Nigeria. View evidence ↗
- Researchers used Landsat 8 OLI imagery from five dry-season dates between 2015 and 2023 to extract channel planform data. View evidence ↗
- Extraction volumes were estimated using structured interviews with 112 mining operators and verified against available district permits. View evidence ↗
What they found
- The Mopti reach experienced the least bed degradation at 2.6 m, attributed to lower mining intensity and seasonal floodplain buffering. View evidence ↗
- Sand extraction rates showed a strong positive correlation with channel widening (r = 0.81) and a negative correlation with bank stability (r = -0.67). View evidence ↗
- Regulated reaches had significantly less bed degradation (2.4 m) compared to unregulated reaches (3.5 m), representing a 31.7% reduction. View evidence ↗
- All reaches experienced increased bankfull channel width, with the highest rates occurring at Lokoja (2.7 m/year) and Ségou (2.3 m/year). View evidence ↗
- The middle Niger region accounts for 37.6% of the total sand extraction, largely due to construction demand in Bamako. View evidence ↗
What it means
- The authors conclude that simple tools like annual volume caps and seasonal extraction windows can reduce channel degradation while maintaining economic benefits for local communities. View evidence ↗
- The authors note that the eight-year observation period may be too short to capture the full morphological adjustment trajectory due to the lag in river response. View evidence ↗
- The study acknowledges that the correlation between extraction and channel widening does not prove causation, as climate-driven discharge changes or land-use conversion could also contribute. View evidence ↗
Visual summary
2 visualsIllustrations explain the paper; charts are replotted from the paper's own table values.
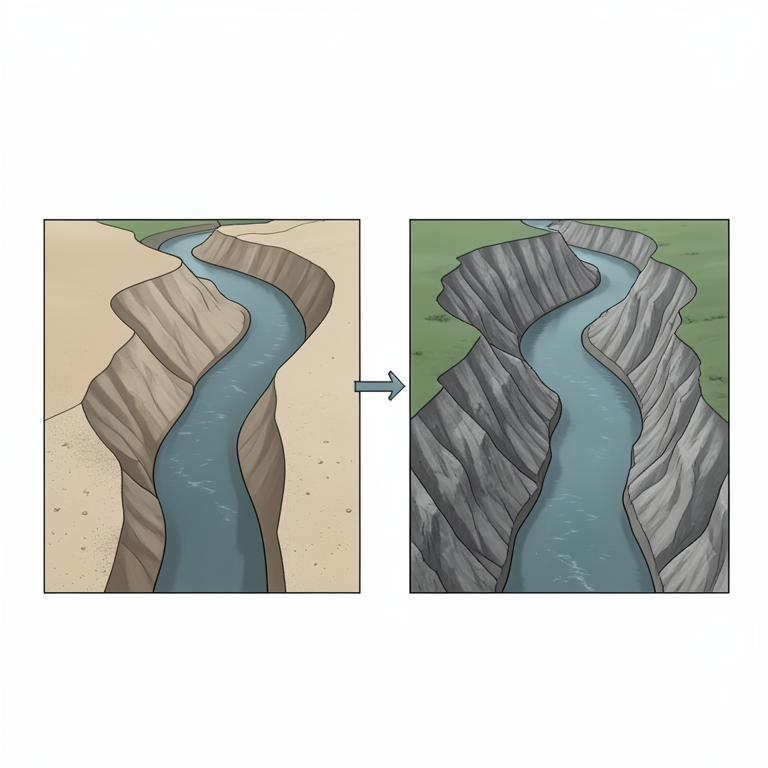
River Morphological Response to Sand Mining
AI-generated conceptual illustration (The Niger River basin channel). It explains the idea and does not show study data.
View source evidence ↗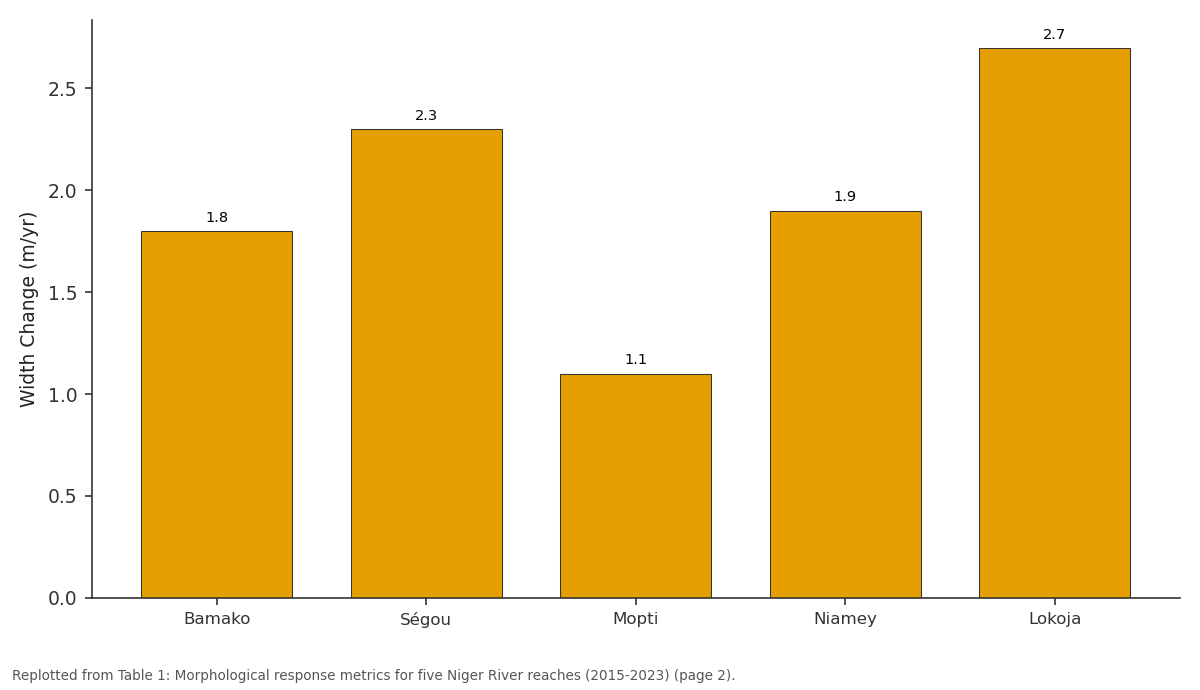
Width Change (m/yr): Bamako vs Ségou vs Mopti vs Niamey vs Lokoja
Replotted from Table 1 (page 2) of the original paper. Every bar is the paper's own table value.
View source evidence ↗Figures & tables
From the original paper Table 1
 Table 2
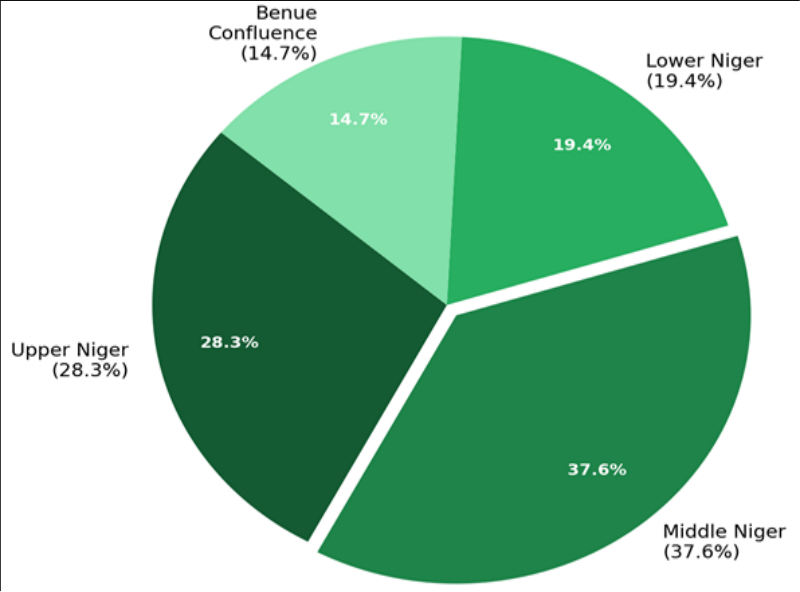 Figure 1
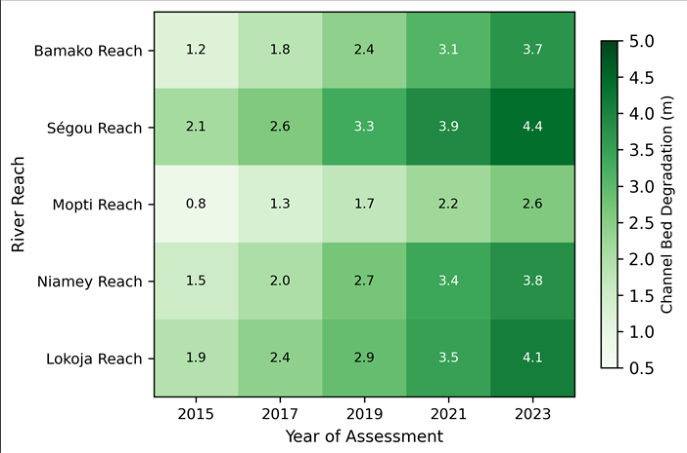 Figure 2
Introduction
Roughly 85% of all mineral aggregate consumed globally is sand and gravel, and rivers supply a disproportionate share of that total in sub-Saharan Africa, where alluvial deposits are cheap to access and close to growing urban markets [1] . In the Niger River basin-the third-largest drainage system in Africa at nearly 2.2 million km²-sand mining has shifted from a low-intensity, artisanal activity to a semi-industrial operation over the past two decades [2] . The speed of this shift has outpaced the development of monitoring systems and regulatory frameworks, leaving river managers with little quantitative information on how extraction is reshaping channel geometry. River channels adjust their form when sediment supply and transport capacity fall out of balance. When extraction removes material faster than the river can replenish it through upstream delivery, the channel bed lowers, banks steepen, and the planform can widen or migrate unpredictably [3] . These morphological responses carry practical consequences: undermined bridge piers, lowered water tables adjacent to incised reaches, loss of riparian habitat, and altered flood conveyance [4] . Yet in many West African contexts, sand mining is also a primary source of income for thousands of households, making outright prohibition both socially and politically difficult [5] . Previous work on Niger basin sediment dynamics has focused mainly on suspended sediment fluxes and their response to dam construction and land-use change [6] . Relatively few investigations have dealt directly with in-channel sand mining impacts, and those that exist tend to rely on single-site case observations rather than multi-reach comparisons [7] . A basin-scale perspective is needed to understand how mining pressure varies along the longitudinal profile and how management interventions might perform differently depending on local geomorphic conditions. This research set out to quantify channel morphological change at five reaches of the Niger River where sand mining intensity differs, and to evaluate whether regulated extraction practices produce measurably different morphological outcomes compared with unregulated sites. The analysis combined multitemporal satellite imagery with field-based channel surveys and operator interviews collected during 2022, processed within a GIS-based framework at the Wrocław School of Natural Sciences.
Study Area Description
The Niger River extends approximately 4,180 km from its source in the Fouta Djallon highlands of Guinea to its delta on the Nigerian coast. This research focused on five representative reaches: (1) the Bamako reach in the upper Niger, Mali; (2) the Ségou reach in the middle Niger, Mali;
(3) the Mopti reach at the inland delta margin, Mali; (4) the Niamey reach in western Niger Republic; and (5) the Lokoja reach near the Benue confluence in central Nigeria [8] . Mean annual discharge ranges from about 1,550 m³/s at Bamako to over 5,700 m³/s at Lokoja. The hydrological regime is dominated by a single flood pulse peaking between September and November in the upper and middle reaches, with a secondary pulse contributed by the Benue tributary in the lower reach. Bed material at all five sites consists predominantly of medium-to-coarse sand (0.3-1.2 mm median grain size), making the reaches attractive for construction aggregate mining. Annual rainfall across the research corridor varies from roughly 550 mm at Niamey to over 1,100 mm at Lokoja [9] . Riparian land cover transitions from Sudanian savanna in the upper reaches to Guinea savanna and gallery forest in the lower basin.
Materials and Methods
Materials and Methods
Materials
Channel planform data were extracted from Landsat 8 OLI imagery acquired for five dates (2015, 2017, 2019, 2021, and 2023) during the dry season (January-March) to minimise cloud interference and ensure consistent lowwater channel delineation [10] . Images were downloaded from the USGS Earth Explorer archive at 30-m resolution and atmospherically corrected using the FLAASH module in ENVI 5.6. Field cross-sectional surveys were carried out between January and September 2022 at 35 transects (seven per reach), using a Leica Geosystems GNSS receiver (±0.02 m horizontal accuracy) and a Sontek River Surveyor M9 acoustic Doppler current profiler for bathymetric measurements. Sand extraction volumes were estimated through structured interviews with 112 mining operators and cross-checked against district-level extraction permits where available. All fieldwork was coordinated through the Wrocław School of Natural Sciences, with local logistical support from partner institutions at the University of Bamako and the University of Ilorin.
Methods
Bankfull channel width was digitised from the Landsat imagery in ArcGIS Pro 3.1 at intervals of 500 m along each reach, producing 40-60 width measurements per reach per date. Temporal change in width was expressed as an annual rate of widening or narrowing. Channel bed elevation change was computed by comparing 2022 cross-sectional profiles with historical survey data from national hydrological agencies (2015 baseline). Bed degradation was defined as a net lowering of the thalweg elevation between the two survey periods, reported in metres [11] . Bank stability was assessed using a simplified version of the BEHI (Bank Erosion Hazard Index), scoring each transect on a scale from 1 (very low hazard) to 5 (extreme hazard) based on bank height ratio, root density, bank angle, and surface protection [12] . Pearson correlation coefficients were computed between estimated extraction volumes and each morphological response variable (bed degradation, width change, BEHI score). A two-sample t-test compared degradation rates between regulated reaches (those with extraction quotas enforced since 2018) and unregulated reaches, using a significance threshold of p<0.05.
Spatial Data Processing
Landsat 8 OLI scenes were selected with cloud cover below 10% over the area of interest. Radiometric calibration converted digital numbers to top-of-atmosphere reflectance. The modified normalised difference water index (MNDWI) was computed using the green (Band 3) and shortwave infrared (Band 6) bands to separate water surfaces from exposed sand and vegetation [13] . A threshold of MNDWI > 0.1 was applied to delineate the active water channel. Bankfull boundaries were identified by combining MNDWI thresholding with visual interpretation of high-water marks visible on the near-infrared false-colour composite (Bands 5-4-3). Channel centrelines were generated automatically in ArcGIS Pro and manually corrected at complex bifurcation points in the inland delta zone. All GIS outputs were projected to UTM Zone 31N (WGS 84). Positional accuracy of the Landsat-derived banklines was estimated at±15 m (one-half pixel) based on comparison with high-resolution Google Earth imagery at 20 control points per reach. Table 2 compares morphological outcomes at regulated and unregulated sites. Reaches where extraction quotas were enforced after 2018 showed an average bed degradation of 2.4 m, compared with 3.5 m at unregulated reaches-a difference of 31.7% that was statistically significant (t = 3.14, p = 0.008).
| Parameter | Regulated (n = 14) | Unregulated (n = 21) | Difference (%) | p-value |
|---|---|---|---|---|
| Mean Bed Degradation (m) | 2.4±0.9 | 3.5±1.3 | 31.7 | 0.008 |
| Mean Width Change (m/yr) | 1.3±0.6 | 2.1±0.8 | 38.1 | 0.014 |
| Mean BEHI Score | 2.6±0.7 | 3.5±0.9 | 25.7 | 0.021 |
| Bank Retreat Rate (m/yr) | 0.9±0.4 | 1.6±0.7 | 43.8 | 0.003 |
Table text extracted from the original PDF; superscript letters are shown inline. The original table image is below.
View original table image
Results
Results
Discussion
The results of this research confirm what scattered case observations have suggested for years: unregulated sand mining in the Niger basin is driving measurable and accelerating channel degradation [14] . The Ségou reach, with the highest extraction rate and no enforced quotas, showed the most severe bed lowering (4.4 m), a pattern that aligns closely with findings from similarly stressed rivers in India and Southeast Asia [15] . But the comparison between regulated and unregulated reaches is arguably the more important result. The 31.7% reduction in bed degradation at sites where seasonal calendars and volume caps have been operational since 2018 suggests that regulation doesn't need to be sophisticated to be effective-it just needs to be consistently enforced. That said, channel morphology responds to mining with a lag, and eight years of observation may not capture the full adjustment trajectory. Rivers can continue to incise for decades after extraction ceases if the sediment deficit has propagated upstream through knickpoint retreat [16] . The relatively short monitoring window here means that even the regulated reaches may undergo further degradation beyond what was recorded. And the correlation between extraction volume and channel widening (r = 0.81) doesn't establish causation by itself, since widening can also result from climate-driven changes in discharge regime or from land-use conversion in the catchment [17] .
The practical value of this research lies in its direct relevance to policy. West African governments have generally been reluctant to ban river sand mining outright because of its economic importance to rural and peri-urban communities [18] . The evidence presented here supports a middle path: extraction can continue at reduced intensity if volumetric limits and seasonal closures are maintained.
Coupling such rules with regular bathymetric monitoringperhaps at two-year intervals-would allow managers to detect when extraction rates begin to exceed the river's replenishment capacity. Without that feedback loop, any regulatory framework risks becoming obsolete as demand for construction materials continues to climb [19] .
Conclusion
Conclusion
Acknowledgement
Acknowledgements
Figures and tables from the paper
| Reach | Bed Degrad. (m) | Width Change (m/yr) | BEHI Score | Extraction (10⁶ m³/yr) | Regulation Status | Transects (n) |
|---|---|---|---|---|---|---|
| Bamako | 3.7 | 1.8 | 3.2 | 1.41 | Partial | 7 |
| Ségou | 4.4 | 2.3 | 3.8 | 1.83 | None | 7 |
| Mopti | 2.6 | 1.1 | 2.4 | 0.72 | Enforced | 7 |
| Niamey | 3.8 | 1.9 | 3.5 | 1.27 | None | 7 |
| Lokoja | 4.1 | 2.7 | 3.6 | 1.64 | Partial | 7 |
Table text extracted from the original PDF; superscript letters are shown inline. The original table image is below.
View original table image
References
19 in the original paper- Peduzzi P. Sand, rarer than one thinks. Environmental Development. 2014;11:208-218.
- Alagbe SA. Groundwater resources of River Ogun catchment area in southwest Nigeria. Environmental Geology. 2002;42(4):492-500.
- Kondolf GM. Hungry water: effects of dams and gravel mining on river channels. Environmental Management. 1997;21(4):533-551.
- Rinaldi M, Wyżga B, Surian N. Sediment mining in alluvial channels: physical effects and management perspectives. River Research and Applications. 2005;21(7):805-828.
- Jonah FE, Adjei-Boateng D, Agbo NW, Mensah EA, Edziyie RE. Assessment of sand and stone mining along the coastline of Cape Coast, Ghana. Annals of GIS. 2015;21(3):223-231.
- Amogu O, Descroix L, Yéro KS, Le Breton E, Mamadou I, Ali A. Increasing river flows in the Sahel? Water. 2010;2(2):170-199.
- Oyedotun TDT. Shoreline geometry: DSAS as a tool for historical trend analysis. Geomorphological Techniques. 2014;3:1-12.
- Andersen I, Dione O, Jarosewich-Holder M, Olivry JC. The Niger River basin: a vision for sustainable management. World Bank Publications. 2005. 1-144.
- Descroix L, Mahé G, Lebel T, Favreau G, Galle S, Gautier E. Spatio-temporal variability of hydrological regimes around the boundaries between Sahelian and Sudanian areas of West Africa. Journal of Hydrology. 2009;376(1-2):2-13.
- Xu H. Modification of normalised difference water index (NDWI) to enhance open water features in remotely sensed imagery. International Journal of Remote Sensing. 2006;27(14):3025-3033.
- Surian N, Rinaldi M. Morphological response to river engineering and management in alluvial channels in Italy. Geomorphology. 2003;50(4):307-326.
- Rosgen DL. A practical method of computing streambank erosion rate. Proceedings of the Seventh Federal Interagency Sedimentation Conference. 2001;2:9-15.
- Ji L, Zhang L, Wylie B. Analysis of dynamic thresholds for the normalised difference water index. Photogrammetric Engineering and Remote Sensing. 2009;75(11):1307-1317.
- Ashraf MA, Maah MJ, Yusoff I, Wajid A, Mahmood K. Sand mining effects, causes and concerns: a case of Bestari Jaya, Selangor, Peninsular Malaysia. Scientific Research and Essays. 2011;6(6):1216-1231.
- Padmalal D, Maya K, Sreebha S, Sreeja R. Environmental effects of river sand mining: a case from the river catchments of Vembanad Lake, southwest coast of India. Environmental Geology. 2008;54(4):879-889.
- Erskine WD, Keshavarzi A, Fentie B. River channel adjustment to bedrock incision. Catena. 2010;82(3):164-178.
- Walling DE, Fang D. Recent trends in the suspended sediment loads of the world's rivers. Global and Planetary Change. 2003;39(1-2):111-126.
- Bravard JP, Amoros C, Pautou G. Impact of civil engineering works on the successions of communities in a fluvial system. Oikos. 1986;47(1):92-111.
- Torres A, Brandt J, Lear K, Liu J. A looming tragedy of the sand commons. Science. 2017;357(6355):970-971.