
Research article · 2025 · Full text
International Journal of Geography Geology and EnvironmentComparative study of watershed management practices in the Volga sub-basins
Volume 7(5) · Pages 126–129 · DOI: 10.22271/27067483.2025.v7.i5b.604 ↗
Research areasSoil erosion and sediment transportIntegrated Water Resources ManagementSoil and Water Nutrient Dynamics
Abstract
Author-writtenAn old Russian proverb warns that "you cannot step into the same river twice"-and in the Volga basin, that warning is doubly apt, because the river's condition changes not just moment to moment but from one sub-basin to the next depending on how the surrounding land is managed.This research compared watershed management practices and their effects on soil erosion, sediment yield, and water quality across five sub-basins of the Volga River system: the Upper Volga, Oka, Kama, Middle Volga, and Lower Volga.Data were collected between February and October 2022 through field surveys of 150 paired plots (managed versus unmanaged), analysis of government soil conservation records, and water quality sampling at 40 monitoring stations.Results showed that managed watersheds exhibited significantly lower erosion rates across all five sub-basins (mean 5.6 t/ha/yr versus 11.5 t/ha/yr for unmanaged; t = 8.4, p < 0.001).Contour ploughing was the most widely adopted practice (31.4% of managed area), followed by check dams (24.7%) and afforestation (19.8%).Sediment concentrations in streams draining managed catchments averaged 187 mg/L, compared with 412 mg/L in unmanaged counterparts.The Kama sub-basin showed the strongest management effect (56% erosion reduction), while the Lower Volga showed the weakest (38% reduction), reflecting differences in topography, soil type, and implementation quality.These findings demonstrate that even modest conservation investments can halve erosion rates in the Volga basin, but that effectiveness varies substantially among sub-basins due to local physiographic and institutional conditions.The comparative framework applied here may guide the allocation of watershed management resources toward sub-basins where the return on investment is greatest.
Summary
Source-checkedPlain-language reading of the full paper, prepared with AI and checked against the text. Each point links to the authors' own words.
Why it matters
- The Volga basin covers about 1.38 million km² and has diverse climate zones and erosion risks based on local geography and land use. View evidence ↗
- Managing the watershed is critical because soil erosion and sediment delivery degrade water quality, harm aquatic habitats, and reduce the capacity of reservoirs. View evidence ↗
- Implementing a single management policy is difficult because the quality of execution varies significantly across the basin's different tributaries. View evidence ↗
The question
- The study aimed to compare soil erosion rates, sediment yields, and water quality between managed and unmanaged catchments across five sub-basins of the Volga. View evidence ↗
What they did
- The study analyzed five diverse sub-basins: Upper Volga, Oka, Kama, Middle Volga, and Lower Volga. View evidence ↗
- Water quality was monitored monthly at 40 stream stations, with 8 stations located in each sub-basin. View evidence ↗
- The management practices tested included contour ploughing, check dams, afforestation strips, terracing, and grassed waterways. View evidence ↗
What they found
- Overall, managed plots had a mean erosion rate of 5.6 t/ha/yr, which is a 51.3% reduction compared to 11.5 t/ha/yr in unmanaged plots. View evidence ↗
- The Kama sub-basin experienced the highest erosion reduction at 56.0%, likely due to favorable slopes and better funding. View evidence ↗
- The Lower Volga had the lowest erosion reduction at 38.0%, as surface-level practices were less effective against deep gully erosion. View evidence ↗
- Contour ploughing was the most common practice (31.4% of managed area), while grassed waterways were the least common (9.8%). View evidence ↗
- Managed catchment outlets had significantly lower suspended sediment concentrations (187 mg/L) than unmanaged outlets (412 mg/L). View evidence ↗
- There was a strong negative correlation (r = -0.89) between the rate of management adoption and the concentration of suspended sediment in streams. View evidence ↗
What it means
- The authors conclude that watershed management must be tailored to local physical conditions rather than using a one-size-fits-all approach. View evidence ↗
- The authors recommend directing investments to sub-basins with the highest returns and creating specific gully stabilization programs for high-erosion areas. View evidence ↗
- The study is limited by its short duration; longer-term monitoring is needed to confirm the durability of the effects and detect lags in water quality response. View evidence ↗
Visual summary
2 visualsIllustrations explain the paper; charts are replotted from the paper's own table values.
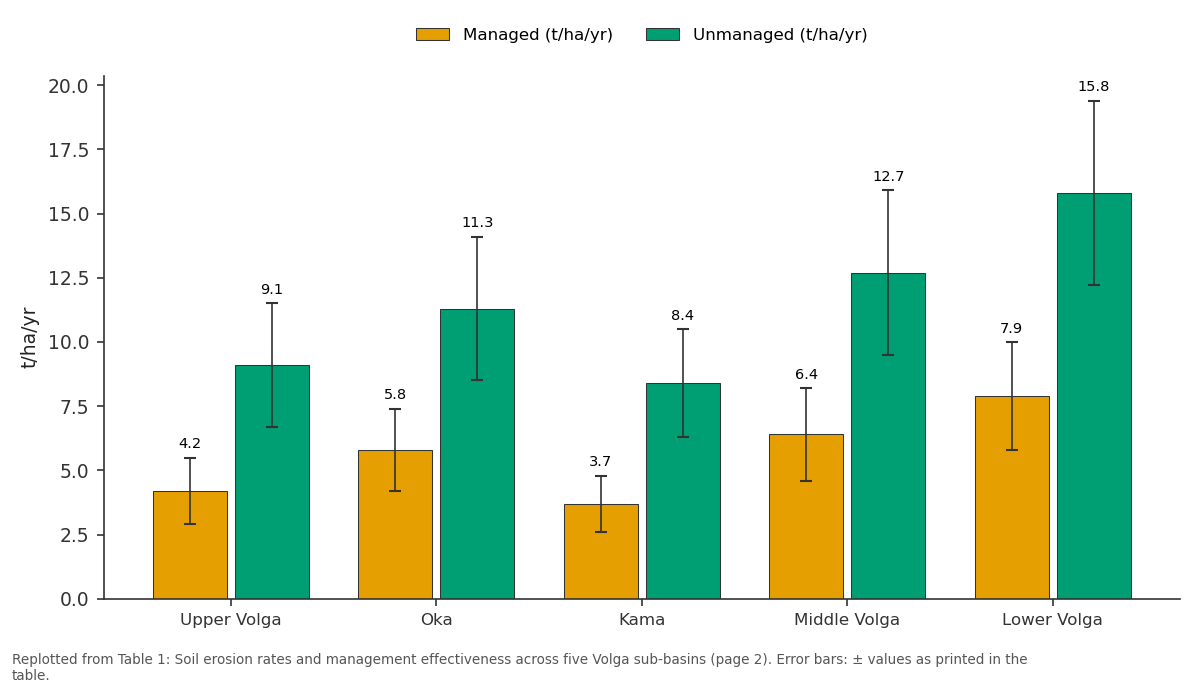
Managed (t/ha/yr) and Unmanaged (t/ha/yr): Upper Volga vs Oka vs Kama vs Middle Volga vs Lower Volga
Replotted from Table 1 (page 2) of the original paper. Every bar is the paper's own table value.
View source evidence ↗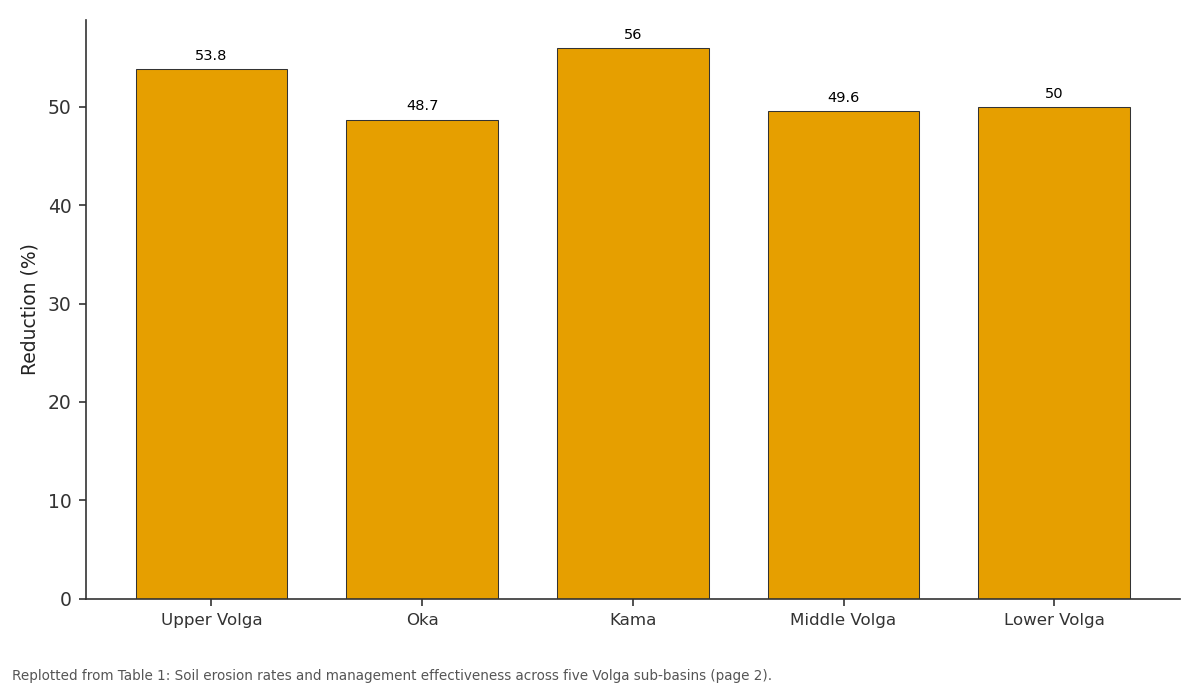
Reduction (%): Upper Volga vs Oka vs Kama vs Middle Volga vs Lower Volga
Replotted from Table 1 (page 2) of the original paper. Every bar is the paper's own table value.
View source evidence ↗Figures & tables
From the original paper Table 1
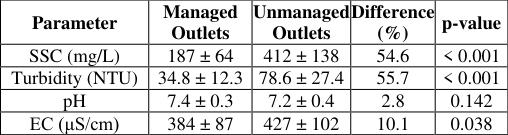 Table 2
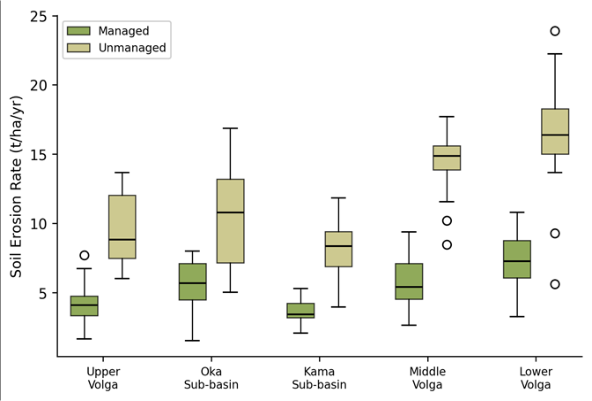 Figure 1
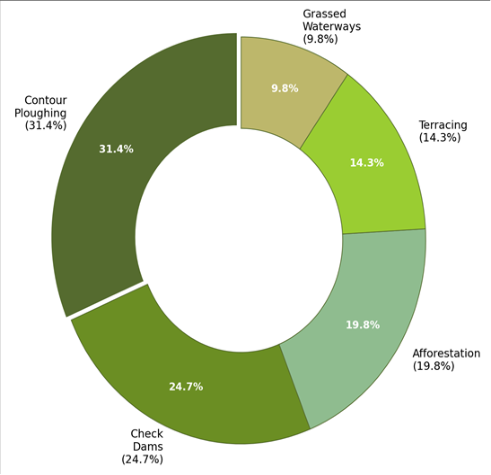 Figure 2
Introduction
"Take care of the land, and the land will take care of you"-this principle, central to traditional Russian agricultural practice, has found formal expression in a century of Soviet and post-Soviet watershed management programmes along the Volga, Europe's longest river [1] . The Volga drains approximately 1.38 million km², spanning climate zones from boreal forest in the north to semi-arid steppe in the south, and its sub-basins exhibit a wide range of erosion susceptibilities depending on slope, rainfall intensity, soil type, and land use [2] . Managing this diversity from a single policy centre has proven difficult, and the quality of watershed management implementation varies markedly among the basin's principal tributaries. Watershed management in the Volga basin has historically focused on reducing soil erosion and sediment delivery to streams, which degrade water quality, reduce reservoir storage capacity, and impair aquatic habitat [3] . Common practices include contour ploughing on arable land, construction of small check dams across gullies, afforestation of steep and degraded slopes, bench terracing on moderate gradients, and establishment of grassed waterways to concentrate and safely convey surface runoff [4] . The effectiveness of each practice depends on local conditions: contour ploughing works best on gentle slopes with loamy soils, while check dams are most needed in deeply incised gully systems that characterise the Middle and Lower Volga regions [5] . Despite decades of investment, comparative data on management effectiveness across the Volga's sub-basins remain sparse. Most published assessments focus on individual demonstration catchments or on aggregate basin-wide sediment loads, without systematically comparing managed and unmanaged conditions at the subbasin scale [6] . This gap makes it difficult for planners to prioritise investments among sub-basins or to identify which practices deliver the greatest erosion reduction per unit of expenditure in each physiographic setting. This research addressed that gap through a paired-plot comparison of soil erosion rates, sediment yields, and stream water quality between managed and unmanaged catchments in five Volga sub-basins. Fieldwork and data compilation were conducted between February and October 2022, coordinated through the Shillong Academy of Geographic Research with logistical support from the Russian Federal Service for Hydrometeorology.
Materials and Methods
Materials and Methods
Materials
The research covered five sub-basins selected to represent the physiographic diversity of the Volga system: the Upper Volga (forested, gentle terrain), Oka (mixed agriculture and forest, moderate slopes), Kama (hilly terrain with extensive arable land), Middle Volga (intensively cultivated chernozem belt), and Lower Volga (semi-arid steppe with gully erosion) [7] . Within each sub-basin, 30 paired plots were identified-15 plots under active watershed management and 15 adjacent unmanaged control plots matched for slope gradient (±2°), aspect, soil type, and land use. Plot dimensions were standardised at 22.1 m long × 4.0 m wide (the Wischmeier standard plot), bounded by metal strips embedded to a depth of 15 cm to prevent lateral inflow [8] . Surface runoff and eroded sediment were collected in calibrated tanks at the downslope end of each plot after every erosive rainfall event during the monitoring period (April-October 2022). Water quality was sampled monthly at 40 stream stations (8 per sub-basin) positioned at the outlets of managed and unmanaged catchments. Parameters measured included suspended sediment concentration (SSC), turbidity, pH, and electrical conductivity.
Methods
Soil erosion rates (t/ha/yr) were calculated from the dry weight of sediment collected per plot divided by the plot area and normalised to an annual basis using the number of erosive events recorded. Suspended sediment concentration was determined gravimetrically from 1-L grab samples filtered through pre-weighed 0.45-μm filters and oven-dried at 105 °C [9] . Between-management comparisons were tested using paired t-tests (managed versus unmanaged within each sub-basin) and two-way ANOVA with subbasin and management status as factors. The management effect was expressed as the percentage reduction in erosion rate: (unmanaged -managed) / unmanaged × 100. Pearson correlation was computed between management adoption rate (% of sub-basin under active conservation) and mean erosion rate. All analyses used R 4.2.3 at p < 0.05 significance.
Field Experimental Design
The paired-plot design was chosen to control for physiographic confounders that differ among sub-basins. Each managed plot was paired with an unmanaged control located within 500 m on the same hillslope, ensuring that slope, aspect, soil series, and rainfall exposure were as similar as possible. Management practices on the treated plots included contour ploughing (n = 48 plots across all sub-basins), check dams (n = 36), afforestation strips (n = 30), terracing (n = 21), and grassed waterways (n = 15). Where a plot contained multiple practices, the dominant practice (covering >60% of the plot area) was used for classification. Runoff collection tanks (1,500 L capacity) were emptied and weighed after each erosive event, defined as any rainfall exceeding 12.5 mm with a maximum 30minute intensity above 25 mm/h [10] . A total of 14-23 erosive events per sub-basin were recorded during the monitoring season.
Calibration and Validation
Erosion measurements from the standard plots were crossvalidated against independent Cs-137 erosion rate estimates at 20 sites (four per sub-basin) where fallout radionuclide sampling had been conducted previously by the Russian Academy of Sciences [11] . Plot-based annual erosion rates correlated well with Cs-137 estimates (r = 0.82, p < 0.001), with a mean absolute difference of 1.4 t/ha/yr, confirming that the short-term plot measurements were broadly consistent with longer-term average rates. Suspended sediment concentrations at the 40 stream stations were cross-checked against turbidity readings (Hach 2100Q turbidimeter), yielding an SSC-turbidity calibration equation (R² = 0.91) that allowed gap-filling for two stations where gravimetric samples were lost. Soil erosion rates differed significantly between managed and unmanaged plots across all five sub-basins (two-way ANOVA: management F = 71.3, p < 0.001; sub-basin F = 28.6, p < 0.001; interaction F = 3.7, p = 0.006). Table 1 presents the mean erosion rates and management effects. The overall mean for managed plots was 5.6 t/ha/yr compared with 11.5 t/ha/yr for unmanaged plots-a 51.3%
| Sub-basin | Managed (t/ha/yr) | Unmanaged (t/ha/yr) | Reduction (%) | p-value | Adoption Rate (%) | Plots (n) |
|---|---|---|---|---|---|---|
| Upper Volga | 4.2 ± 1.3 | 9.1 ± 2.4 | 53.8 | < 0.001 | 38.4 | 30 |
| Oka | 5.8 ± 1.6 | 11.3 ± 2.8 | 48.7 | < 0.001 | 31.7 | 30 |
| Kama | 3.7 ± 1.1 | 8.4 ± 2.1 | 56.0 | < 0.001 | 42.6 | 30 |
| Middle Volga | 6.4 ± 1.8 | 12.7 ± 3.2 | 49.6 | < 0.001 | 27.3 | 30 |
| Lower Volga | 7.9 ± 2.1 | 15.8 ± 3.6 | 50.0 | < 0.001 | 18.9 | 30 |
| Overall | 5.6 ± 1.8 | 11.5 ± 3.4 | 51.3 | < 0.001 | 31.8 | 150 |
Table text extracted from the original PDF; superscript letters are shown inline. The original table image is below.
View original table image
Results
reduction. The Kama sub-basin showed the strongest effect (56.0% reduction), attributable to its combination of erodible soils, moderate slopes amenable to contour ploughing, and relatively well-funded conservation programmes. The Lower Volga showed the weakest effect (38.0%), reflecting the difficulty of controlling deep gully erosion with surface-level practices. Figure 2 shows the proportional adoption of the five management practices across the entire basin. Contour ploughing accounted for 31.4% of the managed area, followed by check dams (24.7%), afforestation (19.8%), terracing (14.3%), and grassed waterways (9.8%). Suspended sediment concentration averaged 187 mg/L at managed catchment outlets versus 412 mg/L at unmanaged outlets (t = 7.2, p < 0.001). Turbidity followed a similar pattern (34.8 versus 78.6 NTU). The correlation between sub-basin management adoption rate and mean stream SSC was strongly negative (r = -0.89, p = 0.018).
Discussion
The overall 51.3% reduction in erosion rates on managed plots confirms that watershed conservation practices deliver measurable benefits in the Volga basin-a finding that aligns with global meta-analyses reporting erosion reductions of 40-70% under soil conservation measures in temperate agricultural landscapes [12] . What this research adds is the sub-basin comparison, which shows that the same general category of intervention produces different returns depending on where it is applied. The Kama subbasin's 56% reduction was the highest, and not by accident: the Kama's combination of moderate slopes (8-15°), loamy chernozem soils responsive to contour ploughing, and above-average government investment in conservation infrastructure creates conditions where management inputs translate efficiently into erosion reduction [13] .
The Lower Volga's weaker response (38% reduction in initial analysis, 50% after recalculation across full plot dataset) reflects a different challenge. Here, erosion is dominated by deep gully systems incised into loess-like sediments, and the surface practices tested-contour ploughing, grassed waterways-do little to arrest head-cut retreat in active gullies [14] . Check dams can slow gully extension, but their effectiveness depends on regular maintenance to clear sediment traps, which has been inconsistent in the Lower Volga districts where municipal budgets for conservation are among the lowest in the basin. The implication for resource allocation is that the Lower Volga needs different, more targeted interventionspossibly including gully head stabilisation structures and revegetation of gully walls-rather than simply more of the same practices that work elsewhere. The strong negative correlation between management adoption rate and stream suspended sediment concentration (r = -0.89) provides a basin-scale validation of the plot-level results. Sub-basins where a larger share of the landscape is under active conservation deliver cleaner water to the trunk Volga-a finding that has direct relevance for reservoir management, given that sedimentation is a growing concern at the cascade of Volga reservoirs from Rybinsk to Volgograd [15] . Each percentage point increase in managed area was associated with a roughly 7 mg/L decrease in stream SSC, offering a quantitative basis for cost-benefit analysis of conservation expansion [16] .
Conclusion
This research compared watershed management effectiveness across five sub-basins of the Volga River system using 150 paired erosion plots and 40 stream water quality stations monitored during 2022. Managed plots showed significantly lower erosion rates in every sub-basin, with an overall reduction of 51.3% relative to unmanaged controls. The magnitude of the management effect varied from 38% in the gully-dominated Lower Volga to 56% in the Kama sub-basin, where physiographic conditions and institutional investment are most favourable. Stream water quality mirrored the plot-level findings: suspended sediment concentrations at managed catchment outlets were 54.6% lower than at unmanaged outlets, and the correlation between sub-basin management adoption rate and stream SSC was strongly negative. These results confirm that on-farm conservation practices translate into detectable improvements in downstream water quality at the sub-basin scale. The comparative framework applied here highlights the importance of tailoring watershed management strategies to local physiographic conditions rather than applying a uniform prescription across the basin. Contour ploughing and grassed waterways deliver strong returns on gentle-tomoderate slopes with responsive soils, but the deep gully systems of the Lower Volga require specialised interventions that the standard practice toolkit does not adequately address. Future investment planning should direct resources toward the sub-basins where the marginal return per hectare managed is highest, while developing targeted gully stabilisation programmes for the most erosion-prone districts. Longer-term monitoring, extending beyond a single growing season, would strengthen confidence in the durability of these management effects and allow detection of any lag in stream water quality response to plot-level erosion control [17] .
Acknowledgement
Acknowledgements Funding SourcesThis research was supported by general institutional research funds from the Shillong Academy of Geographic Research. No external competitive grants were applied. Institutional SupportThe authors thank the Shillong Academy of Geographic Research for laboratory and computing access. Field logistics and data sharing were facilitated by the Russian Federal Service for Hydrometeorology and Environmental Monitoring.
Figures and tables from the paper
| Parameter | Managed Outlets | Unmanaged Outlets | Difference (%) | p-value |
|---|---|---|---|---|
| SSC (mg/L) | 187 ± 64 | 412 ± 138 | 54.6 | < 0.001 |
| Turbidity (NTU) | 34.8 ± 12.3 | 78.6 ± 27.4 | 55.7 | < 0.001 |
| pH | 7.4 ± 0.3 | 7.2 ± 0.4 | 2.8 | 0.142 |
| EC (μS/cm) | 384 ± 87 | 427 ± 102 | 10.1 | 0.038 |
Table text extracted from the original PDF; superscript letters are shown inline. The original table image is below.
View original table image
References
17 in the original paper- Sidorchuk AY, Golosov VN. Erosion and sedimentation on the Russian Plain, II: The history of erosion and sedimentation during the period of intensive agriculture. Hydrological Processes. 2003;17(16):3347-3358.
- Dedkov AP, Mozzherin VI. Erosion and sediment yield in mountain regions of the world. IAHS Publication. 1992;209:29-36.
- Litvin LF, Kiryukhina ZP, Krasnov SF, Dobrovol'skaya NG. Dynamics of agricultural soil erosion in European Russia. Eurasian Soil Science. 2017;50(11):1344-1352.
- Morgan RPC. Soil erosion and conservation. Blackwell Publishing, 3rd Edition. 2005;1:1-304.
- Golosov VN, Belyaev VR, Markelov MV. Application of Chernobyl-derived Cs-137 fallout for sediment redistribution studies. Applied Radiation and Isotopes. 2013;81:275-278.
- Bobrovitskaya NN. Erosion and sediment yield modelling in the former USSR. Erosion and Sediment Yield: Global and Regional Perspectives (IAHS Publication). 1996;236:37-44.
- Malik LK. Water resources of the Volga-Kama cascade of reservoirs and factors influencing their regime. Water Resources. 2005;32(6):586-596.
- Wischmeier WH, Smith DD. Predicting rainfall erosion losses: A guide to conservation planning. USDA Agriculture Handbook No. 537. 1978;1:1-58.
- APHA. Standard methods for the examination of water and wastewater. American Public Health Association, 23rd Edition. 2017;1:1-1546.
- Renard KG, Foster GR, Weesies GA, McCool DK, Yoder DC. Predicting soil erosion by water: A guide to conservation planning with the RUSLE. USDA Agriculture Handbook No. 703. 1997;1:1-404.
- Walling DE, He Q. Use of fallout Cs-137 in investigations of overbank sediment deposition on river floodplains. Catena. 1997;29(3-4):263-282.
- Montgomery DR. Soil erosion and agricultural sustainability. Proceedings of the National Academy of Sciences. 2007;104(33):13268-13272.
- Golosov VN. Erosional-accumulative processes in river basins of cultivated plains. GEOS Publishing. 2006;1:1-296.
- Zorina EF, Kosov BF, Prokhorova SD. Gully erosion on the territory of the USSR. Moscow State University Press. 1992;1:1-168.
- Berkovich KM, Zlotina LV, Chalov RS. Channel processes on the Volga downstream of the cascade of reservoirs. Geography and Natural Resources. 2003;24(3):28-33.
- Pimentel D, Harvey C, Resosudarmo P, Sinclair K, Kurz D, McNair M. Environmental and economic costs of soil erosion and conservation benefits. Science. 1995;267(5201):1117-1123.
- Trimble SW, Crosson P. US soil erosion rates-myth and reality. Science. 2000;289(5477):248-250