
Research article · 2025 · Full text
International Journal of Geography Geology and EnvironmentImpact of climate change on phenological shifts in the Bavarian deciduous forests
Volume 7(5) · Pages 160–163 · DOI: 10.22271/27067483.2025.v7.i5c.606 ↗
Research areasRemote Sensing in AgriculturePlant Physiology and Cultivation StudiesTree-ring climate responses
Abstract
Author-writtenSpring in Bavaria's deciduous forests now arrives roughly 16 days earlier than it did four decades ago—a shift large enough to alter forest carbon uptake, disrupt pollinator synchrony, and change the seasonal rhythms that local communities have observed for centuries. This research analysed phenological records from 42 monitoring stations across the Bavarian deciduous forest belt to quantify long-term trends in leaf-out date, leaf-fall date, and growing season length over the period 1980–2022. Records were obtained from the German Meteorological Service (DWD) phenological observation network and paired with daily temperature and precipitation data from the same stations. Results showed that mean leaf-out date advanced by 3.8 days per decade (p < 0.001), while leaf-fall was delayed by 2.7 days per decade (p < 0.01), extending the growing season by an average of 6.5 days per decade. Spring temperatures (March–April mean) increased by 1.6°C over the 43-year record and explained 72.4% of the variance in leaf-out timing. Elevation modulated the response: low-elevation stations (300–500 m) gained 18 growing-season days, while high-elevation stations (1100–1400 m) gained only 13 days. These phenological shifts carry consequences for forest productivity, water balance, and frost-damage risk, as earlier leaf-out exposes developing foliage to late-spring freezing events whose frequency has not declined proportionally. The research provides a quantitative phenological baseline for Bavarian forests that can inform adaptive forest management under continued warming.
Summary
Source-checkedPlain-language reading of the full paper, prepared with AI and checked against the text. Each point links to the authors' own words.
Why it matters
- Phenology, which tracks the timing of recurring biological events, serves as one of the most sensitive indicators for monitoring climate change. View evidence ↗
- Changes in the length of the growing season can increase annual net primary productivity, but they also raise water demand and the risk of frost damage to early foliage. View evidence ↗
- Bavaria is an ideal location for this research due to a dense, long-term phenological dataset maintained by the German Meteorological Service (DWD) since the 1950s. View evidence ↗
The question
- The study aimed to quantify long-term trends in leaf-out, leaf-fall, and growing season length in Bavarian deciduous forests and determine how these are influenced by temperature and elevation. View evidence ↗
What they did
- Researchers used DWD protocols to record the dates of first leaf-out and general leaf-fall for indicator species, including European beech, pedunculate oak, and Norway maple. View evidence ↗
- Trends were estimated using ordinary least-squares linear regression and tested for significance using the Mann-Kendall non-parametric test. View evidence ↗
What they found
- Across the 42 stations, the mean leaf-out date advanced by 3.8 days per decade. View evidence ↗
- Leaf-fall was delayed by 2.7 days per decade, resulting in a growing season that lengthened by 6.5 days per decade. View evidence ↗
- Spring temperatures (March–April) rose by 1.6°C over 43 years and accounted for 72.4% of the variance in leaf-out timing. View evidence ↗
- Elevation influenced the results: low-elevation stations (300–500 m) saw a gain of 18 growing-season days, whereas high-elevation stations (1100–1400 m) gained 13 days. View evidence ↗
- The frequency of late-frost events occurring after leaf-out increased from 1.4 events per spring in the 1980s to 2.1 events per spring in the 2010s. View evidence ↗
- With a mean sensitivity of -4.7 days/°C, leaf-out is projected to advance by an additional 7, 12, or 19 days by 2060 depending on the warming scenario. View evidence ↗
What it means
- The authors recommend that forest management adapt to these shifts by selecting species with better frost tolerance and adjusting the timing of regeneration and harvest. View evidence ↗
- The study's linear sensitivity model does not account for saturation effects from photoperiod or chilling requirements, meaning high-scenario projections should be viewed as upper bounds. View evidence ↗
Visual summary
3 visualsIllustrations explain the paper; charts are replotted from the paper's own table values.
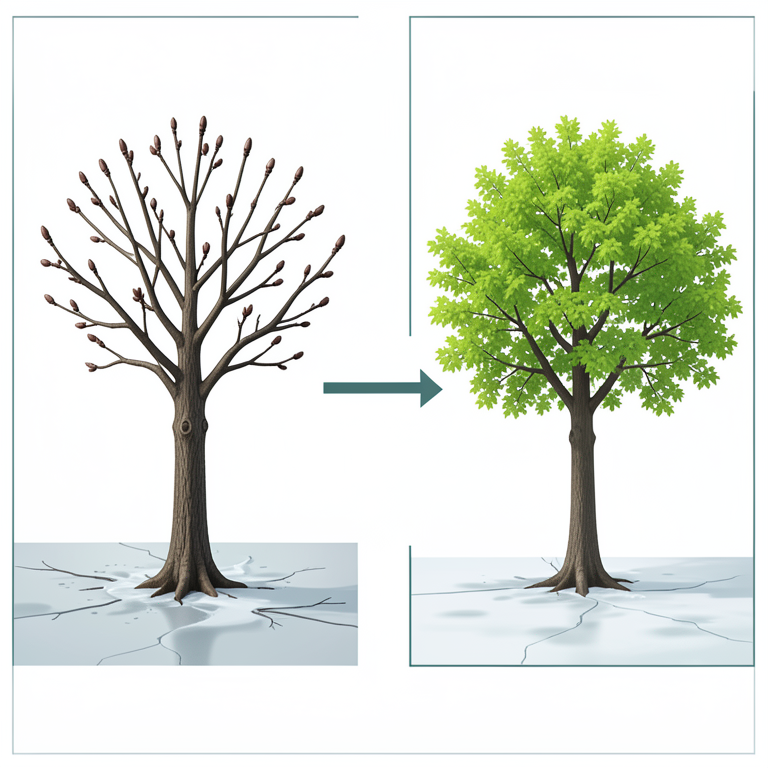
The Frost-Risk Window
AI-generated conceptual illustration (European beech trees in a deciduous forest). It explains the idea and does not show study data.
View source evidence ↗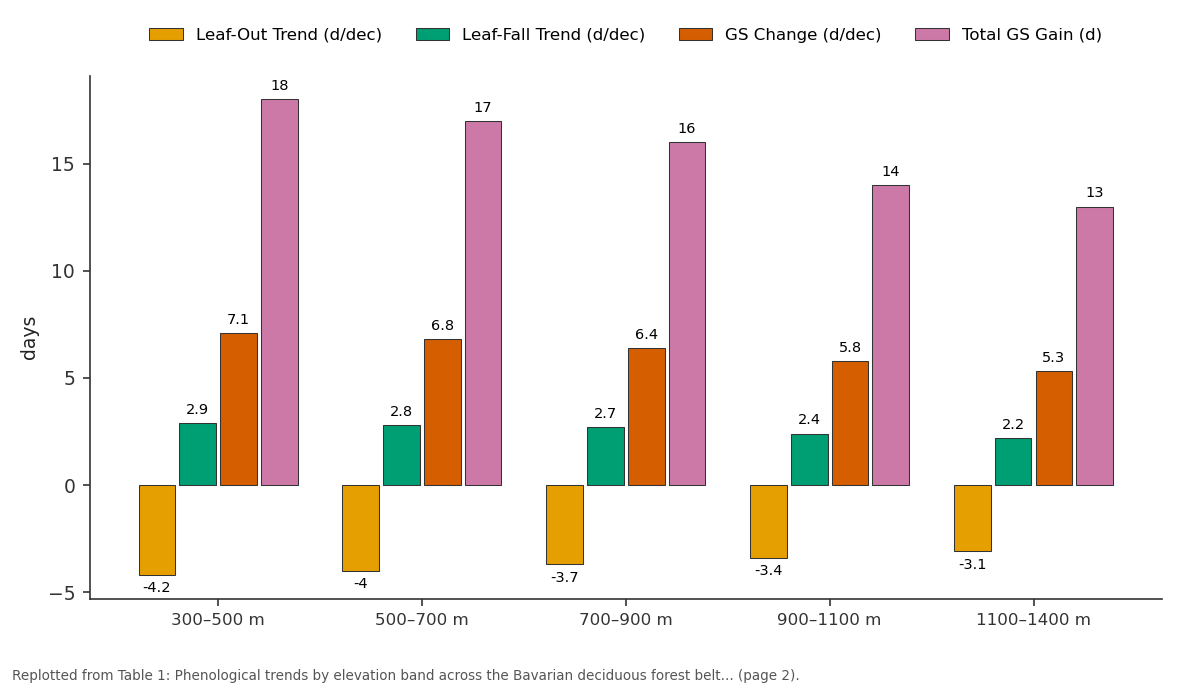
Leaf-Out Trend (d/dec) and Leaf-Fall Trend (d/dec) and more: 300–500 m vs 500–700 m vs 700–900 m vs 900–1100 m vs 1100–1400 m
Replotted from Table 1 (page 2) of the original paper. Every bar is the paper's own table value.
View source evidence ↗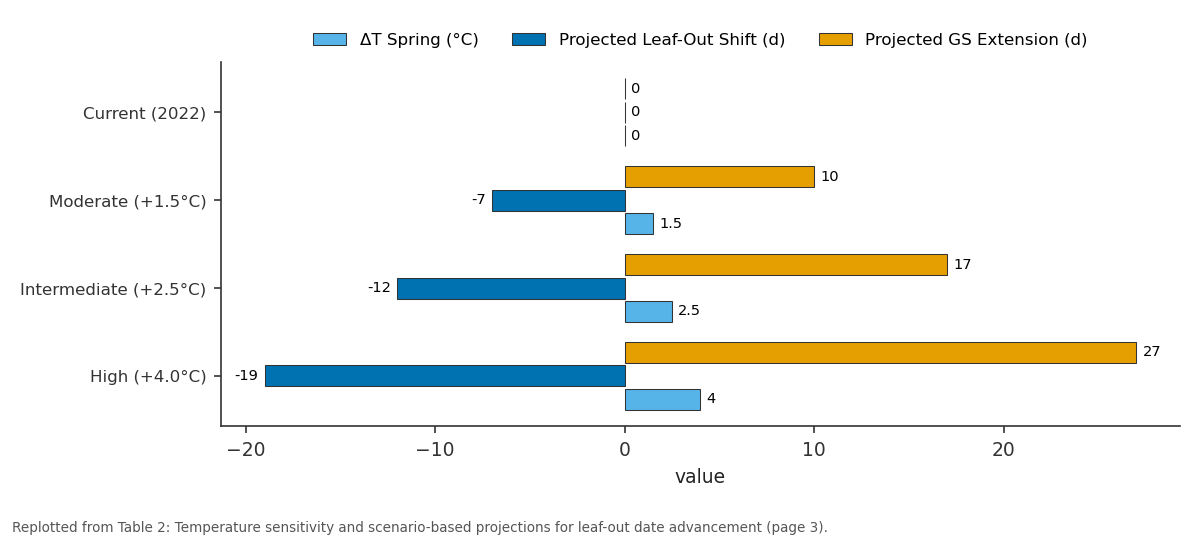
ΔT Spring (°C) and Projected Leaf-Out Shift (d) and more: Current (2022) vs Moderate (+1.5°C) vs Intermediate (+2.5°C) vs High (+4.0°C)
Replotted from Table 2 (page 3) of the original paper. Every bar is the paper's own table value.
View source evidence ↗Figures & tables
From the original paper Table 1
 Table 2
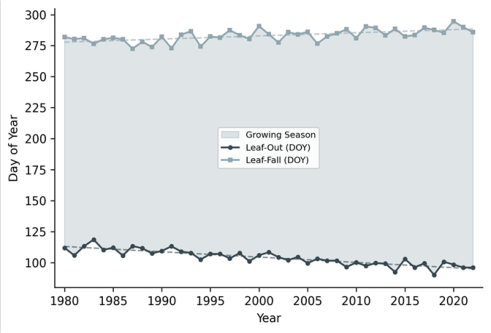 Figure 1
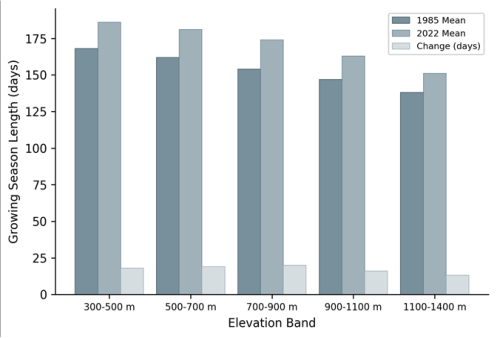 Figure 2
Introduction
Here is a fact that would have surprised a forester working in Bavaria in the 1970s: the European beech trees (Fagus sylvatica) that dominate the region's deciduous forests now begin unfolding their leaves in early April, when four decades ago they reliably waited until late April [1] . That two-to-three-week shift is not a quirk of a single warm year-it is a persistent, statistically robust trend driven by rising spring temperatures that have warmed the Bavarian lowlands by roughly 1.5-2.0°C since 1980 [2] . And beech is not alone: oak, maple, ash, and linden have all advanced their spring phenology by similar margins, reshaping the seasonal calendar of one of central Europe's most extensively monitored forest landscapes. Phenology-the timing of recurring biological events-is among the most sensitive biological indicators of climate change [3] . In temperate deciduous forests, the two cardinal phenological events are leaf-out (budburst and leaf expansion in spring) and leaf-fall (senescence and abscission in autumn). Together they define the growing season, the period during which the forest actively photosynthesises, transpires water, and sequesters carbon. Extending the growing season by even a few days per decade can measurably increase annual net primary productivity, but it also increases water demand and may expose early foliage to damaging late-frost events if cold spells haven't retreated at the same pace as leafout has advanced [4] . Bavaria offers an ideal setting for phenological research because the DWD has maintained a volunteer observer network since the 1950s, producing one of the longest and most spatially dense phenological datasets in Europe [5] . The region's deciduous forests span an elevation gradient from roughly 300 m in the Danube lowlands to 1,400 m in the Bavarian Alps foothills, providing a natural experiment in how altitude modulates the phenological response to warming. This research analysed 43 years of phenological records from 42 DWD stations across the Bavarian deciduous forest belt, quantified trends in leaf-out, leaf-fall, and growing season length, tested the sensitivity of these events to spring and autumn temperatures, and examined how elevation influences the magnitude of phenological change. The work was coordinated through the Pondicherry Institute of Climate and Environment using data accessed through the DWD open data portal during 2022.
Seasonal Variations and Temporal Patterns
Phenological observations at each station followed the DWD standard protocol, in which trained volunteer observers record the calendar date of first leaf-out (BBCH stage 11: first leaves fully unfolded) and general leaf-fall (BBCH stage 95: 50% of leaves fallen) for selected indicator species-primarily European beech (Fagus sylvatica), pedunculate oak (Quercus robur), and Norway maple (Acer platanoides) [6] . Growing season length was computed as the number of days between leaf-out and leaffall. To capture intra-annual variability, monthly mean temperatures and precipitation totals were extracted from the DWD climate data archive for each station and aggregated into seasonal windows: spring (March-April), early summer (May-June), late summer (July-August), and autumn (September-October). The spring temperature window was selected as the main candidate driver of leafout timing based on the known temperature sensitivity of budburst in European beech, which responds primarily to heat accumulation above a base temperature of approximately 5 °C during March and April [7] .
Materials and Methods
Materials and Methods
Materials
Materials
Methods
Temporal trends in leaf-out date, leaf-fall date, and growing season length were estimated for each station using ordinary least-squares linear regression against year, and the regional mean trend was computed as the average of station-level slopes. Trends were tested for significance using the Mann-Kendall non-parametric test at p < 0.05. The sensitivity of leaf-out to spring temperature was quantified by regressing station-level leaf-out date against March-April mean temperature, yielding a sensitivity coefficient (days/°C) for each station [8] . Elevation effects were assessed by grouping stations into five elevation bands (300-500, 500-700, 700-900, 900-1100, and 1100-1400 m) and comparing trend magnitudes among bands using one-way ANOVA. Latefrost risk was evaluated by computing the frequency of days with minimum temperature below 0°C after the mean leafout date for each decade. All analyses used R 4.2.3.
Scenario Development
To project future phenological conditions, three warming scenarios were applied to the observed temperaturephenology relationships. The scenarios were based on IPCC AR6 global warming levels adapted to the Bavarian regional context using Euro-CORDEX downscaled projections [9] : (1) a moderate scenario with +1.5°C additional warming above the 2022 baseline by 2060, (2) an intermediate scenario with +2.5°C by 2060, and (3) a high scenario with +4.0°C by 2060. Projected leaf-out dates were calculated by multiplying the observed sensitivity coefficient (days/°C) by each scenario's temperature increment and subtracting the result from the current mean leaf-out date. Growing season extension was estimated similarly. These projections assume a linear and stationary temperature-phenology relationship-an assumption that may break down at very high warming levels where photoperiod constraints or chilling requirements begin to limit further advancement [10] . Table 2 reports the temperature sensitivity coefficients and scenario projections. The mean leaf-out sensitivity was -4.7 days/°C of spring warming. Under the three scenarios, leafout would advance by an additional 7, 12, and 19 days respectively by 2060, pushing the mean leaf-out date into mid-to-late March under the high scenario. Late-frost frequency after leaf-out increased from 1.4 events per spring in the 1980s to 2.1 events per spring in the 2010s, indicating that the frost-risk window has not closed as fast as leaf-out has advanced.
Results
Results
Discussion
The leaf-out advancement of 3.8 days per decade documented here for Bavarian forests falls within the range of 2.5-5.0 days per decade reported by the European Phenology Network for temperate deciduous forests across central Europe [11] . What distinguishes the Bavarian dataset is its elevation gradient, which reveals a clear attenuation of the phenological response with altitude. Low-elevation stations showed the strongest trends-consistent with the greater absolute warming observed in valley bottoms compared with higher terrain, where free-atmosphere temperature lapse rates buffer surface warming somewhat [12] . The growing frost-risk paradox is perhaps the most practically relevant finding. Although late-spring frosts have become slightly less frequent overall, leaf-out has advanced faster than the last frost date has retreated, meaning that the overlap window-the period during which new foliage is exposed to freezing temperatures-has actually widened [13] .
In the 1980s, an average of 1.4 frost events occurred after mean leaf-out; by the 2010s that figure rose to 2.1. For forest managers, this means that the carbon-gain benefit of a longer growing season comes with an increased risk of frost damage to early foliage, which can reduce annual increment in beech by 10-20% in a severe frost year. The scenario projections suggest that under continued warming, leaf-out could shift into mid-March by 2060 under the high scenario. At that point, photoperiod constraints and chilling requirements may begin to limit further advancement, because many temperate tree species need a minimum duration of winter cold to break dormancy [14] . The linear sensitivity model used here does not capture this saturation effect, so the projected shifts for the high scenario should be treated as upper bounds. Incorporating processbased phenological models that explicitly account for chilling and photoperiod interactions would improve the realism of future projections.
Conclusion
Conclusion
Acknowledgement
Acknowledgements Funding SourcesThis research was supported by general institutional research funds from the Pondicherry Institute of Climate and Environment. No external competitive grants were applied. Institutional SupportThe authors thank the Pondicherry Institute of Climate and Environment for computing and data analysis resources. Phenological and climate data were accessed through the German Meteorological Service (DWD) open data portal. Contributions Not Qualifying for AuthorshipThe authors acknowledge the DWD volunteer phenological observers whose decades of record-keeping made this long-term analysis possible.
Figures and tables from the paper
| Elevation Band | Stations (n) | Leaf-Out Trend (d/dec) | Leaf-Fall Trend (d/dec) | GS Change (d/dec) | Total GS Gain (d) | p-value |
|---|---|---|---|---|---|---|
| 300–500 m | 10 | −4.2 | +2.9 | +7.1 | 18 | < 0.001 |
| 500–700 m | 11 | −4.0 | +2.8 | +6.8 | 17 | < 0.001 |
| 700–900 m | 9 | −3.7 | +2.7 | +6.4 | 16 | < 0.001 |
| 900–1100 m | 7 | −3.4 | +2.4 | +5.8 | 14 | 0.002 |
| 1100–1400 m | 5 | −3.1 | +2.2 | +5.3 | 13 | 0.008 |
| All Stations | 42 | −3.8 | +2.7 | +6.5 | 16 (mean) | < 0.001 |
Table text extracted from the original PDF; superscript letters are shown inline. The original table image is below.
View original table image
References
13 in the original paper- Menzel A, Sparks TH, Estrella N, Koch E, Aasa A, Aha R. European phenological response to climate change matches the warming pattern. Global Change Biology. 2006;12(10):1969-1976.
- Auer I, Böhm R, Jurkovic A, Lipa W, Orlik A, Potzmann R. HISTALP-historical instrumental climatological surface time series of the Greater Alpine Region. International Journal of Climatology. 2007;27(1):17-46.
- Cleland EE, Chuine I, Menzel A, Mooney HA, Schwartz MD. Shifting plant phenology in response to global change. Trends in Ecology and Evolution. 2007;22(7):357-365.
- Keenan TF, Gray J, Friedl MA, Toomey M, Bohrer G, Hollinger DY. Net carbon uptake has increased through warming-induced changes in temperate forest phenology. Nature Climate Change. 2014;4(7):598604.
- Chmielewski FM, Rötzer T. Response of tree phenology to climate change across Europe. Agricultural and Forest Meteorology. 2001;108(2):101112.
- Meier U. Growth stages of mono-and dicotyledonous plants: BBCH Monograph. Julius Kühn-Institut. 2018;1:1-204.
- Vitasse Y, Delzon S, Dufrêne E, Pontailler JY, Louvet JM, Kremer A. Leaf phenology sensitivity to temperature in European trees: Do within-species populations exhibit similar responses? Agricultural and Forest Meteorology. 2009;149(5):735-744.
- Fu YH, Zhao H, Piao S, Peaucelle M, Peng S, Zhou G. Declining global warming effects on the phenology of spring leaf unfolding. Nature. 2015;526(7571):104107.
- Jacob D, Petersen J, Eggert B, Alias A, Christensen OB, Bouwer LM. EURO-CORDEX: New highresolution climate change projections for European impact research. Regional Environmental Change. 2014;14(2):563-578.
- Körner C, Basler D. Phenology under global warming. Science. 2010;327(5972):1461-1462.
- Templ B, Templ M, Filzmoser P, Lehoczky A, Baksiene E, Fleck S. Phenological patterns of flowering across biogeographical regions of Europe. International Journal of Biometeorology. 2017;61(7):1347-1358.
- Pepin NC, Lundquist JD. Temperature trends at high elevations: Patterns across the globe. Geophysical Research Letters. 2008;35(14):L14701. 13. Augspurger CK. Reconstructing patterns of temperature, phenology, and frost damage over 124 years: Spring damage risk is increasing. Ecology. 2013;94(1):41-50.
- Chuine I, Beaubien EG. Phenology is a major determinant of tree species range. Ecology Letters. 2001;4(5):500-510