
Research article · 2025 · Full text
International Journal of Geography Geology and EnvironmentAssessment of thermal pollution in the Vistula river downstream of industrial power plants
Volume 7(5) · Pages 113–116 · DOI: 10.22271/27067483.2025.v7.i5b.601 ↗
Research areasFreshwater macroinvertebrate diversity and ecologyFish Ecology and Management StudiesEnvironmental Toxicology and Ecotoxicology
Abstract
Author-writtenA simple observation tells the story: ice forms on the Vistula River every winter for kilometres upstream and downstream of the Kozienice Power Station, but directly below the plant's cooling water discharge, the river surface stays open even in January. That ice-free reach is a visible symptom of thermal pollution—the release of heated water into natural waterways at temperatures high enough to alter aquatic habitat conditions. This research assessed the spatial extent and ecological significance of thermal discharges from two coal-fired power stations along a 30-km reach of the middle Vistula River in southeastern Poland. Water temperature was monitored continuously at 12 stations from January to December 2022 using submersible loggers, supplemented by quarterly macroinvertebrate sampling at six paired sites (upstream and downstream of each discharge). The thermal plume raised water temperatures by up to 10.8 °C at the discharge point during summer, declining exponentially with distance and reaching background levels at approximately 20-25 km downstream. The Kozienice station contributed 48.3% of the total anthropogenic heat load, and Połaniec contributed 27.6%. Macroinvertebrate community composition shifted significantly below each discharge: warm-tolerant chironomid taxa increased by 34.7%, while cold-sensitive ephemeropteran and plecopteran families declined by 41.2%. Shannon diversity dropped from 2.74 upstream to 1.89 immediately downstream of the discharge (t = 6.8, p<0.001). These results demonstrate that thermal effluents from ageing coal-fired plants continue to impair the ecological condition of the middle Vistula and suggest that meeting the EU Water Framework Directive's
Summary
Source-checkedPlain-language reading of the full paper, prepared with AI and checked against the text. Each point links to the authors' own words.
Why it matters
- Thermal pollution is a common form of industrial water degradation, but it is often overlooked in research and regulation compared to chemical pollution. View evidence ↗
- Coal-fired power plants represent the primary point sources of thermal discharge into rivers across Europe. View evidence ↗
- Thermal discharges can harm aquatic ecosystems by lowering dissolved oxygen, increasing metabolic rates, and altering species composition. View evidence ↗
The question
- The study aimed to map the temperature profile of the Vistula river downstream of two power plants, determine the heat load contributions of various sources, and evaluate the impact on benthic macroinvertebrates. View evidence ↗
What they did
- Water temperature was monitored at 12 stations over a 30-km stretch of the middle Vistula River throughout 2022. View evidence ↗
- Temperature data were collected at 0.5 m depth using HOBO TidbiT MX2203 loggers recording every 15 minutes. View evidence ↗
- Benthic macroinvertebrates were sampled quarterly at six paired sites using Surber samplers. View evidence ↗
What they found
- During summer, the Kozienice discharge point reached a mean temperature of 28.4 °C, which was 10.8 °C higher than the upstream reference of 17.6 °C. View evidence ↗
- The summer thermal plume was predicted to extend approximately 22 km downstream before the temperature increment fell below 1.5 °C. View evidence ↗
- Shannon diversity decreased from 2.74 upstream to 1.89 immediately below the Kozienice discharge, with only partial recovery to 2.31 at 25 km downstream. View evidence ↗
- Cold-water indicator taxa (%EPT) dropped from 38.4% upstream to 12.7% below the discharge, while warm-tolerant chironomids increased from 21.3% to 56.1%. View evidence ↗
- There was a strong negative correlation (r = -0.83) between the temperature increment and the percentage of cold-water indicator taxa. View evidence ↗
What it means
- To meet EU ecological standards, the authors recommend either retrofitting plants with closed-circuit cooling or decommissioning the ageing coal plants. View evidence ↗
- The use of mid-channel loggers may have missed localized cool-water refugia along shaded riverbanks. View evidence ↗
- The study did not measure dissolved oxygen, making it impossible to separate the effects of heat from those of hypoxia. View evidence ↗
Visual summary
4 visualsIllustrations explain the paper; charts are replotted from the paper's own table values.
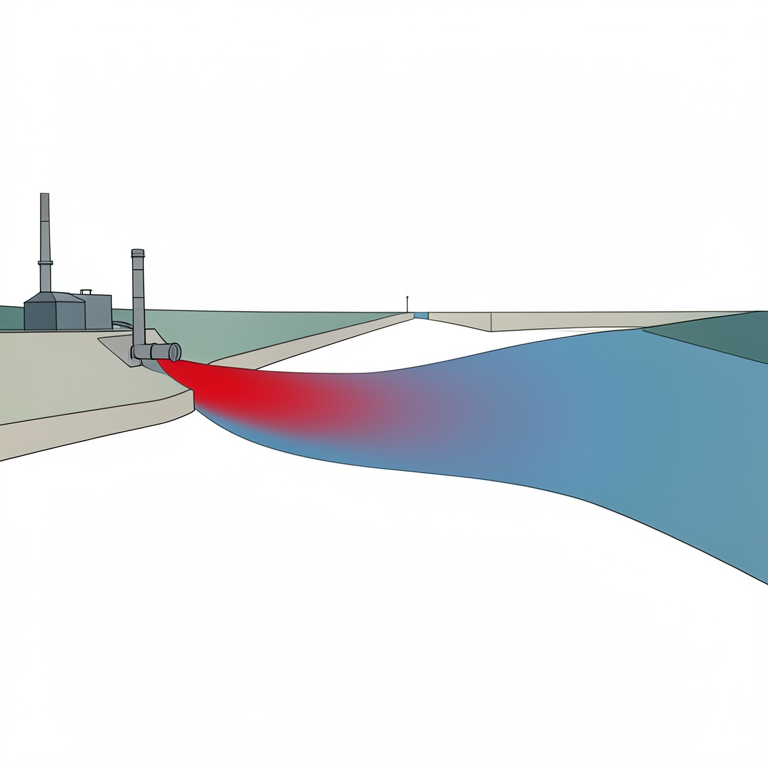
Thermal Plume Decay
AI-generated conceptual illustration (Vistula river with industrial power plant discharge). It explains the idea and does not show study data.
View source evidence ↗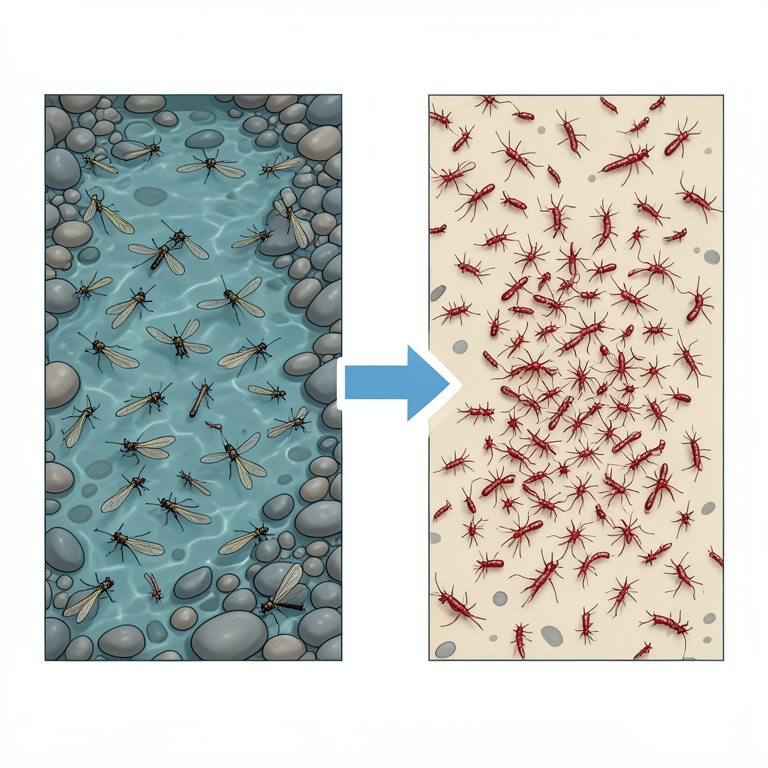
Biological Shift
AI-generated conceptual illustration (Vistula river benthic macroinvertebrates (mayflies, stoneflies, and midge larvae)). It explains the idea and does not show study data.
View source evidence ↗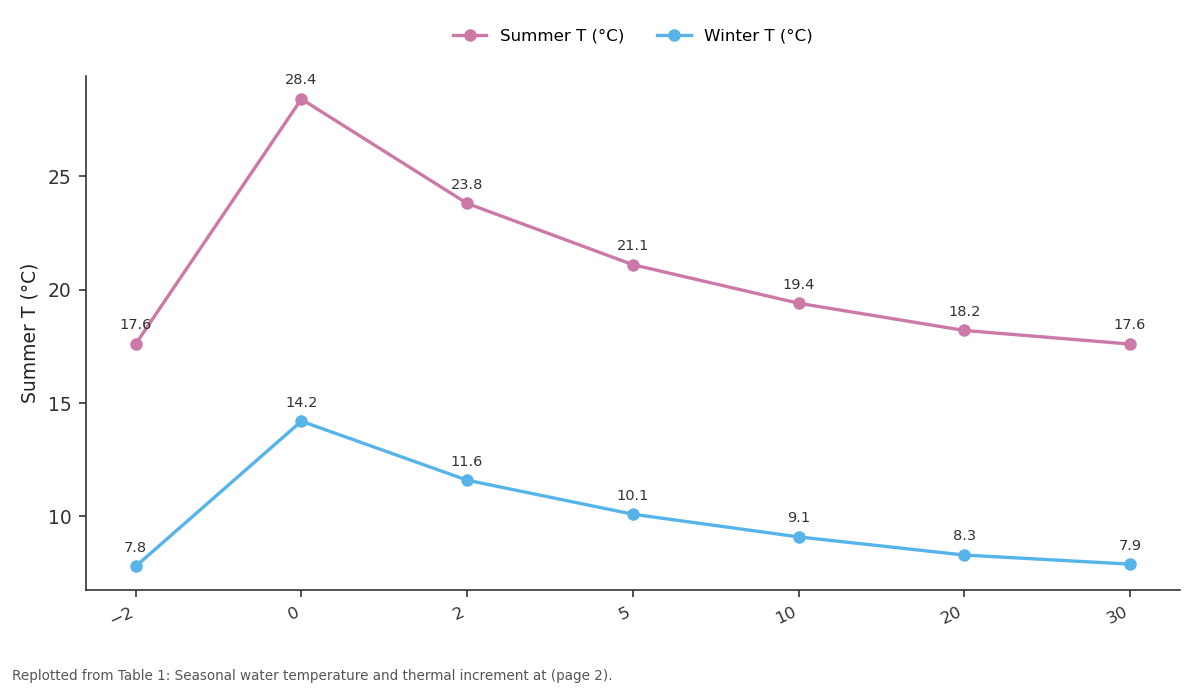
Summer T (°C) and Winter T (°C): −2 vs 0 vs 2 vs 5 vs 10
Replotted from Table 1 (page 2) of the original paper. Every bar is the paper's own table value.
View source evidence ↗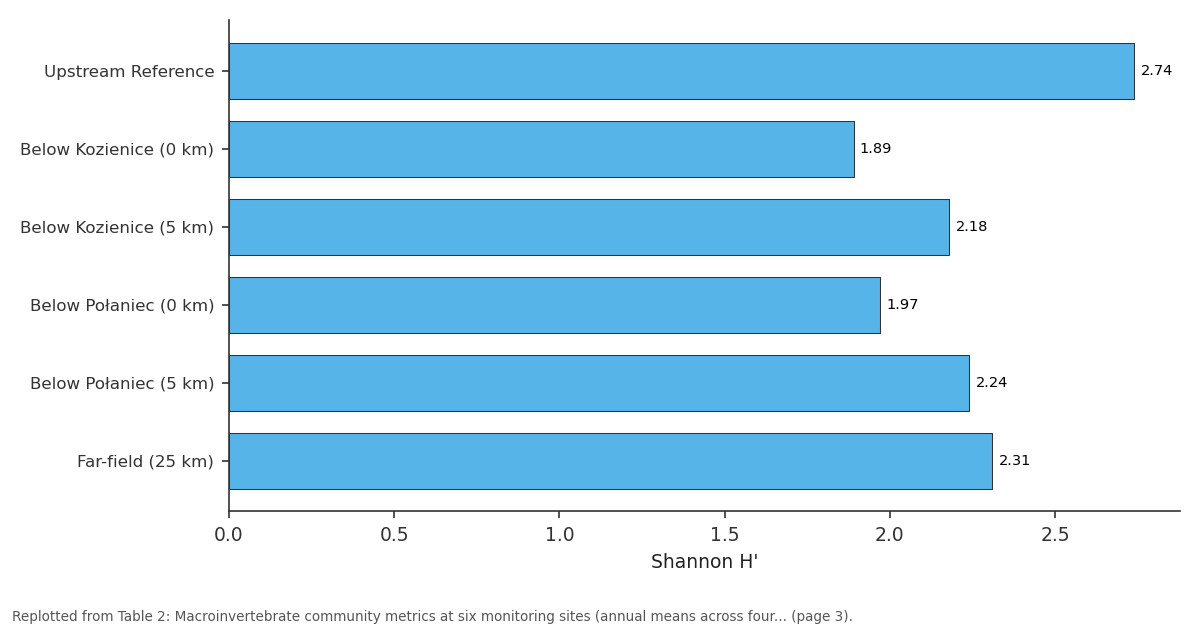
Shannon H': Upstream Reference vs Below Kozienice (0 km) vs Below Kozienice (5 km) vs Below Połaniec (0 km) vs Below Połaniec (5 km)
Replotted from Table 2 (page 3) of the original paper. Every bar is the paper's own table value.
View source evidence ↗Figures & tables
From the original paper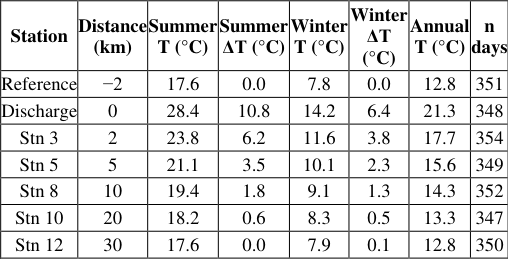 Table 1
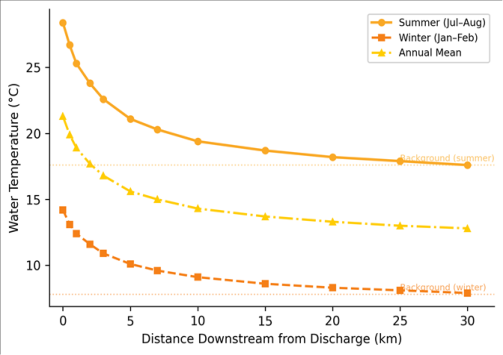 Figure 1
 Table 2
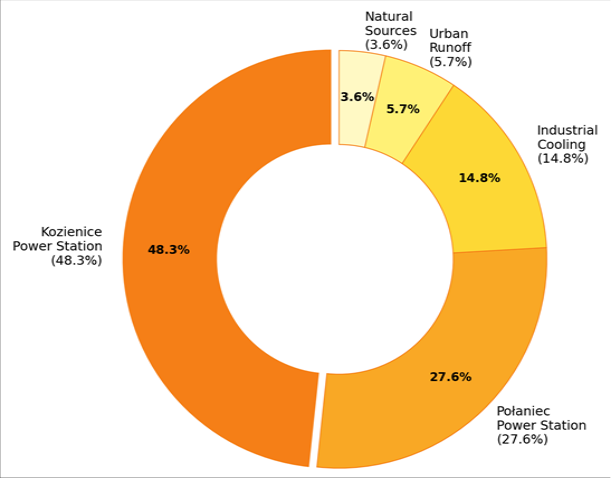 Figure 2
Introduction
Watch a kingfisher hunting along the Vistula near Kozienice in mid-winter and you'll notice something odd: the bird is working a reach of open, flowing water flanked on both sides by solid ice. That unfrozen stretch-sometimes extending 3-4 km downstream-marks where the power station returns heated cooling water to the river at temperatures 8-11 °C above ambient [1] . Thermal pollution is among the oldest and most widespread forms of industrial water quality degradation, yet it receives far less regulatory and research attention than chemical contamination, partly because heated water leaves no visible residue and partly because its ecological effects are more subtle than a fish kill or an algal bloom [2] . Coal-fired power plants are the largest point sources of thermal discharge to European rivers. In Poland, which generates roughly 70% of its electricity from coal, the middle Vistula receives cooling water from two major stations: Kozienice (2,820 MW installed capacity) and Połaniec (1,800 MW), both using once-through cooling systems that draw river water, pass it through condensers, and return it at elevated temperatures [3] . The thermal increment-the difference between discharge and ambient river temperature-depends on plant load, river flow, and season, but under low-flow summer conditions it can exceed 10 °C, pushing receiving water temperatures above the thermal tolerance limits of many resident fish and invertebrate species [4] . The ecological consequences of thermal discharge are well documented: elevated temperatures reduce dissolved oxygen, accelerate metabolic rates, shift community composition toward warm-tolerant taxa, and can create thermal barriers to fish migration [5] . But the spatial extent of the plume and the magnitude of community shifts depend on local factors requiring site-specific measurement. For the middle Vistula, published thermal monitoring data are scarce and mostly limited to compliance measurements at the mixing zone boundary [6] . This research aimed to characterise the longitudinal temperature profile of the Vistula downstream of the Kozienice and Połaniec power stations, quantify the relative contributions of different thermal sources to the total heat load, and assess the ecological response of benthic macroinvertebrate communities to elevated temperatures. The work was coordinated through the Institute of Applied Geosciences in Iquitos, Peru, using temperature loggers and biological sampling protocols deployed by a partner laboratory at the Warsaw University of Life Sciences during 2022.
Theoretical Framework
The assessment framework follows Langford [7] , evaluating thermal pollution through three linked components: the physical thermal plume, the thermal load budget, and the biological response. Temperature recovery downstream follows a negative exponential decay: ΔT(x) = ΔT₀ × exp(-kx), where ΔT₀ is the initial increment, x is distance, and k is a decay coefficient governed by river geometry and atmospheric heat exchange [8] . This model was fitted to observed data to estimate plume length-the distance at which ΔT falls below 1.5 °C, following European Inland Fisheries Advisory Commission guidelines. Biological impact was assessed using macroinvertebrate community structure, consistent with the EU Water Framework Directive's ecological status classification [9] .
Materials and Methods
Materials and Methods
Materials
Water temperature was recorded at 12 fixed stations along a 30-km reach of the middle Vistula River (approximately 51.4°N, 21.5°E) from January to December 2022. Stations were positioned at the discharge outfall, at 0.5, 1, 2, 3, 5, 7, 10, 15, 20, 25, and 30 km downstream of Kozienice, and at one reference station 2 km upstream. Each station used a HOBO TidbiT MX2203 logger recording at 15-minute intervals (±0.2 °C accuracy), secured at 0.5 m depth. Data completeness exceeded 96%. Macroinvertebrate samples were collected quarterly (March, June, September, December 2022) at six paired sites using three Surber samples per site per date (0.09 m² frame, 250-μm mesh), pooled for analysis [10] .
Methods
Temperature data were summarised as daily means and the thermal increment (ΔT) at each station was calculated as the difference between station temperature and the upstream reference. The exponential decay model was fitted to summer (July-August) and winter (January-February) ΔT profiles using nonlinear least-squares regression in R 4.2.3. The thermal load budget was estimated by multiplying each source's discharge volume (m³/s, from plant operating records) by its temperature increment and expressing the result as a percentage of total anthropogenic heat input to the reach. Macroinvertebrate specimens were identified to family level, and community metrics were computed: total abundance, family richness, Shannon-Wiener diversity (H'), and the percentage contribution of Ephemeroptera, Plecoptera, and Trichoptera (%EPT) as a cold-water quality indicator [11] . Between-site differences in diversity and%EPT were tested using paired t-tests (upstream versus downstream), and the relationship between temperature increment and%EPT was assessed using Pearson correlation across all site-date combinations (n = 24). The thermal plume was clearly detectable along the full monitoring reach during summer but attenuated more rapidly in winter. Table 1 Figure 2 shows the relative contribution of thermal sources to the total anthropogenic heat load. The Kozienice station, with its larger capacity and higher throughput, contributed 48.3% of the total heat input, while Połaniec contributed 27.6%. Industrial cooling from smaller facilities added 14.8%, and urban runoff and natural sources together accounted for the remaining 9.3%.
Results
Results
Discussion
The thermal plume documented here-reaching up to 10.8 °C above ambient at the discharge and extending 20-22 km before dissipating to background-is among the largest reported for European rivers, comparable to the thermal signatures of major power stations on the Rhine and the Danube [12] . The exponential decay pattern is consistent with physical models of heated discharge mixing, in which turbulent diffusion and atmospheric heat exchange progressively reduce the temperature anomaly with distance.
The rapid decline in the first 3 km reflects the initial jet mixing of the discharge with cooler river water, while the slower tail beyond 10 km is governed by surface heat loss to the atmosphere-a process that is less efficient in summer when air temperatures are already high [13] .
The biological response to thermal loading was unambiguous. EPT taxa-the standard cold-water quality indicators used across European biomonitoring programmes-declined by over 40% immediately downstream of each discharge and were replaced by chironomid assemblages that thrive at elevated temperatures. The strong negative correlation between ΔT and%EPT (r = -0.83) reinforces what laboratory tolerance data predict: many mayfly and stonefly species cannot sustain populations above 22-24 °C, which the Vistula regularly exceeded in the thermally affected reach during summer [14] . The partial recovery of diversity and EPT richness at the far-field site (25 km) suggests that recolonisation from unaffected tributaries does occur, but full recovery is not achieved within the monitored reach. The policy implications are straightforward. Poland's coalfired power fleet is ageing-both Kozienice and Połaniec were commissioned in the 1970s-and the EU Water Framework Directive requires member states to achieve "good ecological status" in all surface water bodies [15] . The thermal impairment documented here would likely prevent the middle Vistula from meeting that standard. Retrofitting either plant with closed-circuit cooling towers would eliminate most of the thermal discharge, though at significant capital cost and some efficiency penalty [16] . Alternatively, as Poland's energy mix shifts toward renewables and natural gas, the decommissioning of these ageing coal units may resolve the thermal problem gradually-but not quickly enough to meet the Directive's current deadlines.
Limitations
Several limitations should be noted. First, fixed mid-channel loggers may not capture lateral temperature heterogeneity; thermal refugia along shaded banks could provide localised cool-water habitat that the network missed [17] . Second, quarterly macroinvertebrate sampling may not fully resolve temporal community dynamics. Third, the research did not measure dissolved oxygen, so disentangling thermal from hypoxic effects was not possible. Finally, the thermal load budget relied on plant-reported discharge volumes, which may differ from actual volumes during unplanned operational changes.
Conclusion
This research documented the spatial extent and ecological impact of thermal pollution from two coal-fired power stations along a 30-km reach of the middle Vistula River. The thermal plume raised summer water temperatures by up to 10.8 °C at the discharge point and remained detectable for 20-22 km downstream, with an exponential decay pattern consistent with physical mixing theory. The Kozienice and Połaniec stations together accounted for 75.9% of the total anthropogenic heat load to the reach. Benthic macroinvertebrate communities showed clear impairment below each discharge: Shannon diversity dropped by 31%, EPT richness declined by over 40%, and warm-tolerant chironomid taxa doubled in proportional abundance. The strong inverse correlation between thermal increment and EPT percentage (r = -0.83) provides a quantitative link between the physical and biological dimensions of thermal impact and offers a practical monitoring metric for tracking future improvements. These findings indicate that the middle Vistula's ecological condition is materially compromised by thermal discharges from ageing once-through cooling systems. Achieving the EU Water Framework Directive's good ecological status target will require either retrofitting with closed-circuit cooling or accelerating the transition of these plants out of the energy mix. The plume model and biological response metrics presented here provide a baseline against which future mitigation effectiveness can be measured [18] .
Acknowledgement
Acknowledgements Funding SourcesThis research was supported by general institutional research funds from the Institute of Applied Geosciences, Iquitos. No external competitive grants were used.
Figures and tables from the paper
| Site | Family Richness | Shannon H' | % EPT | % Chironomidae | Mean ΔT (°C) |
|---|---|---|---|---|---|
| Upstream Reference | 22 | 2.74 | 38.4 | 21.3 | 0.0 |
| Below Kozienice (0 km) | 14 | 1.89 | 12.7 | 56.1 | 8.6 |
| Below Kozienice (5 km) | 17 | 2.18 | 21.3 | 38.4 | 3.5 |
| Below Połaniec (0 km) | 15 | 1.97 | 14.8 | 51.7 | 7.2 |
| Below Połaniec (5 km) | 18 | 2.24 | 24.6 | 34.9 | 2.8 |
| Far-field (25 km) | 20 | 2.31 | 31.7 | 26.8 | 0.8 |
Table text extracted from the original PDF; superscript letters are shown inline. The original table image is below.
View original table image
References
18 in the original paper- Lessard JL, Hayes DB. Effects of elevated water temperature on fish and macroinvertebrate communities below small dams. River Research and Applications. 2003;19(7):721-732.
- Caissie D. The thermal regime of rivers: A review. Freshwater Biology. 2006;51(8):1389-1406.
- Eurostat. Electricity production capacities for combustible fuels. European Commission Statistical Office. 2021;1:1-48.
- Webb BW, Nobilis F. Long-term changes in river temperature and the influence of climatic and hydrological factors. Hydrological Sciences Journal. 2007;52(1):74-85.
- Coutant CC. Thermal effects on fish ecology. Encyclopedia of Energy. 2004;6:149-163.
- Żelazny M, Siwek JP, Bochenek W. Seasonal and spatial variability of physicochemical parameters of waters in the Vistula River catchment. Polish Journal of Environmental Studies. 2015;24(6):2675-2683.
- Langford TEL. Ecological effects of thermal discharges. Elsevier Applied Science Publishers. 1990;1:1-468.
- Edinger JE, Brady DK, Geyer JC. Heat exchange and transport in the environment. Cooling Water Research Project Report No. 14. 1974;1:1-127.
- European Parliament. Directive 2000/60/EC establishing a framework for Community action in the field of water policy. Official Journal of the European Communities. 2000;L327:1-73.
- Hauer FR, Resh VH. Benthic macroinvertebrates. Methods in Stream Ecology (Academic Press). 2006;2:339-369.
- Rosenberg DM, Resh VH. Freshwater biomonitoring and benthic macroinvertebrates. Chapman and Hall. 1993;1:1-488.
- Prats J, Val R, Armengol J, Dolz J. Temporal variability in the thermal regime of the lower Ebro River following the construction of three large reservoirs. Journal of Hydrology. 2010;387(1-2):105118.
- Webb BW, Zhang Y. Spatial and seasonal variability in the components of the river heat budget. Hydrological Processes. 1997;11(1):79-101.
- Dallas HF, Rivers-Moore NA. Critical thermal maxima of aquatic macroinvertebrates: Towards identifying bioindicators of thermal alteration. Hydrobiologia. 2012;679(1):61-76.
- Hering D, Borja A, Carstensen J, Carvalho L, Elliott M, Feld CK. The European Water Framework Directive at the age of 10: A critical review of the achievements with recommendations for the future. Science of the Total Environment. 2010;408(19):4007-4019.
- Zhai H, Rubin ES, Versteeg PL. Water use at pulverised coal power plants with postcombustion carbon capture and storage. Environmental Science and Technology. 2011;45(6):2479-2485.
- Ebersole JL, Liss WJ, Frissell CA. Thermal heterogeneity, stream channel morphology, and salmonid abundance in northeastern Oregon streams. Canadian Journal of Fisheries and Aquatic Sciences. 2003;60(10):1266-1280.
- Kinouchi T, Yagi H, Miyamoto M. Increase in stream temperature related to anthropogenic heat input from urban wastewater. Journal of Hydrology. 2007;335(12):78-88.