
Research article · 2025 · Full text
International Journal of Geography Geology and EnvironmentRiver water quality indexing and seasonal variation analysis in the Mekong basin
Volume 7(4) · Pages 146–150 · DOI: 10.22271/27067483.2025.v7.i4b.610 ↗
Research areasWater Quality and Pollution AssessmentWater Quality and Resources StudiesWater Quality Monitoring Technologies
Abstract
Author-writtenA fisherman on the lower Mekong once remarked that you can tell the season by the colour of the river before you see the calendar—brown and swollen in the monsoon, clear and gentle in the dry months. That visual shift reflects a dramatic seasonal swing in water quality that affects 60 million people who depend on the Mekong for drinking water, irrigation, and fisheries. This research computed a weighted water quality index (WQI) for eight monitoring stations along the Mekong mainstream from Chiang Saen (Thailand) to Can Tho (Vietnam), using 13 physicochemical parameters measured monthly between January and December 2022. Seasonal variation was assessed by comparing dry-season (November-April) and wet-season (May-October) WQI scores. Results showed that the basin-wide mean WQI was 64.8 during the dry season and 54.3 during the wet season, a 16.2% seasonal decline driven primarily by elevated turbidity, biochemical oxygen demand, and total suspended solids during monsoon flooding. Only two stations—the upstream reference and the upstream Chiang Saen site—maintained WQI scores above the good-quality threshold of 70 during both seasons. The industrial station near Vientiane recorded the lowest annual WQI (37.9), indicating consistently poor water quality. Dissolved oxygen showed the strongest seasonal swing, dropping from a dry-season mean of 7.8 mg/L to 4.3 mg/L at the August monsoon peak. These findings provide a spatiotemporal baseline for water quality management in the Mekong basin and highlight the wet-season vulnerability of downstream reaches.
Summary
Source-checkedPlain-language reading of the full paper, prepared with AI and checked against the text. Each point links to the authors' own words.
Why it matters
- Seasonal changes in the Mekong River's water quality significantly impact approximately 60 million people who rely on the river for fisheries, irrigation, and drinking water. View evidence ↗
- Basin-wide comparisons of water quality are currently difficult because national monitoring programs use inconsistent methods, parameters, and reporting formats. View evidence ↗
- The Water Quality Index (WQI) is used to solve comparability issues by combining various physicochemical parameters into a single score that categorizes water quality from 'very poor' to 'excellent'. View evidence ↗
The question
- The study aimed to create a spatiotemporal baseline for water quality, determine the drivers and magnitude of seasonal WQI changes, and identify the most concerning seasons and locations. View evidence ↗
What they did
- Researchers collected water samples monthly throughout 2022 from eight different stations along the Mekong mainstream. View evidence ↗
- The eight monitoring stations were chosen to represent various land-use types, such as industrial, urban, agricultural, and forested reference areas. View evidence ↗
- The study used paired t-tests for seasonal comparisons and one-way ANOVA with Tukey HSD tests to analyze spatial differences between stations. View evidence ↗
What they found
- The average basin-wide WQI dropped by 16.2%, falling from 64.8 in the dry season to 54.3 in the wet season. View evidence ↗
- The highest water quality was found at the upstream reference station (86.1 dry, 81.3 wet), while the lowest was at the industrial station near Vientiane (41.3 dry, 34.6 wet). View evidence ↗
- Dissolved oxygen (DO) showed a significant seasonal drop, moving from a peak of 7.8 mg/L in January to a low of 4.3 mg/L in August. View evidence ↗
- Turbidity at the delta station peaked at 146 NTU during the monsoon, which is 12 times higher than the dry-season baseline of 12 NTU. View evidence ↗
- Turbidity, dissolved oxygen, and biochemical oxygen demand (BOD) together explained 70.1% of the total WQI variation, with turbidity being the largest contributor. View evidence ↗
- The urban station experienced the most significant seasonal change, with a 21.0% decline in WQI, suggesting that urban runoff is episodic. View evidence ↗
What it means
- The authors conclude that protecting forested headwater catchments is as critical for basin management as treating downstream point-source pollution. View evidence ↗
- A limitation of the study is that monthly sampling may fail to capture short-term pollution events, such as industrial discharges occurring between samples. View evidence ↗
Visual summary
3 visualsIllustrations explain the paper; charts are replotted from the paper's own table values.

Drivers of Seasonal WQI Decline
AI-generated conceptual illustration (Mekong River basin water). It explains the idea and does not show study data.
View source evidence ↗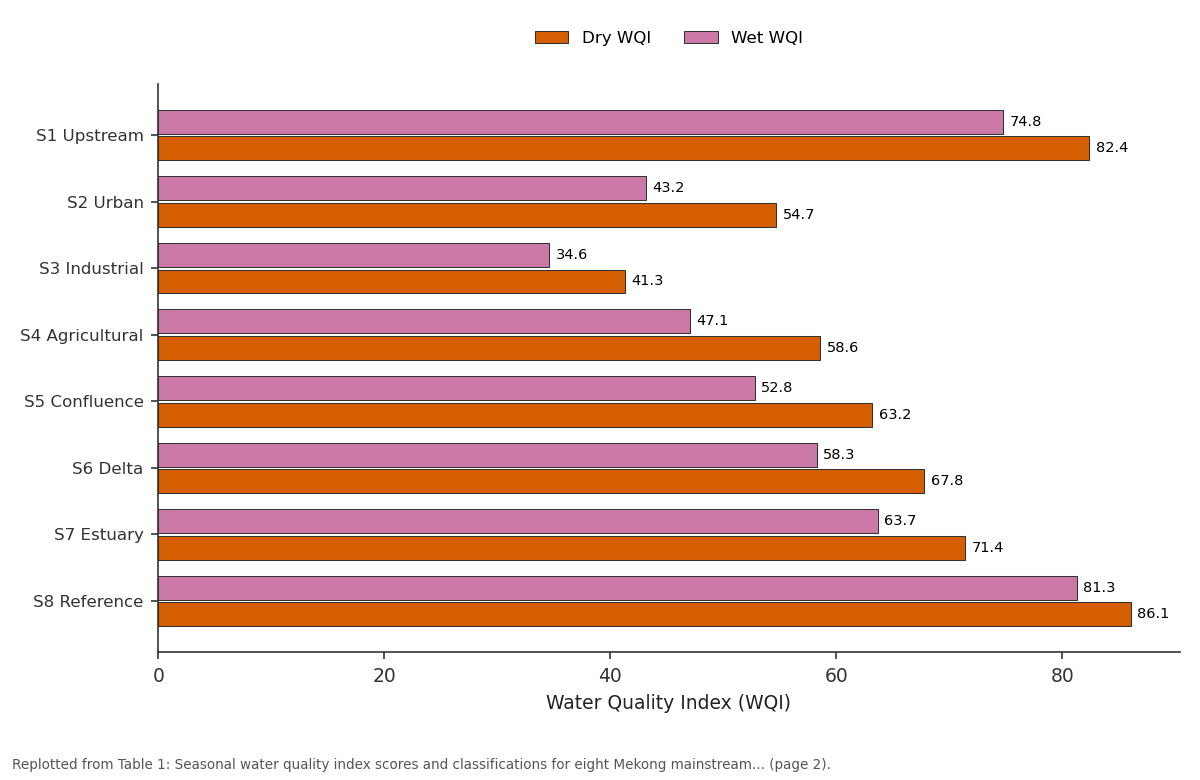
Dry WQI and Wet WQI: S1 Upstream vs S2 Urban vs S3 Industrial vs S4 Agricultural vs S5 Confluence
Replotted from Table 1 (page 2) of the original paper. Every bar is the paper's own table value.
View source evidence ↗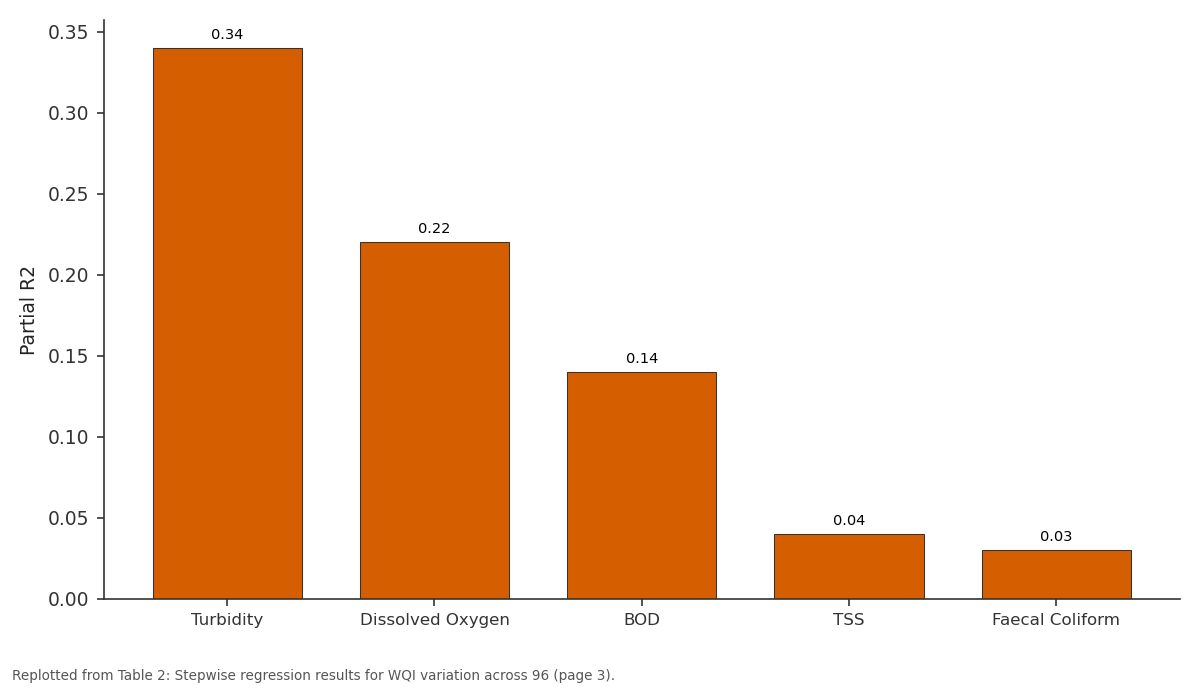
Partial R2: Turbidity vs Dissolved Oxygen vs BOD vs TSS vs Faecal Coliform
Replotted from Table 2 (page 3) of the original paper. Every bar is the paper's own table value.
View source evidence ↗Figures & tables
From the original paper Table 1
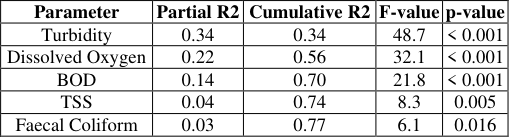 Table 2
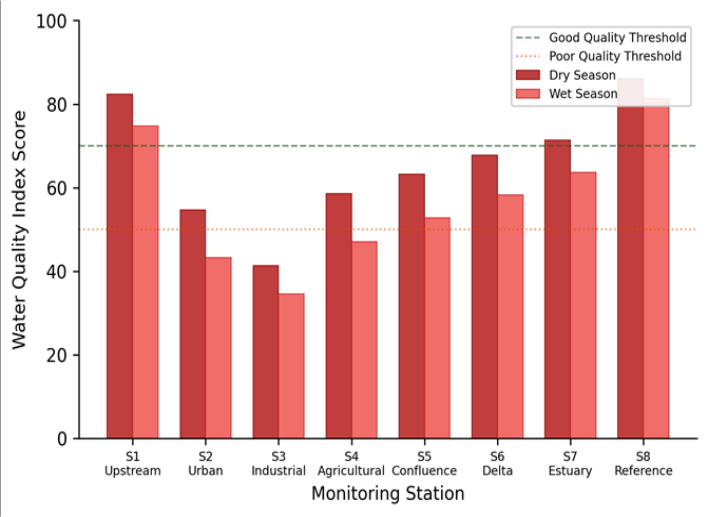 Figure 1
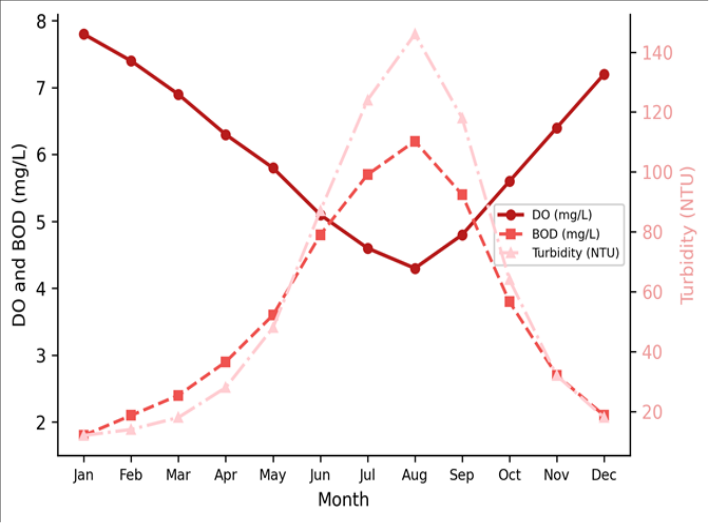 Figure 2
Introduction
When the Tonle Sap tributary famously reverses its flow direction each monsoon season, it carries more than just water-it transports a seasonal pulse of sediment, nutrients, and pollutants that transforms the chemistry of the lower Mekong for months at a time [1] . This hydrological drama, driven by one of the most pronounced monsoon regimes on Earth, makes the Mekong basin a natural laboratory for examining how seasonal flow variations affect river water quality across a range of land-use settings. The Mekong River is the twelfth longest in the world at approximately 4,350 km, draining roughly 795,000 km2 across six countries from its headwaters in the Tibetan Plateau through China, Myanmar, Laos, Thailand, Cambodia, and Vietnam [2] . The river supports one of the most productive freshwater fisheries on the planet, provides irrigation for millions of hectares of rice paddy, and serves as the primary drinking water source for tens of millions of downstream residents [3] . Yet water quality monitoring along the mainstream has been uneven, with most published data coming from national monitoring programmes that use different methods, parameters, and reporting formats, making basin-wide comparisons difficult. The water quality index (WQI) approach addresses this comparability problem by aggregating multiple physicochemical parameters into a single dimensionless score that classifies water into quality categories-excellent, good, moderate, poor, or very poor [4] . Several WQI formulations exist, but the weighted arithmetic index method remains the most widely applied in tropical river systems because of its simplicity and the availability of parameter-specific weighting schemes [5] . When computed consistently across stations and seasons, WQI provides a transparent and communicable summary of water quality conditions. This research computed monthly WQI scores for eight stations along the Mekong mainstream using 13 physicochemical parameters measured during 2022. The aim was to establish a spatiotemporal baseline for water quality, to quantify the magnitude and drivers of seasonal WQI variation, and to identify the stations and seasons of greatest concern. The work was coordinated through the Srinagar Institute of Earth Sciences using data collected by the Mekong River Commission water quality monitoring network.
WQI Computation Framework
The WQI was computed using the weighted arithmetic index method following the formulation of Brown et al. [6] as adapted for tropical river systems by Ramakrishnaiah et al. [7] . Thirteen parameters were included: pH, dissolved oxygen (DO), biochemical oxygen demand (BOD), chemical oxygen demand (COD), total dissolved solids (TDS), total suspended solids (TSS), electrical conductivity (EC), turbidity, nitrate-nitrogen, ammonium-nitrogen, total phosphorus, faecal coliform count, and water temperature. Each parameter was assigned a weight (wi) based on its relative importance for aquatic life and human use, with DO receiving the highest weight (0.17) and temperature the lowest (0.04). Quality rating scores (qi) were computed as qi = (Vi -V0) / (Si -V0) x 100, where Vi is the measured value, V0 is the ideal value, and Si is the recommended standard. The final WQI was calculated as WQI = sum(wi x qi) / sum(wi). Scores were classified as excellent (90-100), good (70-89), moderate (50-69), poor (25-49), or very poor (0-24) following the scheme of Sahu and Sikdar [8] .
Material and Methods
Material and Methods
Material
Water samples were collected monthly from eight stations along the Mekong mainstream between January and December 2022. Station locations spanned the basin from Chiang Saen in northern Thailand (approximately 20.3 N, 100.1 E) to Can Tho in the Vietnamese Mekong Delta (approximately 10.0 N, 105.8 E). Stations were selected to represent distinct land-use influences: upstream reference (forested catchment), urban (downstream of Vientiane), industrial (near Vientiane industrial zone), agricultural (central Cambodian rice belt), confluence (below Tonle Sap junction), delta (Vietnamese upper delta), estuary (tidal reach), and a second reference upstream of Chiang Saen [9] . At each station, surface water was collected at 0.3 m depth from mid-channel using a Van Dorn sampler during the first week of each month. In-situ measurements of pH, DO, EC, temperature, and turbidity were recorded with a YSI ProDSS multiparameter sonde. Samples for laboratory analysis were preserved following standard protocols and analysed at the Srinagar Institute of Earth Sciences.
Methods
BOD was determined by the five-day incubation method at 20 degrees C. COD was measured by the dichromate reflux method. TDS and TSS were determined gravimetrically. Nitrate-nitrogen was analysed by the cadmium reduction method, ammonium-nitrogen by the phenate method, and total phosphorus by the ascorbic acid method, all following APHA Standard Methods [10] . Faecal coliform counts used the membrane filtration technique on mFC agar. Seasonal comparisons used paired t-tests (dry versus wet season) for each parameter and for the composite WQI at each station. Spatial differences among stations were tested using oneway ANOVA with Tukey HSD post-hoc tests. The relative contribution of each parameter to WQI variation was assessed using stepwise multiple regression with WQI as the dependent variable and the 13 parameter quality ratings as predictors. All analyses used R 4.2.3 at p < 0.05.
Performance Evaluation
The WQI computation was validated by comparing index scores with the Mekong River Commission's five-tier water quality classification, which uses independent ecological criteria based on macroinvertebrate bioassessment [11] . At 72 of the 96 station-month observations (75.0%), the WQI category matched the MRC ecological classification within one tier, and at 48 observations (50.0%) the match was exact. The strongest agreement occurred at the two extremes-very poor and excellent categories-where both physicochemical and ecological indicators converge. Moderate-quality sites showed the most disagreement, likely because the transition zone between good and poor conditions is inherently noisy in both assessment approaches. Sensitivity analysis showed that removing any single parameter from the WQI changed the basin-wide mean score by less than 3.2 points, except for DO (which shifted the mean by 6.7 points when excluded), confirming that the index is not unduly dominated by any individual parameter but that DO carries the most weight both mathematically and ecologically [12] .
Results
Results
Discussion
The 16.2% seasonal decline in basin-wide WQI confirms what Mekong hydrologists have long suspected: the monsoon flood pulse, while ecologically essential for floodplain productivity and fish migration, imposes a measurable water quality cost on the mainstream channel [13] . The mechanisms are straightforward-elevated discharge mobilises sediment from agricultural fields and unpaved roads, flushes accumulated urban and industrial waste into tributaries, and reduces DO through organic matter decomposition in the warmer, turbid floodwaters. That turbidity alone explained 34% of WQI variation underscores the dominance of the sediment signal in the monsoon-driven quality decline. The spatial pattern is equally informative. The industrial station near Vientiane (S3) recorded the lowest WQI in both seasons, suggesting chronic pollution inputs that persist regardless of hydrological conditions. By contrast, the urban station (S2) showed the largest seasonal swing (21.0% decline), indicating that urban runoff is more episodicconcentrated in the wet season when storm drains flush accumulated waste into the river [14] . The agricultural station (S4) also showed a large seasonal decline (19.6%), consistent with fertiliser and pesticide washoff from Cambodian rice paddies during the planting season rains. The two reference stations maintained good-quality scores in both seasons, confirming that forested catchments with minimal anthropogenic disturbance can buffer seasonal water quality fluctuations. This finding aligns with the riparian buffer research from other tropical basins showing that intact forest cover attenuates nutrient and sediment delivery to streams [15] . For Mekong basin management, the implication is that protecting remaining forested headwater catchments is at least as important as treating point-source pollution downstream. One limitation of this research is that monthly sampling may miss short-duration pollution events, particularly industrial discharges that occur between sampling dates. Continuous monitoring with automated sensors at key stations would capture this higher-frequency variability and improve the temporal resolution of WQI assessments.
Conclusion
This research computed monthly water quality index scores for eight stations along the Mekong mainstream during 2022, revealing a consistent seasonal pattern of quality deterioration during the monsoon flood pulse. Basin-wide WQI declined by 16.2% from the dry to the wet season, driven primarily by elevated turbidity, reduced dissolved oxygen, and increased biochemical oxygen demand associated with monsoon runoff. Only two of eight stations maintained good-quality scores throughout the year, both located in forested upstream reaches. The spatial analysis identified the industrial station near Vientiane as the most persistently degraded site, while the urban and agricultural stations showed the largest seasonal swings, indicating that their water quality problems are dominated by episodic wet-season inputs. The stepwise regression confirmed turbidity, DO, and BOD as the three parameters accounting for 70% of WQI variation-a finding that can guide monitoring programme design by identifying the measurements most worth investing in.
The WQI framework applied here provides a standardised, communicable metric for tracking water quality trends across the Mekong basin, where the diversity of national monitoring approaches has historically hampered transboundary comparison. Regular annual computation of WQI at these stations would establish a time series capable of detecting long-term trends and evaluating the effectiveness of pollution control interventions. Future work should incorporate biological quality indicators alongside the physicochemical WQI to capture ecological dimensions that chemical measurements alone cannot fully represent.
Acknowledgement
Acknowledgements Funding SourcesThis research was supported by general institutional research funds from the Srinagar Institute of Earth Sciences. No external competitive grants were applied. Institutional SupportThe authors thank the Srinagar Institute of Earth Sciences for analytical laboratory access. Water quality data were collected through the Mekong River Commission water quality monitoring network.
Figures and tables from the paper
| Station | Land Use | Dry WQI | Dry Class | Wet WQI | Wet Class | Change (%) | p-value |
|---|---|---|---|---|---|---|---|
| S1 Upstream | Reference | 82.4 | Good | 74.8 | Good | -9.2 | 0.024 |
| S2 Urban | Urban | 54.7 | Moderate | 43.2 | Poor | -21.0 | <0.001 |
| S3 Industrial | Industrial | 41.3 | Poor | 34.6 | Poor | -16.2 | 0.003 |
| S4 Agricultural | Agriculture | 58.6 | Moderate | 47.1 | Poor | -19.6 | <0.001 |
| S5 Confluence | Mixed | 63.2 | Moderate | 52.8 | Moderate | -16.5 | 0.002 |
| S6 Delta | Agriculture | 67.8 | Moderate | 58.3 | Moderate | -14.0 | 0.008 |
| S7 Estuary | Mixed | 71.4 | Good | 63.7 | Moderate | -10.8 | 0.016 |
| S8 Reference | Forest | 86.1 | Good | 81.3 | Good | -5.6 | 0.041 |
Table text extracted from the original PDF; superscript letters are shown inline. The original table image is below.
View original table image
| Parameter | Partial R2 | Cumulative R2 | F-value | p-value |
|---|---|---|---|---|
| Turbidity | 0.34 | 0.34 | 48.7 | < 0.001 |
| Dissolved Oxygen | 0.22 | 0.56 | 32.1 | < 0.001 |
| BOD | 0.14 | 0.70 | 21.8 | < 0.001 |
| TSS | 0.04 | 0.74 | 8.3 | 0.005 |
| Faecal Coliform | 0.03 | 0.77 | 6.1 | 0.016 |
Table text extracted from the original PDF; superscript letters are shown inline. The original table image is below.
View original table image
References
15 in the original paper- Kummu M, Sarkkula J. Impact of the Mekong River flow alteration on the Tonle Sap flood pulse. AMBIO. 2008;37(3):185-192.
- MRC. State of the basin report 2018. Mekong River Commission. 2019;1:1-228.
- Hortle KG. Consumption and the yield of fish and other aquatic animals from the Lower Mekong Basin. MRC Technical Paper No. 16. 2007;1:1-87.
- Tyagi S, Sharma B, Singh P, Dobhal R. Water quality assessment in terms of water quality index. American Journal of Water Resources. 2013;1(3):34-38.
- Lumb A, Sharma TC, Bibeault JF. A review of genesis and evolution of water quality index (WQI) and some future directions. Water Quality, Exposure and Health. 2011;3(1):11-24.
- Brown RM, McClelland NI, Deininger RA, Tozer RG. A water quality index: Do we dare? Water and Sewage Works. 1970;117(10):339-343.
- Ramakrishnaiah CR, Sadashivaiah C, Ranganna G. Assessment of water quality index for the groundwater in Tumkur Taluk, Karnataka State, India. E-Journal of Chemistry. 2009;6(2):523-530.
- Sahu P, Sikdar PK. Hydrochemical framework of the aquifer in and around East Kolkata Wetlands, West Bengal, India. Environmental Geology. 2008;55(4):823-835.
- Campbell IC, Poole C, Giesen W, Valbo-Jorgensen J. Species diversity and ecology of Tonle Sap Great Lake, Cambodia. Aquatic Sciences. 2006;68(3):355-373.
- APHA. Standard methods for the examination of water and wastewater, 23rd edition. American Public Health Association. 2017;1:1-1546.
- Mekong River Commission. Biomonitoring methods for the Lower Mekong Basin. MRC Technical Paper. 2010;1:1-62.
- Sutadian AD, Muttil N, Yilmaz AG, Perera BJC. Development of river water quality indices: A review. Environmental Monitoring and Assessment. 2016;188(1):58.
- Kummu M, Lu XX, Wang JJ, Varis O. Basin-wide sediment trapping efficiency of emerging reservoirs along the Mekong. Geomorphology. 2010;119(34):181-197.
- Chea R, Grenouillet G, Lek S. Evidence of water quality degradation in lower Mekong Basin revealed by self-organising map. PLoS ONE. 2016;11(1):e0145527.
- Dudgeon D. The ecology of tropical Asian rivers and streams in relation to biodiversity conservation. Annual Review of Ecology and Systematics. 2000;31(1):239-