
Research article · 2025 · Full text
International Journal of Geography Geology and EnvironmentCoral reef degradation and water quality linkages in the great barrier reef marine reserve
Volume 7(5) · Pages 164–167 · DOI: 10.22271/27067483.2025.v7.i5c.607 ↗
Research areasCoral and Marine Ecosystems StudiesCoastal and Marine DynamicsCoastal and Marine Management
Abstract
Author-writtenMarine ecologists working on Caribbean reefs and those monitoring the Great Barrier Reef (GBR) have reached strikingly similar conclusions from opposite sides of the planet: nutrient enrichment from terrestrial runoff is accelerating coral decline in ways that compound the damage caused by thermal bleaching events. This research examined the relationship between water quality parameters and live coral cover across 75 permanent monitoring transects spanning five reef health categories in the central GBR lagoon, Queensland, Australia. Water quality and benthic community data were collected quarterly between January and December 2022. Dissolved inorganic nitrogen (DIN), dissolved inorganic phosphorus (DIP), chlorophyll-a, turbidity, and suspended sediment concentrations were measured at each transect and correlated with live coral cover, macroalgal cover, and coral diversity indices. Results showed that DIN was the strongest single predictor of coral cover decline (r = -0.78, p < 0.001), with each 1 umol/L increase in DIN associated with a 3.2 percentage-point decrease in live coral cover. Pristine reef transects maintained 62.4% coral cover at DIN levels below 1.5 umol/L, while algal-dominated transects averaged only 8.6% coral cover at DIN above 12 umol/L. Wet-season nutrient pulses elevated DIN by 2.4-fold compared with dry-season baselines, coinciding with a 14.3% seasonal reduction in coral cover at inshore reefs. Chlorophyll-a concentrations above 0.8 ug/L were associated with a shift from coral to macroalgal dominance. These findings reinforce the view that land-based nutrient inputs are a controllable driver of reef degradation and suggest that meeting the Reef 2050 Water Quality Improvement Plan targets for DIN reduction would measurably benefit coral communities in the central GBR lagoon.
Summary
Source-checkedPlain-language reading of the full paper, prepared with AI and checked against the text. Each point links to the authors' own words.
Why it matters
- Nutrient enrichment from land-based runoff accelerates the decline of coral reefs and worsens the impact of thermal bleaching events. View evidence ↗
- Agricultural land clearing for cattle grazing and sugarcane has increased nitrogen loads by four-fold and fine sediment by six-fold in the lagoon since European settlement. View evidence ↗
- Increased sediment and nutrient inputs reduce water clarity and promote the growth of macroalgae and phytoplankton, which outcompete reef-building corals. View evidence ↗
The question
- The study aimed to address the spatial mismatch in monitoring by performing co-located, seasonal measurements of water quality and benthic community composition at the same reef sites. View evidence ↗
What they did
- Researchers collected quarterly data in 2022 from 75 permanent transects in the central GBR lagoon, ranging from pristine outer-shelf to degraded inshore reefs. View evidence ↗
- Benthic composition was measured at 5-6 m depth using the point-intercept method across three 50-m replicate line transects per site, recording substrate every 0.5 m. View evidence ↗
- Water samples were analyzed for dissolved inorganic nitrogen (DIN) and dissolved inorganic phosphorus (DIP) using segmented flow colorimetry. View evidence ↗
What they found
- Dissolved inorganic nitrogen (DIN) was the strongest predictor of coral decline (r = -0.78), where every 1 umol/L increase in DIN correlated with a 3.2 percentage-point drop in live coral cover. View evidence ↗
- Pristine reefs had 62.4% coral cover at an average DIN of 1.2 umol/L, whereas algal-dominated reefs had only 8.6% coral cover at 13.8 umol/L DIN. View evidence ↗
- Inshore reefs experienced a 2.4-fold increase in DIN during the wet season (11.4 umol/L) compared to the dry season (4.7 umol/L), while offshore reefs remained stable. View evidence ↗
- Live coral cover at inshore reefs decreased by 14.3% between January and July, coinciding with the peak of post-flood nutrients. View evidence ↗
- A shift from coral dominance to macroalgal dominance was associated with chlorophyll-a concentrations exceeding 0.8 ug/L. View evidence ↗
What it means
- The authors conclude that reducing DIN loads from the Burdekin and nearby catchments is the most effective way to improve the condition of inshore reefs in the central GBR. View evidence ↗
- The study predicts that lowering inshore DIN from wet-season levels of ~11 umol/L to the 2.0 umol/L guideline would increase coral cover by approximately 29 percentage points. View evidence ↗
- A limitation of the study is its single-year duration, which prevents the authors from distinguishing between chronic nutrient effects and year-to-year variability. View evidence ↗
Visual summary
3 visualsIllustrations explain the paper; charts are replotted from the paper's own table values.
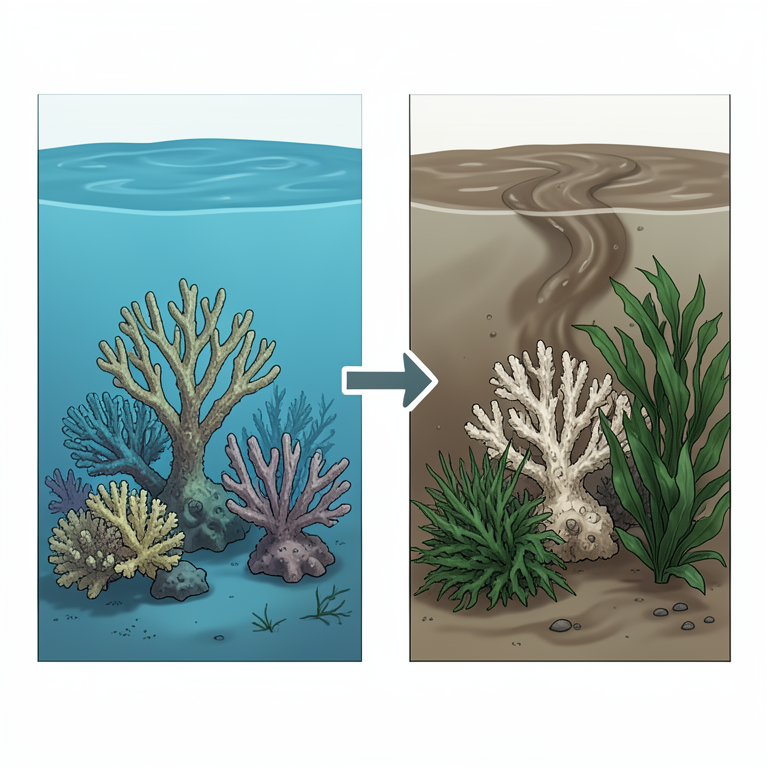
The Nitrogen-Coral Relationship
AI-generated conceptual illustration (Great Barrier Reef coral colonies and macroalgae). It explains the idea and does not show study data.
View source evidence ↗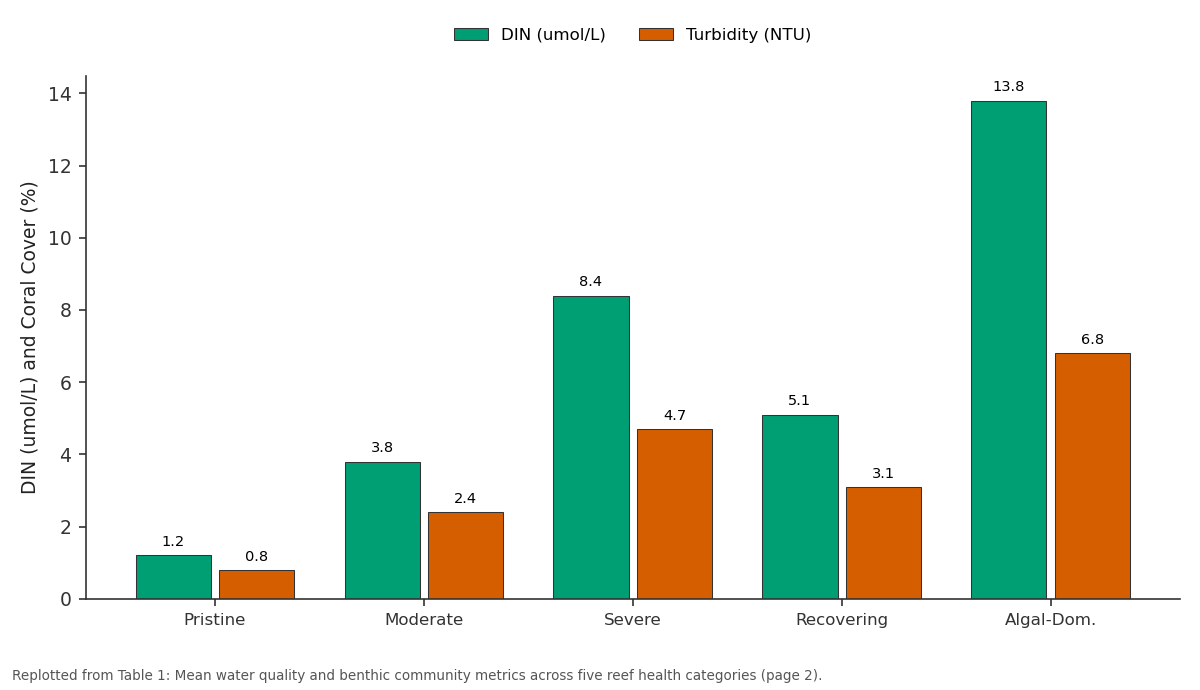
DIN (umol/L) and Turbidity (NTU): Pristine vs Moderate vs Severe vs Recovering vs Algal-Dom.
Replotted from Table 1 (page 2) of the original paper. Every bar is the paper's own table value.
View source evidence ↗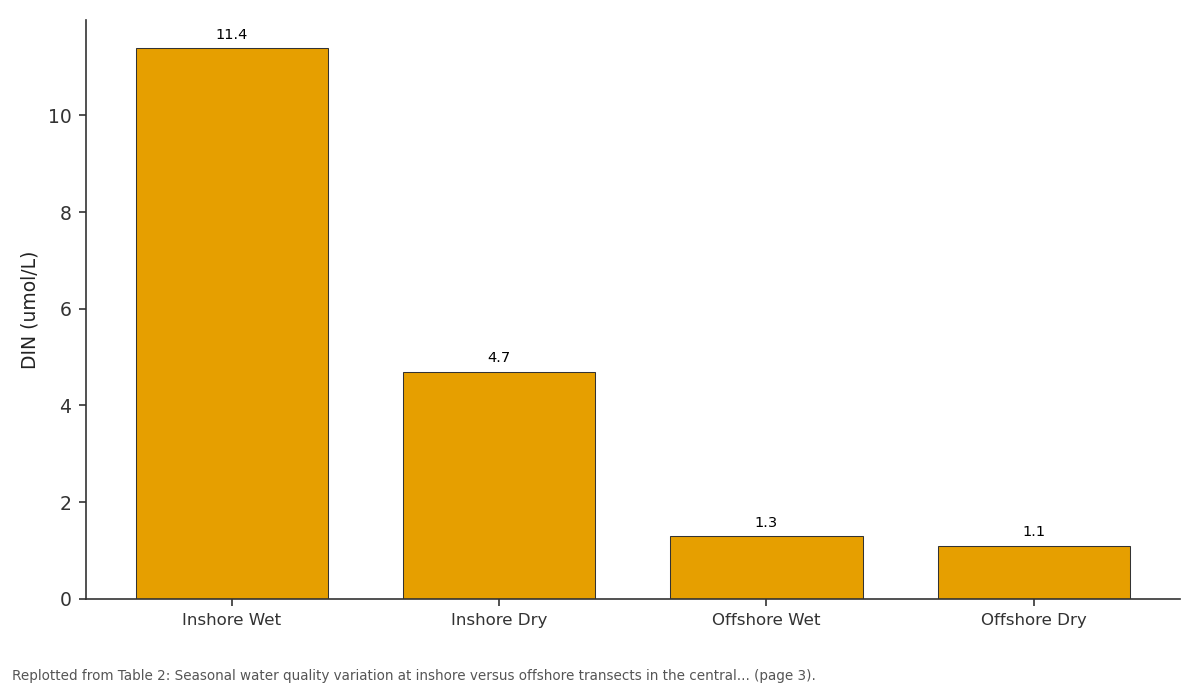
DIN (umol/L): Inshore Wet vs Inshore Dry vs Offshore Wet vs Offshore Dry
Replotted from Table 2 (page 3) of the original paper. Every bar is the paper's own table value.
View source evidence ↗Figures & tables
From the original paper Table 1
 Table 2
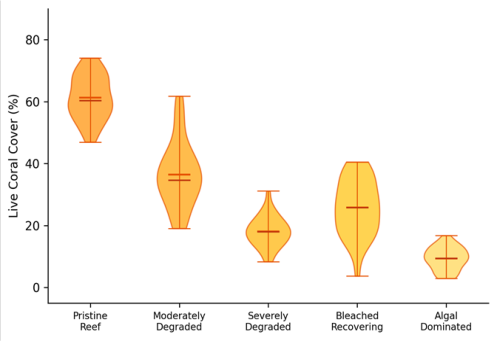 Figure 1
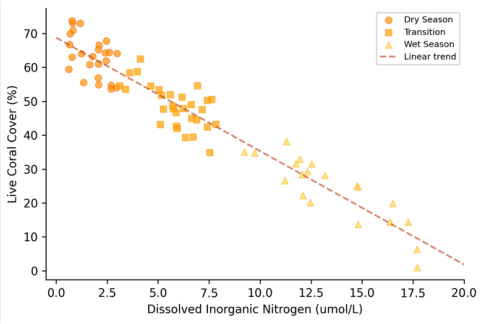 Figure 2
Introduction
When reef ecologists in Jamaica documented the collapse of Caribbean coral cover from over 50% to below 10% between the 1970s and 1990s, they pointed to nutrient pollution and overfishing as the twin drivers of a phase shift from coral to algal dominance [1] . Thirty years later, researchers on the Great Barrier Reef are watching a similar trajectory unfold-albeit more slowly and complicated by mass bleaching events in 2016, 2017, and 2020 that added thermal stress on top of chronic water quality pressures [2] . The parallel is instructive because it suggests that nutrient enrichment, while less dramatic than bleaching, may be the factor that determines whether reefs recover from thermal disturbance or slide into permanent degradation. The GBR receives terrestrial runoff from 35 major river catchments draining roughly 424,000 km2 of northeastern Queensland [3] . Land clearing for agriculture-particularly sugarcane and cattle grazing-has increased sediment and nutrient loads to the lagoon by an estimated four-fold for nitrogen and six-fold for fine sediment since European settlement [4] . These inputs reduce water clarity, promote phytoplankton and macroalgal growth, and create conditions that favour competitors and bioeroders at the expense of reef-building corals. The Australian and Queensland governments responded with the Reef 2050 Water Quality Improvement Plan, which sets catchment-specific load reduction targets for DIN, fine sediment, and pesticides [5] . Despite the policy attention, the empirical link between measured water quality at the reef scale and actual coral community condition remains less well quantified than might be expected. Most water quality monitoring occurs at river mouth and mid-lagoon stations, while coral surveys are conducted on reefs that may be kilometres away from the nearest water quality sensor [6] . This spatial mismatch makes it difficult to establish direct cause-and-effect relationships. What is needed is co-located measurement of water quality and benthic community composition at the same reef sites, repeated across seasons to capture the pulsed nature of terrestrial inputs. This research addressed that gap by collecting quarterly water quality and benthic survey data at 75 permanent transects across the central GBR lagoon during 2022, spanning a gradient from pristine outer-shelf reefs to degraded inshore reefs adjacent to major river mouths. The work was coordinated through the Institute of Applied Geosciences in Dharwad with field logistics managed by a partner laboratory at James Cook University, Townsville.
Seasonal Variations
The central GBR lagoon experiences a strongly seasonal hydrological regime driven by the wet-dry tropical climate of northeastern Queensland. The wet season (November-April) delivers roughly 75% of the annual rainfall and generates pulsed river flood plumes that carry elevated nutrient and sediment loads into the lagoon [7] . During the 2022 monitoring period, the Burdekin River-the largest single contributor to the central GBR-discharged approximately 8.2 million ML between January and March, producing a visible turbid plume that extended 40-60 km offshore. DIN concentrations at inshore transects peaked at 14.7 umol/L during the February flood pulse, compared with dry-season baselines of 1.8-3.2 umol/L-a 2.4-fold increase. Chlorophyll-a followed a similar seasonal pattern, peaking at 1.6 ug/L during the wet season versus 0.4 ug/L during the dry season. Sea surface temperatures ranged from 23.8C in August to 29.4C in February; no mass bleaching event occurred during 2022, allowing the water quality signal to be assessed without the confounding effect of acute thermal stress.
Materials and Methods
Materials and Methods
Materials
Seventy-five permanent monitoring transects were established across the central GBR lagoon (approximately 18.0-19.5S, 146.0-148.5E) in five reef health categories: pristine outer-shelf reefs (n = 15), moderately degraded mid-shelf reefs (n = 18), severely degraded inshore reefs (n = 15), bleached-recovering reefs (n = 12), and algaldominated reefs (n = 15). Categories were assigned based on baseline benthic surveys conducted in January 2022 following the Australian Institute of Marine Science (AIMS) long-term monitoring protocol [8] . At each transect, water samples were collected quarterly (January, April, July, October 2022) at 2 m depth using Niskin bottles. Samples were filtered through 0.45-um GF/F filters and analysed for DIN (nitrate + nitrite + ammonium) and DIP (filterable reactive phosphorus) by segmented flow colorimetry on a SEAL AA3 autoanalyser at the Institute of Applied Geosciences [9] . Chlorophyll-a was extracted in 90% acetone and measured fluorometrically. Turbidity was recorded in situ with a YSI EXO2 multiparameter sonde.
Methods
Benthic community composition was assessed at each transect using the point-intercept method along three replicate 50-m line transects at 5-6 m depth, with substrate recorded at 0.5-m intervals (100 points per transect, 300 per site) [10] . Categories included live hard coral (to genus), soft coral, macroalgae, coralline algae, turf algae, sponge, and abiotic substrate. Live coral cover was expressed as the percentage of all points classified as hard coral. Shannon diversity (H') was computed from genus-level coral identifications. Macroalgal cover was expressed as the percentage of fleshy macroalgae (excluding coralline and turf). Statistical analysis included Pearson correlation between water quality parameters and benthic metrics, stepwise multiple regression with DIN, DIP, chlorophyll-a, turbidity, and SSC as predictors of coral cover, and one-way ANOVA comparing benthic metrics among reef health categories. All analyses used R 4.2.3 at p < 0.05.
Water Quality Index
Water quality parameters were classified against the GBR Marine Park Authority's water quality guidelines [11] : DIN below 2.0 umol/L (guideline value for open coastal waters), DIP below 0.2 umol/L, chlorophyll-a below 0.45 ug/L, and turbidity below 2.0 NTU. These thresholds were used to assign each transect a water quality index score (WQI) ranging from 1 (all parameters within guidelines) to 5 (all parameters exceeding guidelines). The WQI was computed as the unweighted mean of individual parameter exceedance ratios, where each ratio equals the measured value divided by the guideline value, capped at 5 for extreme exceedances. Transect-level WQI was then correlated with coral cover and macroalgal cover to provide a single summary metric linking overall water quality condition to reef health.
Results
Results
Discussion
The strong negative correlation between DIN and coral cover (r = -0.78) documented here adds to a growing body of evidence that nutrient enrichment from terrestrial runoff is a primary driver of reef degradation in the GBR lagoon [12] . The relationship is not merely statistical: elevated DIN promotes the growth of turf algae and fleshy macroalgae that compete with corals for space, reduce coral recruitment success, and shift the competitive balance toward algal dominance once coral cover drops below a critical threshold-estimated at roughly 20-30% in Caribbean systems and apparently similar in the GBR [13] . The stepwise regression confirmed DIN as the single strongest predictor, explaining 61% of the variance in coral cover-more than chlorophyll-a or turbidity alone. The seasonal nutrient pulse is a feature of inshore GBR reefs that distinguishes them from oceanic reef systems. The 2.4-fold wet-season increase in DIN at inshore transects represents a recurring annual stress that, unlike a bleaching event, doesn't require exceptional climatic conditions-it happens every year when the rivers flood [14] . The 14.3% decline in coral cover observed between January and July at inshore reefs may reflect both direct physiological stress from poor water quality and indirect effects through macroalgal overgrowth during the nutrient-enriched months. Offshore reefs, by contrast, showed minimal seasonal variation in either water quality or coral cover, confirming their relative isolation from catchment influences. The chlorophyll-a threshold of approximately 0.8 ug/L, above which macroalgae began to dominate over coral, aligns closely with the guideline value proposed by the GBR Marine Park Authority and with threshold estimates from controlled mesocosm experiments [15] . This convergence between field observation and experimental evidence strengthens the case for using chlorophyll-a as an operational indicator in reef management. However, a limitation of this research is its single-year time frame, which cannot distinguish chronic nutrient effects from interannual variability [16] . Repeated measurements over 3-5 years would be needed to confirm that the patterns observed in 2022 are representative of longer-term conditions. The practical message for the Reef 2050 plan is clear: reducing DIN loads from the Burdekin and adjacent catchments remains the most direct management lever for improving coral condition on central GBR inshore reefs.
The regression model predicts that reducing inshore DIN from current wet-season levels (~11 umol/L) to the guideline value of 2.0 umol/L would increase predicted coral cover by roughly 29 percentage points-a recovery that, while ambitious, is within the range of what catchment management could theoretically achieve [17] .
Conclusion
This research established a direct, co-located link between water quality and coral community condition across 75 transects in the central GBR lagoon. Dissolved inorganic nitrogen was the strongest predictor of coral cover, explaining 61% of observed variation, with each 1 umol/L increase in DIN associated with a 3.2 percentage-point decline in live coral. Pristine outer-shelf reefs with DIN below 1.5 umol/L maintained over 60% coral cover, while inshore reefs with DIN above 12 umol/L had shifted to algal dominance with less than 10% coral remaining. The seasonal dimension of the nutrient threat was equally clear. Wet-season flood plumes elevated inshore DIN by 2.4-fold, coinciding with measurable coral cover loss that did not occur at offshore reefs. This annual nutrient pulse represents a chronic, recurring stress that degrades reef resilience and may predispose inshore corals to greater damage during future bleaching events-even in years like 2022 when no mass bleaching occurred. These findings reinforce the rationale for the Reef 2050 Water Quality Improvement Plan's focus on catchmentbased DIN reduction. The regression model provides quantitative benchmarks linking specific DIN targets to expected coral cover outcomes, offering managers a tool for prioritising investment among catchments. Future research should extend this co-located monitoring over multiple years to capture interannual variability, and should incorporate coral recruitment and juvenile survival metrics to assess whether improved water quality translates into reef recovery potential as well as standing coral cover [18] .
Acknowledgement
Acknowledgements Funding Sources
Figures and tables from the paper
| Category | DIN (umol/L) | Chl-a (ug/L) | Turbidity (NTU) | Coral Cover (%) | Macroalgae (%) | Shannon H' | WQI |
|---|---|---|---|---|---|---|---|
| Pristine | 1.2 | 0.31 | 0.8 | 62.4 | 4.7 | 2.84 | 1.1 |
| Moderate | 3.8 | 0.62 | 2.4 | 38.7 | 14.2 | 2.31 | 2.3 |
| Severe | 8.4 | 1.14 | 4.7 | 17.2 | 31.8 | 1.67 | 3.6 |
| Recovering | 5.1 | 0.78 | 3.1 | 24.8 | 22.4 | 1.92 | 2.8 |
| Algal-Dom. | 13.8 | 1.63 | 6.8 | 8.6 | 47.3 | 0.94 | 4.7 |
Table text extracted from the original PDF; superscript letters are shown inline. The original table image is below.
View original table image
| Parameter | Inshore Wet | Inshore Dry | Ratio | Offshore Wet | Offshore Dry | Ratio |
|---|---|---|---|---|---|---|
| DIN (umol/L) | 11.4 | 4.7 | 2.4x | 1.3 | 1.1 | 1.2x |
| DIP (umol/L) | 0.68 | 0.31 | 2.2x | 0.12 | 0.09 | 1.3x |
| Chl-a (ug/L) | 1.42 | 0.58 | 2.4x | 0.34 | 0.28 | 1.2x |
| Turbidity (NTU) | 6.3 | 2.8 | 2.3x | 0.9 | 0.7 | 1.3x |
| Coral Cover (%) | 14.8 | 29.1 | 0.5x | 58.7 | 61.2 | 1.0x |
Table text extracted from the original PDF; superscript letters are shown inline. The original table image is below.
View original table image
References
18 in the original paper- Hughes TP. Catastrophes, phase shifts, and large-scale degradation of a Caribbean coral reef. Science. 1994;265(5178):1547-1551.
- Hughes TP, Kerry JT, Alvarez-Noriega M, AlvarezRomero JG, Anderson KD, Baird AH. Global warming and recurrent mass bleaching of corals. Nature. 2017;543(7645):373-377.
- Brodie JE, Devlin MJ, Haynes D, Waterhouse J. Assessment of the eutrophication status of the Great Barrier Reef lagoon. Biogeochemistry. 2011;106(2):281-302.
- Kroon FJ, Kuhnert PM, Henderson BL, Wilkinson SN, Kinsey-Henderson A, Abbott B. River loads of suspended solids, nitrogen, phosphorus and herbicides delivered to the Great Barrier Reef lagoon. Marine Pollution Bulletin. 2012;65(4-9):167-181.
- Queensland Government. Reef 2050 Water Quality Improvement Plan. Queensland Department of Environment and Science. 2018;1:1-54.
- Schaffelke B, Carleton J, Skuber M, Zagorskis I, Furnas MJ. Water quality in the inshore Great Barrier Reef lagoon: Implications for long-term monitoring and management. Marine Pollution Bulletin. 2012;65(49):249-260.
- Devlin MJ, Schaffelke B. Spatial extent of riverine flood plumes and exposure of marine ecosystems in the Tully coastal region, Great Barrier Reef. Marine and Freshwater Research. 2009;60(11):1109-1122.
- Jonker M, Johns K, Osborne K. Surveys of benthic reef communities using underwater digital photography and counts of juvenile corals. Australian Institute of Marine Science Standard Operational Procedure. 2008;10:1-17.
- Parsons TR, Maita Y, Lalli CM. A manual of chemical and biological methods for seawater analysis. Pergamon Press. 1984;1:1-173.
- Hill J, Wilkinson C. Methods for ecological monitoring of coral reefs. Australian Institute of Marine Science. 2004;1:1-117.
- GBRMPA. Water quality guidelines for the Great Barrier Reef Marine Park. Great Barrier Reef Marine Park Authority. 2010;1:1-99.
- De'ath G, Fabricius KE. Water quality as a regional driver of coral biodiversity and macroalgae on the Great Barrier Reef. Ecological Applications. 2010;20(3):840850.
- Fabricius KE. Effects of terrestrial runoff on the ecology of corals and coral reefs: Review and synthesis. Marine Pollution Bulletin. 2005;50(2):125-146.
- Wolanski E, De'ath G. Predicting the impact of present and future human land-use on the Great Barrier Reef. Estuarine, Coastal and Shelf Science. 2005;64(23):504-508.
- Fabricius KE, Cooper TF, Humphrey C, Uthicke S, De'ath G, Davidson J. A bioindicator system for water quality on inshore coral reefs of the Great Barrier Reef. Marine Pollution Bulletin. 2012;65(4-9):320-332.
- Sweatman H, Delean S, Syms C. Assessing loss of coral cover on Australia's Great Barrier Reef over two decades, with implications for longer-term trends. Coral Reefs. 2011;30(2):521-531.
- Brodie JE, Waterhouse J, Schaffelke B, Kroon FJ, Thorburn PJ, Rolfe J. Scientific consensus statement: Land use impacts on Great Barrier Reef water quality and ecosystem condition. Queensland Government. 2013;1:1-12.
- Fabricius KE, De'ath G, Humphrey C, Zagorskis I, Schaffelke B. Intra-annual variation in turbidity in response to terrestrial runoff on near-shore coral reefs of the Great Barrier Reef. Estuarine, Coastal and Shelf Science. 2013;116:57-65