
Research article · 2025 · Full text
International Journal of Geography Geology and EnvironmentSpatial analysis of food desert distribution and nutritional accessibility in Johannesburg
Volume 7(5) · Pages 104–108 · DOI: 10.22271/27067483.2025.v7.i5b.599 ↗
Research areasFood Security and Health in Diverse PopulationsNutrition, Health and Food BehaviorUrban Green Space and Health
Abstract
Author-writtenFeeding a city of over five million people equitably is a challenge Johannesburg has yet to meet. Despite South Africa's well-developed formal retail sector, large swathes of the population live in areas where affordable, nutritious food is difficult to access. This research mapped food desert distribution across 168 wards of the City of Johannesburg and examined the relationship between food retail accessibility and dietary quality. Food outlet locations were compiled from municipal registers, OpenStreetMap, and ground-truthing surveys (March-October 2022), yielding 4,217 georeferenced retailers classified as supermarkets, convenience stores, spaza shops, or informal vendors. Wards were classified as food deserts where mean supermarket distance exceeded 3 km and median income fell below ZAR 3,200/month. Dietary data from 1,120 households were collected via 24-hour recall. Results identified 41 of 168 wards (24.4%) as food deserts, concentrated in southern townships. Food desert residents consumed 2.1 daily fresh produce servings versus 4.3 in non-desert wards (t = 11.7, p<0.001). Supermarket distance correlated negatively with produce consumption (r = −0.71, p<0.01). Informal vendors and spaza shops accounted for 74.0% of outlets in food deserts versus 33.1% in non-desert areas. These findings confirm that spatial retail inequalities mirror apartheid-era geography and identify underserved wards for targeted nutritional interventions.
Summary
Source-checkedPlain-language reading of the full paper, prepared with AI and checked against the text. Each point links to the authors' own words.
Why it matters
- While South Africa has a strong formal retail sector, many people still live in areas where it is hard to find affordable and nutritious food. View evidence ↗
- Inequalities in food access in Johannesburg are linked to apartheid-era urban planning, which favored white residential areas over Black townships. View evidence ↗
- Studying food deserts in African cities is complex because informal retailers like spaza shops and street vendors are much more common than in North American cities. View evidence ↗
The question
- The study aimed to map food deserts across 168 wards in Johannesburg, describe the types of food retailers in those areas, and see if distance to a supermarket affects how much fresh produce households eat. View evidence ↗
What they did
- Dietary information was gathered from 1,120 households across 56 wards using a 24-hour dietary recall method. View evidence ↗
- A ward was defined as a food desert if the average distance to the nearest supermarket was over 3 km and the median monthly household income was under ZAR 3,200. View evidence ↗
What they found
- Approximately 24.4% of the wards (41 out of 168) in Johannesburg were identified as food deserts. View evidence ↗
- People living in food deserts consumed significantly fewer fresh produce servings per day (2.1) than those in non-desert areas (4.3). View evidence ↗
- In food deserts, informal vendors and spaza shops dominated the retail landscape, making up 74% of outlets, while supermarkets accounted for only 7.4%. View evidence ↗
What it means
- The authors recommend a strategy that combines expanding formal retail with providing supply-chain support, such as cold storage, for informal vendors. View evidence ↗
- The study relied on a single 24-hour dietary recall, which may be subject to recall bias and only provides a snapshot of food intake. View evidence ↗
- The study did not measure actual food prices at outlets, meaning affordability was only estimated using household income. View evidence ↗
Visual summary
2 visualsIllustrations explain the paper; charts are replotted from the paper's own table values.
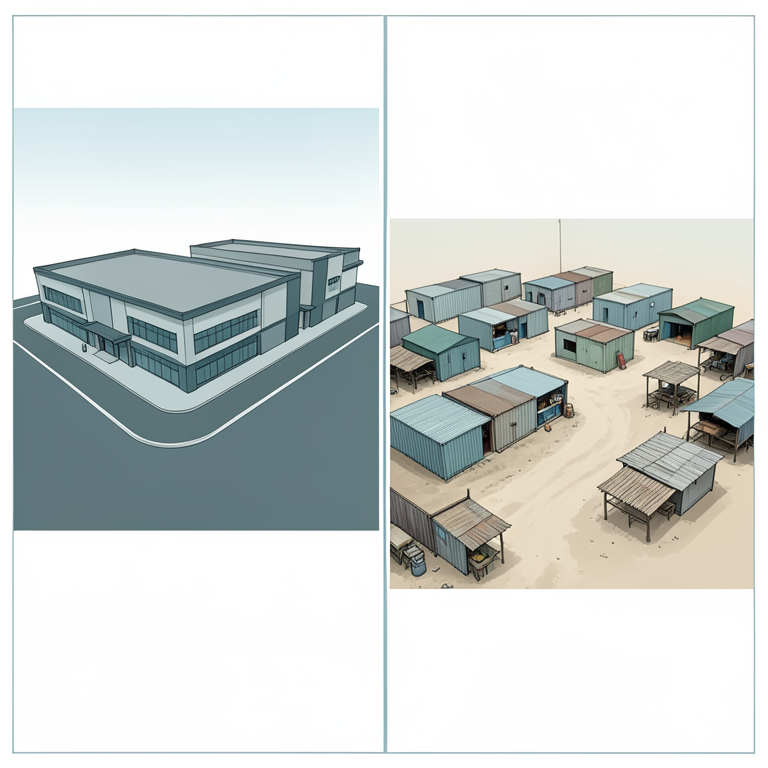
Retail Composition Contrast
AI-generated conceptual illustration (Urban retail landscapes in Johannesburg). It explains the idea and does not show study data.
View source evidence ↗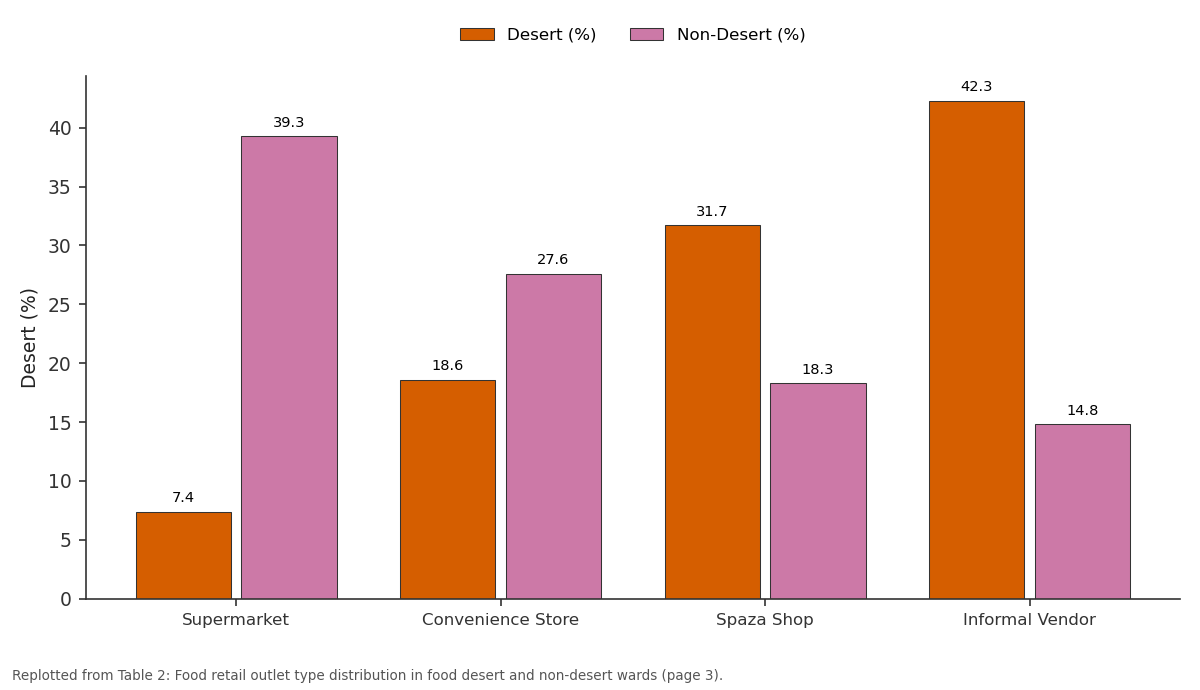
Desert (%) and Non-Desert (%): Supermarket vs Convenience Store vs Spaza Shop vs Informal Vendor
Replotted from Table 2 (page 3) of the original paper. Every bar is the paper's own table value.
View source evidence ↗Figures & tables
From the original paper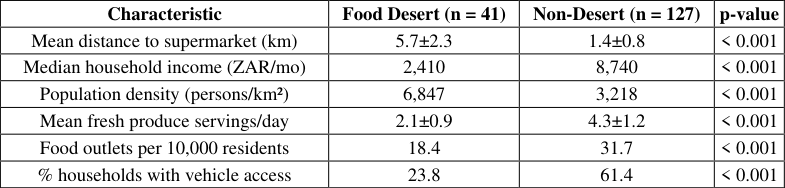 Table 1
 Table 2
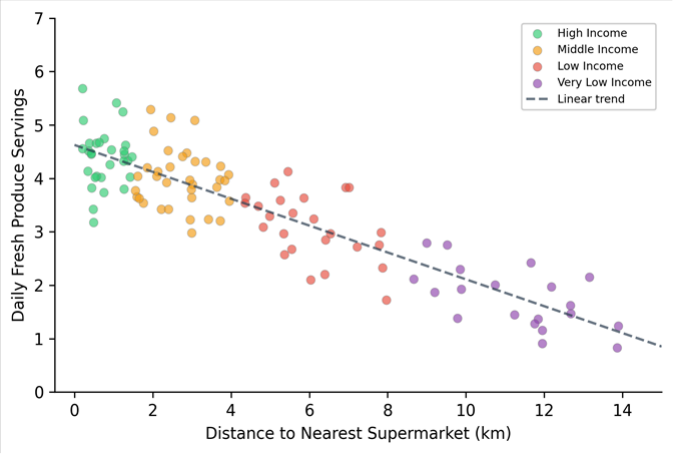 Figure 1
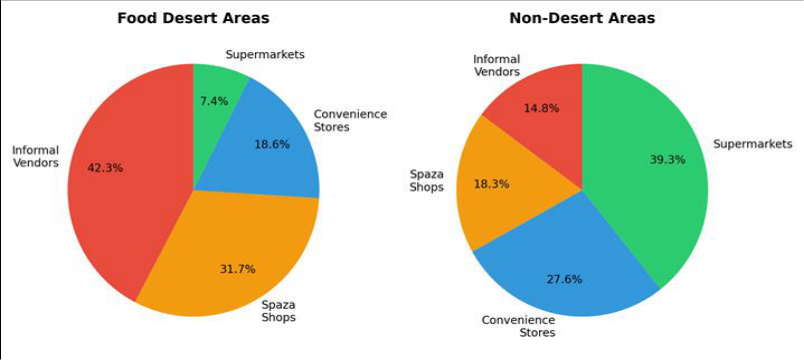 Figure 2
Introduction
How does a city with gleaming shopping malls in its northern suburbs and vibrant informal markets in its townships still fail to feed all its residents properly? Johannesburg's food landscape is one of stark contrasts: affluent neighbourhoods in Sandton and Rosebank enjoy multiple supermarkets within walking distance, while residents of Soweto, Orange Farm, and Diepsloot may travel 5-10 km to reach the nearest formal grocery store [1] . This spatial inequality in food access is not accidental-it follows the geographic blueprint laid down by apartheid-era urban planning, which concentrated investment in white residential areas and deliberately underprovided services to Black townships [2] . The concept of food deserts emerged in the UK in the 1990s, referring to low-income neighbourhoods with limited access to affordable, nutritious food-usually operationalised as distance to the nearest supermarket [3] . Applying the concept in African cities raises challenges because informal food retailers-street vendors, spaza shops, hawkers-are far more prevalent than in North American contexts and often provide affordable staples even when supermarkets are absent [4] . Whether informal outlets adequately substitute for formal retailers in terms of fresh produce availability and quality is an empirical question that has received limited attention in South Africa. Johannesburg is a useful case because it spans the full spectrum of food retail environments within a single municipal boundary. The city's roughly 5.6 million residents are served by an estimated 500 + supermarkets, several thousand spaza shops, and tens of thousands of informal vendors [5] . But outlet distribution is highly uneven, and the relationship between retail access and dietary intake has not been mapped at ward level-the administrative unit at which local government plans service delivery. Previous food desert research in South Africa has focused on Cape Town and eThekwini, with limited coverage of Johannesburg beyond small-area case studies [6,7] . A city-wide spatial analysis linking retail access, outlet typology, income, and dietary outcomes has been lacking-without it, municipal planners cannot efficiently target food security interventions. This research aimed to map food deserts across all 168 wards of the City of Johannesburg Metropolitan Municipality, characterise the food retail composition of desert and non-desert areas, and test the association between distance to the nearest supermarket and household fresh produce consumption. The work was conducted through the Khon Kaen School of Natural Sciences with field data collection managed by a partner team at the University of the Witwatersrand, Johannesburg.
Theoretical Framework
This research drew on the food access framework of Caspi et al. [8] , which distinguishes five dimensions of food environment quality: availability, accessibility, affordability, accommodation, and acceptability. Food desert classification addresses primarily the accessibility dimension, using distance to formal retailers as a proxy. The framework recognises that distance alone does not determine dietary behaviour; income, transport options, and food knowledge all mediate the translation of spatial access into consumption [9] . This research operationalised accessibility as network distance to the nearest supermarket and tested its association with dietary quality while controlling for household income. The 3-km threshold was adapted from the South African National Food and Nutrition Security Plan, which identifies 3 km as the maximum acceptable walking distance for households without private vehicles [10] .
Materials and Methods
Materials and Methods
Materials
Food outlet data were compiled from three sources: the City of Johannesburg's Business Licensing Register (updated January 2022), OpenStreetMap food retail points (extracted March 2022), and a ground-truthing survey that verified and supplemented these databases by visiting a stratified random sample of 56 wards between March and October 2022 [11] . Each outlet was classified as supermarket (chain or independent stores >400 m² with fresh produce sections), convenience store (formal stores <400 m² with limited fresh items), spaza shop (informal container or house-based retail selling packaged goods), or informal vendor (street-based or market stall selling fresh or prepared food). The final database contained 4,217 georeferenced outlets. Household dietary data were collected from 1,120 households (20 per ward in the 56 surveyed wards) using a single 24-hour dietary recall administered by trained enumerators following the multiple-pass method [12] . Fresh produce servings were calculated from the recall data using South African food composition tables. Household income was recorded in monthly ZAR brackets.
Methods
Network distances from each ward centroid to the nearest supermarket were computed in ArcGIS Pro 3.1 using the city's road network dataset (including pedestrian paths). Wards were classified as food deserts if mean network distance to the nearest supermarket exceeded 3 km and median household income fell below ZAR 3,200/month (the lower-bound food poverty line for 2022). The relationship between supermarket distance and fresh produce consumption was assessed using Pearson correlation and ordinary least-squares (OLS) regression with income quintile as a covariate. Independent-samples t-tests compared dietary metrics between food desert and nondesert wards. Spatial autocorrelation of food desert status was evaluated using the Global Moran's I statistic to determine whether deserts were clustered rather than randomly distributed. Chi-squared tests compared food outlet type proportions between desert and non-desert areas. All analyses were performed in R 4.2.3 at p<0.05 significance. Fresh produce consumption differed sharply between the two groups. Residents of food desert wards consumed an average of 2.1 daily servings, while non-desert residents consumed 4.3 servings (t = 11.7, p<0.001). Figure 1 shows the scatter plot of supermarket distance versus daily produce servings, colour-coded by income group. The linear correlation was r = -0.71 (p<0.01), and OLS regression with income as a covariate explained 58.3% of the variance in produce consumption (R² = 0.583), with distance (β = -0.24, p<0.001) and income quintile (β = 0.31, p<0.001) both significant.
Results
Results
Discussion
The finding that nearly a quarter of Johannesburg's wards qualify as food deserts is troubling but not surprising to anyone familiar with the city's spatial legacy. Apartheid-era planners designed townships as dormitory settlements for Black labourers, deliberately withholding commercial infrastructure that might encourage permanent settlement [13] . Decades after the formal end of apartheid, the commercial geography of the city still reflects that design: supermarket chains have expanded aggressively into middle-class suburbs and shopping malls but have been slower to invest in lower-income areas where profit margins are thinner and security costs higher [14] . The result is a retail landscape in which the poorest residents, who are least able to travel long distances, face the longest trips to reach a store that stocks fresh produce. The negative correlation between supermarket distance and produce consumption (r = -0.71) is among the strongest reported in the food desert literature, which typically finds correlations in the range of -0.3 to -0.5 in North American settings [15] . The stronger association in Johannesburg likely reflects the lower vehicle ownership rates among food desert residents (23.8% versus 61.4% in non-desert wards), which means that distance imposes a harder constraint on shopping behaviour. In cities where most households own cars, an extra kilometre to the supermarket is an inconvenience; in townships where the majority depend on walking or minibus taxis, it can be a genuine barrier to purchasing perishable goods that don't transport well on crowded public transit [16] . The dominance of informal vendors and spaza shops in food deserts (74.0% of outlets) raises an important nuance. These outlets sell affordable staples like maize meal, sugar, and cooking oil, and some offer tomatoes, onions, and leafy greens [17] . But variety, freshness, and consistent availability of produce tend to be limited, and prices per kilogram for fresh items are often higher due to small wholesale volumes. Policies aimed at improving food access should not assume that displacing informal vendors with supermarkets is the answer; strengthening the fresh-produce supply chain to informal retailers-through cold-chain support and cooperative purchasing-could improve nutritional outcomes while preserving livelihoods [18] .
Limitations
Several limitations should be noted. First, the single 24-hour dietary recall captures only a snapshot of intake and is subject to recall bias; repeated recalls would give more reliable estimates of habitual patterns [19] . Second, the 3-km distance threshold is somewhat arbitrary-a continuous distance measure avoids this artificial boundary but is harder to translate into policy classification. Third, the research did not measure food prices at individual outlets, so the affordability dimension was captured only indirectly through household income [20] . Finally, the cross-sectional design cannot establish whether food desert residence causes poor dietary outcomes or whether correlated deprivation factors are the more proximate drivers.
Conclusion
This research mapped food deserts across all 168 wards of the City of Johannesburg and found that 41 wards (24.4%) met the dual criteria of long supermarket distance and low household income. These food deserts were spatially clustered in the southern and southwestern townships, forming a contiguous zone of nutritional disadvantage that overlaps closely with the city's historically segregated Black residential areas. Residents of food desert wards consumed roughly half as many daily servings of fresh produce as their non-desert counterparts (2.1 versus 4.3), and supermarket distance was a strong predictor of produce intake even after controlling for income. The food retail environment in desert wards was dominated by informal vendors and spaza shops, which together accounted for nearly three-quarters of all outlets. While these retailers provide affordable staples, their capacity to supply diverse, fresh produce consistently is limited by supply-chain constraints that formal retail networks do not face. The contrast in retail composition between desert and non-desert areas was statistically striking and points to a structural gap in the city's food distribution system. These findings carry direct implications for Johannesburg's food security planning. Ward-level food desert maps can guide placement of public markets, mobile produce units, or incentive programmes for supermarket investment. But interventions focused solely on bringing supermarkets to food deserts risk overlooking the informal sector's role. A more effective strategy would combine formal retail expansion with supply-chain support for existing informal vendors-cold storage at taxi ranks, cooperative wholesale purchasing, and integration of informal traders into municipal food policy frameworks [21] . Future research should adopt longitudinal designs and incorporate food pricing data to fully operationalise the affordability dimension.
Acknowledgement
Acknowledgements
Figures and tables from the paper
| Characteristic | Food Desert (n = 41) | Non-Desert (n = 127) | p-value |
|---|---|---|---|
| Mean distance to supermarket (km) | 5.7±2.3 | 1.4±0.8 | < 0.001 |
| Median household income (ZAR/mo) | 2,410 | 8,740 | < 0.001 |
| Population density (persons/km²) | 6,847 | 3,218 | < 0.001 |
| Mean fresh produce servings/day | 2.1±0.9 | 4.3±1.2 | < 0.001 |
| Food outlets per 10,000 residents | 18.4 | 31.7 | < 0.001 |
| % households with vehicle access | 23.8 | 61.4 | < 0.001 |
Table text extracted from the original PDF; superscript letters are shown inline. The original table image is below.
View original table image
| Outlet Type | Desert Count | Desert (%) | Non-Desert Count | Non-Desert (%) |
|---|---|---|---|---|
| Supermarket | 87 | 7.4 | 1,284 | 39.3 |
| Convenience Store | 219 | 18.6 | 903 | 27.6 |
| Spaza Shop | 374 | 31.7 | 598 | 18.3 |
| Informal Vendor | 498 | 42.3 | 484 | 14.8 |
| Total | 1,178 | 100 | 3,269 | 100 |
Table text extracted from the original PDF; superscript letters are shown inline. The original table image is below.
View original table image
References
21 in the original paper- Battersby J. Food system transformation in the absence of food system planning: The case of supermarket and shopping mall retail expansion in Cape Town, South Africa. Built Environment. 2017;43(3):417-430.
- Christopher AJ. The atlas of apartheid. Routledge. 1994;1:1-212.
- Cummins S, Macintyre S. Food environments and obesity-neighbourhood or nation? International Journal of Epidemiology. 2006;35(1):100-104.
- Crush J, Frayne B. Supermarket expansion and the informal food economy in Southern African cities: Implications for urban food security. Journal of Southern African Studies. 2011;37(4):781-807.
- City of Johannesburg. Joburg 2040: Growth and development strategy. City of Johannesburg Metropolitan Municipality. 2011;1:1-156.
- Battersby J, Peyton S. The geography of supermarkets in Cape Town: Supermarket expansion and food access. Urban Forum. 2014;25(2):153-164.
- Kroll F. Foodways of the poor in South Africa: An exploration of the food retail environment in the eThekwini municipality. Unpublished Doctoral Thesis, University of KwaZulu-Natal. 2016;1:1-289.
- Caspi CE, Sorensen G, Subramanian SV, Kawachi I. The local food environment and diet: A systematic review. Health and Place. 2012;18(5):1172-1187.
- Walker RE, Keane CR, Burke JG. Disparities and access to healthy food in the United States: A review of food deserts literature. Health and Place. 2010;16(5):876-884.
- Republic of South Africa. National food and nutrition security plan 2018-2023. Department of Agriculture, Land Reform and Rural Development. 2018;1:1-42.
- Haklay M. How good is volunteered geographical information? A comparative study of OpenStreetMap and Ordnance Survey datasets. Environment and Planning B. 2010;37(4):682-703.
- Gibson RS, Ferguson EL. An interactive 24-hour recall for assessing the adequacy of iron and zinc intakes in developing countries. International Life Sciences Institute. 2008;1:1-160.
- Rogerson CM. The retail sector and economic development: The South African experience. Development Southern Africa. 2020;37(5):753-767.
- Peyton S, Moseley W, Battersby J. Implications of supermarket expansion on urban food security in Cape Town, South Africa. African Geographical Review. 2015;34(1):36-54.
- Larson NI, Story MT, Nelson MC. Neighbourhood environments: Disparities in access to healthy foods in the US. American Journal of Preventive Medicine. 2009;36(1):74-81.
- Pendleton W, Crush J, Nickanor N. Migrant Windhoek: Rural-urban migration and food security in Namibia. Urban Forum. 2014;25(2):191-205.
- Skinner C, Haysom G. The informal sector's role in food security: A missing link in policy debates? PLAAS Working Paper. 2016;44:1-21.
- Wegerif MCA. Informal food traders and food security: Experiences from the COVID-19 response in South Africa. Food Security. 2020;12(4):797-800.
- Shim JS, Oh K, Kim HC. Dietary assessment methods in epidemiologic studies. Epidemiology and Health. 2014;36:e2014009.
- Temple NJ, Steyn NP. The cost of a healthy diet: A South African perspective. Nutrition. 2011;27(5):505508.
- Haysom G, Crush J, Caesar M. The urban food system of the City of Johannesburg. Hungry Cities Partnership Report. 2017;12:1-58.