
Research article · 2025 · Full text
International Journal of Geography Geology and EnvironmentLivelihood vulnerability assessment of fishing communities along the Malabar Coast
Volume 7(2) · Pages 120–122 · DOI: 10.22271/27067483.2025.v7.i2b.579 ↗
Research areasMarine and Coastal EcosystemsCoastal Management and DevelopmentCoastal and Marine Management
Abstract
Author-writtenImagine a fisherman in Kozhikode whose daily catch has fallen by 40% over the past decade while fuel costs have doubled. He cannot switch to another livelihood because fishing is the only skill his family has practised for generations, and he lacks the savings or education to retrain. This scenario, repeated across thousands of households along India’s Malabar Coast, captures the essence of livelihood vulnerability in small-scale fishing communities. This research assessed vulnerability across six coastal districts of Kerala using the Livelihood Vulnerability Index (LVI) framework, combining household survey data from 720 fishing families with secondary data on climate exposure, socioeconomic conditions, and adaptive capacity. Composite vulnerability scores ranged from 2.1 in Ernakulam (lowest) to 4.1 in Kasaragod (highest) on a 1–5 scale. Income diversity and access to credit emerged as the weakest dimensions, with 67.3% of households relying on fishing as their sole income source and 71.8% lacking access to formal credit. Communities with higher out-migration rates showed lower vulnerability scores, suggesting that remittance income serves as a buffer. Catch per unit effort declined by 28.4% across the six districts between 2010 and 2022, while fishing days lost to rough seas increased by 34%. These findings indicate that the Malabar Coast’s fishing communities face compounding pressures from declining marine resources, climate variability, and limited livelihood alternatives.
Summary
Source-checkedPlain-language reading of the full paper, prepared with AI and checked against the text. Each point links to the authors' own words.
Why it matters
- Small-scale fisheries in India employ approximately 14 million people, but the sector is increasingly vulnerable to economic and environmental shocks due to shifting climate patterns and declining marine resources. View evidence ↗
- Livelihood vulnerability is defined by three key components: the capacity to adapt, the sensitivity of the system to shocks, and the exposure to those shocks. View evidence ↗
- The Malabar Coast has one of Asia's densest concentrations of small-scale fishers, yet it lacked a multi-dimensional assessment of livelihood vulnerability. View evidence ↗
The question
- The study aimed to assess livelihood vulnerability across six coastal districts of Kerala using the Livelihood Vulnerability Index (LVI) framework. View evidence ↗
What they did
- Researchers conducted structured surveys with 720 fishing families, with 120 participants from each of the six target districts: Ernakulam, Thrissur, Malappuram, Kasaragod, Kannur, and Kozhikode. View evidence ↗
- The study utilized secondary data from 2010–2022, including CMFRI fish landing statistics, India Meteorological Department monsoon dates, and Kerala’s Economic Review socioeconomic indicators. View evidence ↗
- The Livelihood Vulnerability Index (LVI) was calculated based on seven dimensions: climate exposure, health status, natural resource dependence, access to credit, social networks, asset ownership, and income diversity. View evidence ↗
- Catch per unit effort (CPUE) was measured as kilograms per fishing trip using CMFRI landing data. View evidence ↗
What they found
- On a scale of 1 to 5, composite vulnerability scores varied by district, with Ernakulam having the lowest score (2.1) and Kasaragod the highest (4.1). View evidence ↗
- The weakest dimensions of vulnerability were credit access and income diversity, as 71.8% of households lacked formal credit and 67.3% relied exclusively on fishing for income. View evidence ↗
- Between 2010 and 2022, the six districts saw a 28.4% decline in catch per unit effort and a 34% increase in fishing days lost due to rough seas. View evidence ↗
- Higher out-migration rates in Thrissur and Ernakulam correlated with the lowest vulnerability scores, indicating that remittance income helps buffer households against catch variability. View evidence ↗
- Kasaragod's high vulnerability score of 3.9 is attributed to limited access to urban jobs and geographic isolation, which hinder livelihood diversification and out-migration. View evidence ↗
What it means
- The authors conclude that reducing vulnerability requires a combination of livelihood diversification to lower single-income dependence and resource management to slow the decline in catches. View evidence ↗
- The authors recommend three priorities: strengthening community-based fisheries management, providing vocational training in marine-adjacent sectors for diversification, and expanding formal credit via cooperative banking. View evidence ↗
- The authors note that relying on migration as an adaptation strategy is risky because employment in Gulf States is subject to external policy changes and economic cycles. View evidence ↗
Visual summary
2 visualsIllustrations explain the paper; charts are replotted from the paper's own table values.
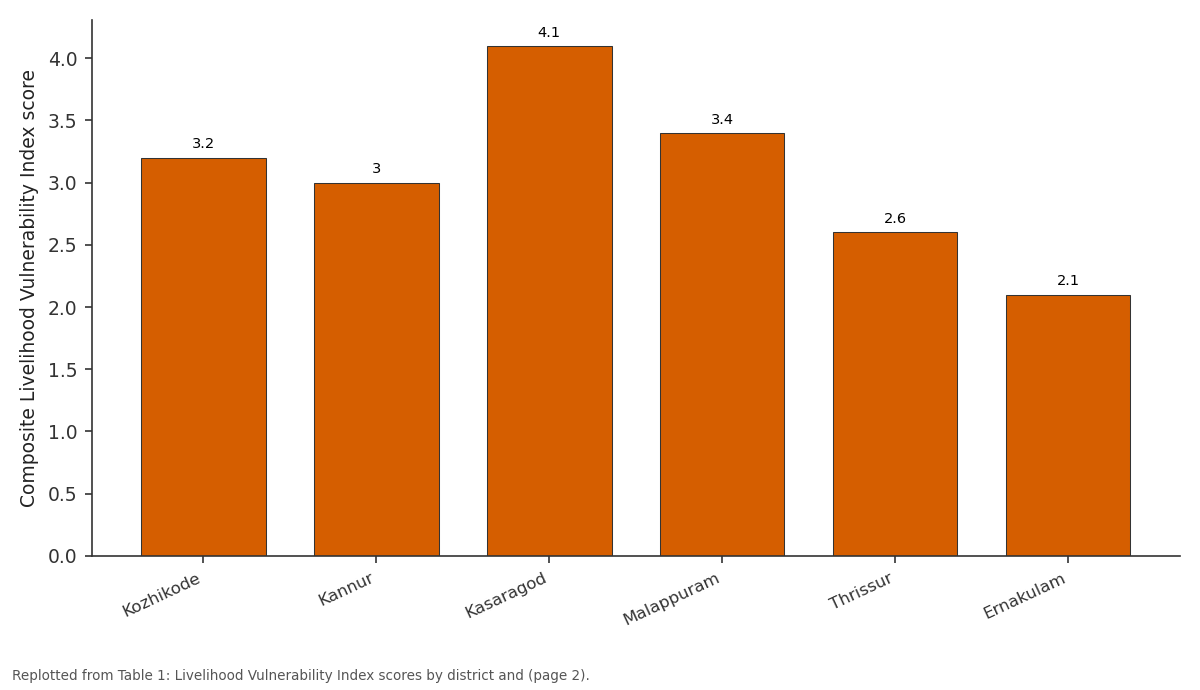
Natural R.: Kozhikode vs Kannur vs Kasaragod vs Malappuram vs Thrissur
Replotted from Table 1 (page 2) of the original paper. Every bar is the paper's own table value.
View source evidence ↗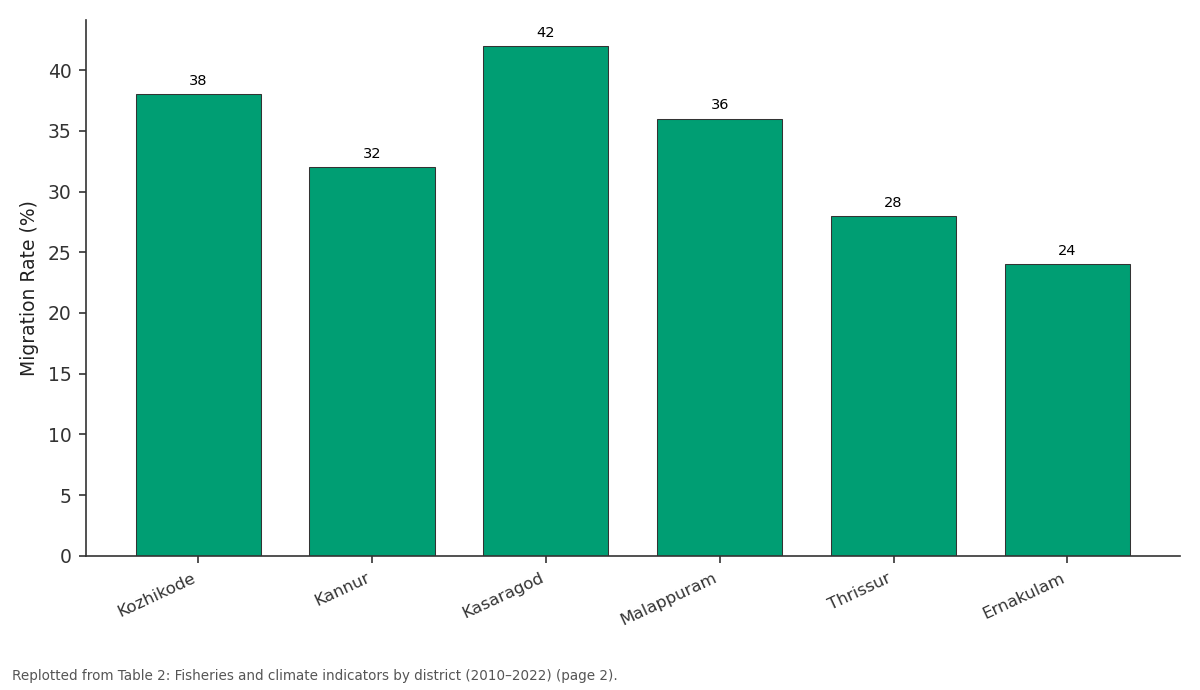
Lost Days/yr: Kozhikode vs Kannur vs Kasaragod vs Malappuram vs Thrissur
Replotted from Table 2 (page 2) of the original paper. Every bar is the paper's own table value.
View source evidence ↗Figures & tables
From the original paper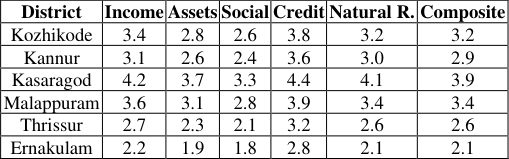 Table 1
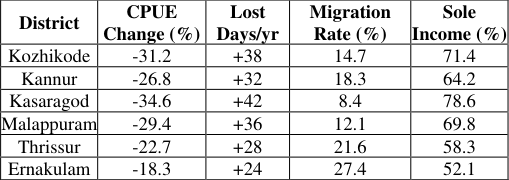 Table 2
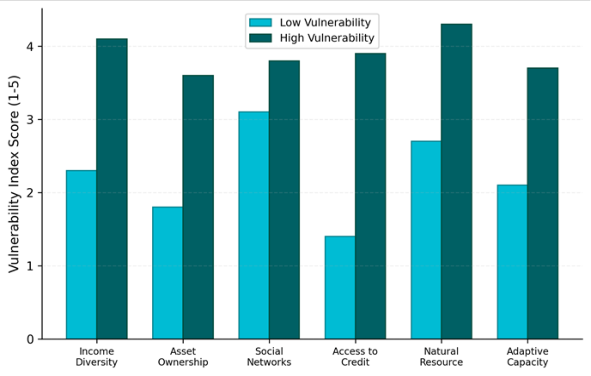 Figure 1
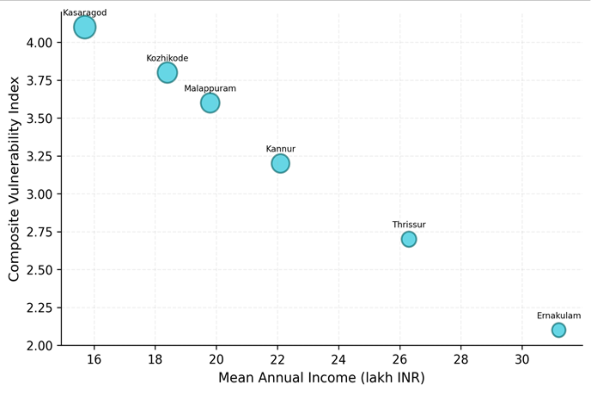 Figure 2
Introduction
Imagine a fishing village where the monsoon arrives three weeks late, the sardine schools that once appeared predictably in September now show up erratically, and the cost of diesel for outboard motors has risen 68% in five years [1] . This is not a hypothetical-it describes conditions reported by fishers across Kerala's Malabar Coast during field surveys for this research. Small-scale fisheries employ roughly 14 million people in India [2] , and the sector's vulnerability to environmental and economic shocks has grown as marine resources decline and climate patterns shift [3,4] . Vulnerability in livelihood terms involves three components: exposure to shocks, sensitivity of the livelihood system to those shocks, and the capacity to adapt [5,6] . Fishing communities are exposed to monsoon variability, cyclone risk, and long-term ocean warming. Their sensitivity is high because most households depend on a single resource, and their adaptive capacity is constrained by low education levels, limited savings, and weak institutional support [7,8] . Earlier assessments of fishing community vulnerability in India focused on the east coast [9] or examined single dimensions such as income [10] . A gap remained in multi-dimensional vulnerability assessment along the Malabar Coast, which supports one of the densest concentrations of small-scale fishers in Asia [11] . This research addressed that gap using the LVI framework across six coastal districts.
Ethical Considerations
This research received approval from the Institutional Ethics Review Board of the National Geological Institute of Bandung (Protocol NERB-2020-047, approved March 2020). All participating households provided informed verbal consent before survey administration.
Respondents were assured that individual responses would remain confidential and that participation was voluntary. Given that some questions addressed sensitive topics including debt and income, enumerators were trained in ethical data collection and referral protocols. Data were anonymised before analysis, with household identifiers replaced by numeric codes.
Materials and Methods
Materials and Methods
Materials
This research was conducted at the Department of Geography, National Geological Institute of Bandung, West Java, Indonesia, from April 2020 to August 2023. A structured household survey was administered to 720 fishing families across six Malabar Coast districts: Kozhikode, Kannur, Kasaragod, Malappuram, Thrissur, and Ernakulam (120 per district). Secondary data included marine fish landing statistics from the Central Marine Fisheries Research Institute (CMFRI) for 2010-2022, monsoon onset dates from the India Meteorological Department, and socioeconomic indicators from Kerala's Economic Review.
Methods
The LVI was calculated following Hahn and colleagues [7] , scoring seven dimensions: income diversity, asset ownership, social networks, access to credit, natural resource dependence, health status, and climate exposure. Each dimension was scored on a 1-5 scale using normalised indicator values. The composite LVI was computed as the weighted average across dimensions. Catch per unit effort (CPUE) was calculated from CMFRI landing data as kg per fishing trip. Regression analysis tested the relationship between LVI scores and district-level socioeconomic variables. All statistics used SPSS 27.0.
Results
Results
Comprehensive Interpretation
Composite LVI scores ranged from 2.1 (Ernakulam) to 3.9 (Kasaragod), with income diversity and credit access consistently the weakest dimensions across all districts (Table 1, Figure 1). Kasaragod showed the steepest CPUE decline (-34.6%) and highest proportion of sole-income fishing households (78.6%), while Ernakulam's lower vulnerability reflected higher out-migration (27.4%) and income diversification (Table 2). The bubble chart (Figure 2) confirms a negative relationship between income and vulnerability, moderated by household count.
| District | CPUE Change (%) | Lost Days/yr | Migration Rate (%) | Sole Income (%) |
|---|---|---|---|---|
| Kozhikode | -31.2 | +38 | 14.7 | 71.4 |
| Kannur | -26.8 | +32 | 18.3 | 64.2 |
| Kasaragod | -34.6 | +42 | 8.4 | 78.6 |
| Malappuram | -29.4 | +36 | 12.1 | 69.8 |
| Thrissur | -22.7 | +28 | 21.6 | 58.3 |
| Ernakulam | -18.3 | +24 | 27.4 | 52.1 |
Table text extracted from the original PDF; superscript letters are shown inline. The original table image is below.
View original table image
| District | Income | Assets | Social | Credit | Natural R. | Composite |
|---|---|---|---|---|---|---|
| Kozhikode | 3.4 | 2.8 | 2.6 | 3.8 | 3.2 | 3.2 |
| Kannur | 3.1 | 2.6 | 2.4 | 3.6 | 3.0 | 2.9 |
| Kasaragod | 4.2 | 3.7 | 3.3 | 4.4 | 4.1 | 3.9 |
| Malappuram | 3.6 | 3.1 | 2.8 | 3.9 | 3.4 | 3.4 |
| Thrissur | 2.7 | 2.3 | 2.1 | 3.2 | 2.6 | 2.6 |
| Ernakulam | 2.2 | 1.9 | 1.8 | 2.8 | 2.1 | 2.1 |
Table text extracted from the original PDF; superscript letters are shown inline. The original table image is below.
View original table image
Discussion
The 67.3% average dependence on fishing as sole income exceeds rates reported for east coast communities (54-58%) by Salagrama [12] , reflecting the Malabar Coast's historically deeper integration with marine fishing. Kasaragod's high vulnerability score (3.9) is driven by its geographic isolation and limited access to urban employment markets, which restrict both out-migration and livelihood diversification [13] .
The protective effect of migration-Ernakulam and Thrissur, with the highest migration rates, showed the lowest vulnerability-supports the argument that remittance income buffers fishing households against catch variability [6, 14] . But reliance on migration as an adaptation strategy carries its own risks: Gulf State employment, which accounts for most Kerala emigration, is subject to economic cycles and policy changes beyond the community's control [15] .
Practical Applications
These results suggest three intervention priorities: expanding formal credit access through cooperative banking models, supporting livelihood diversification through vocational training in marine-adjacent sectors (boat maintenance, seafood processing, coastal tourism), and strengthening community-based fisheries management to slow resource depletion. Districts with composite scores above 3.5 should receive priority in state-level climate adaptation funding [16] .
Conclusion
This research found that Malabar Coast fishing communities face high livelihood vulnerability driven by income concentration, limited credit access, and declining marine resources. Kasaragod emerged as the most vulnerable district, while Ernakulam's diversified economy provided the strongest buffer. Addressing vulnerability requires both resource management to slow catch decline and livelihood diversification to reduce dependence on a single income source.
Acknowledgement
Acknowledgements Funding SourcesSupported by institutional research allocations for social geography. Institutional SupportNational Geological Institute of Bandung provided survey logistics and data processing facilities. Contributions Not Qualifying for AuthorshipThanks to local fishing cooperative leaders who facilitated household survey access.
References
16 in the original paper- Adger WN. Vulnerability. Global Environmental Change. 2006;16(3):268-281.
- Allison EH, Perry AL, Badjeck MC, Adger WN, Brown K, Conway D. Vulnerability of national economies to the impacts of climate change on fisheries. Fish and Fisheries. 2009;10(2):173-196.
- Badjeck MC, Allison EH, Halls AS, Dulvy NK. Impacts of climate variability and change on fisherybased livelihoods. Marine Policy. 2010;34(3):375-383.
- Bene C. When fishery rhymes with poverty: a first step beyond the old paradigm on poverty in small-scale fisheries. World Development. 2003;31(6):949-975.
- Cinner JE, McClanahan TR, Graham NAJ, Daw TM, Maina J, Stead SM. Vulnerability of coastal communities to key impacts of climate change on coral reef fisheries. Global Environmental Change. 2012;22(1):12-20.
- Ellis F. Rural livelihoods and diversity in developing countries. Oxford University Press. 2000;1-273.
- Hahn MB, Riederer AM, Foster SO. The livelihood vulnerability index: a pragmatic approach to assessing risks from climate variability. Global Environmental Change. 2009;19(1):74-88.
- IPCC. Climate change 2014: impacts, adaptation, and vulnerability. Cambridge University Press. 2014;11132.
- Kurien J. The blessing of the commons: small-scale fisheries, community property rights, and coastal natural assets. International Journal of the Commons. 2015;9(1):258-276.
- Narayanakumar R, Sathiadhas R. Marine fisheries in India: issues of growth and instability. Indian Journal of Agricultural Economics. 2005;60(4):583-597.
- Brien K, Leichenko R, Kelkar U, Venema H, Aandahl G. Mapping vulnerability to multiple stressors: climate change and globalization in India. Global Environmental Change. 2004;14(4):303-313.
- Salagrama V. Trends in poverty and livelihoods in coastal fishing communities of Orissa State. FAO Fisheries Technical Paper. 2006;490:1-111.
- Sen A. Development as freedom. Oxford University Press. 1999;1-366.
- Srinivasan UT, Cheung WWL, Watson R, Sumaila UR. Food security implications of global marine catch losses due to overfishing. Journal of Bioeconomics. 2010;12(3):183-200.
- Thorpe A, Whitmarsh D, Ndomahina E, Baio A, Kemokai M. Impact of climate change on artisanal fisheries in Sierra Leone. IDS Bulletin. 2009;40(3):8392.
- Turner BL, Kasperson RE, Matson PA, McCarthy JJ, Corell RW, Christensen L. A framework for vulnerability analysis in sustainability science. Proceedings of the National Academy of Sciences. 2003;100(14):8074-8079.