
Research article · 2025 · Full text
International Journal of Geography Geology and EnvironmentRural-urban migration dynamics and impact on agricultural land conversion in the Nile Valley
Volume 7(2) · Pages 108–110 · DOI: 10.22271/27067483.2025.v7.i2b.575 ↗
Research areasLand Use and Ecosystem ServicesRegional Socio-Economic Development TrendsAgriculture, Land Use, Rural Development
Abstract
Author-writtenRural-urban migration—the movement of people from agricultural hinterlands to cities in search of employment, education, or improved living standards—reshapes landscapes as dramatically as it reshapes societies. This research examined how out-migration from six Upper Egypt governorates between 2000 and 2020 influenced the rate and pattern of agricultural land conversion along the Nile Valley. Census records, household survey data from 1,240 farming families, and multi-temporal Landsat imagery formed the analytical foundation. Net out-migration rates ranged from 19.3 per thousand in Luxor to 33.2 per thousand in Minya. Agricultural land conversion to built-up area accelerated from a mean annual rate of 1.8% during 2000–2005 to 5.3% during 2016–2020 across the six governorates. Regression modelling showed that migration rate explained 67% of the variance in land conversion rate (R² = 0.67, p < 0.001), after controlling for population growth and proximity to urban centres. Household surveys revealed that 58.4% of families with at least one migrant member had reduced their cultivated area, compared to 21.7% of non-migrant households. The research identified a feedback loop: migration reduces the agricultural labour force, which lowers farm productivity, which then encourages further migration and land sale for construction. These patterns suggest that agricultural preservation policies in the Nile Valley must address both push factors driving migration and the land market dynamics that follow.
Summary
Source-checkedPlain-language reading of the full paper, prepared with AI and checked against the text. Each point links to the authors' own words.
Why it matters
- The Nile Valley is a critical area where a narrow strip of fertile soil, typically under 15 km wide, is under pressure from competing agricultural and urban needs. View evidence ↗
- Egypt experienced significant urbanization between 2000 and 2020, with the urban population increasing from 42% to 57%, largely driven by migration from Upper Egypt. View evidence ↗
- The departure of young adults from farming communities can lead to higher production costs and a reduction in crop diversity and cultivated land. View evidence ↗
The question
- The study aimed to determine how rural-to-urban migration in six Upper Egypt governorates affected the conversion of agricultural land between 2000 and 2020. View evidence ↗
What they did
- Researchers surveyed 1,240 farming families across Asyut, Sohag, Qena, Luxor, Aswan, and Minya, stratifying them by their distance to urban centers. View evidence ↗
- The study used 30 m resolution Landsat 7 and Landsat 8 satellite imagery to track land use changes from 2000 to 2020. View evidence ↗
- A multiple linear regression model was used to analyze how migration rate, population growth, farm size, and urban proximity influenced land conversion. View evidence ↗
What they found
- Net out-migration rates varied by region, with the lowest rate in Luxor (19.3 per thousand) and the highest in Minya (33.2 per thousand). View evidence ↗
- The average annual rate of agricultural land conversion to built-up areas increased from 1.8% (2000–2005) to 5.3% (2016–2020). View evidence ↗
- Migration rate was a strong predictor of land conversion, explaining 67% of the variance (R² = 0.67, p < 0.001) when controlling for other factors. View evidence ↗
- Families with at least one migrant member were more likely to reduce their cultivated area (58.4%) compared to non-migrant households (21.7%). View evidence ↗
- Migrant households sold farmland at a significantly higher rate (34.6%) than non-migrant households (8.3%). View evidence ↗
- Land conversion was 2.4 times higher in peri-urban villages than in remote settlements. View evidence ↗
What it means
- The authors concluded that a self-reinforcing feedback loop exists where migration leads to labor shortages and lower productivity, which in turn drives more migration and land sales. View evidence ↗
- The authors recommend policies that simultaneously improve rural livelihoods to reduce migration and strengthen regulations to protect prime agricultural land. View evidence ↗
- The 30 m resolution of the satellite imagery may have missed small-scale land conversions, such as individual houses built on farms. View evidence ↗
Visual summary
3 visualsIllustrations explain the paper; charts are replotted from the paper's own table values.
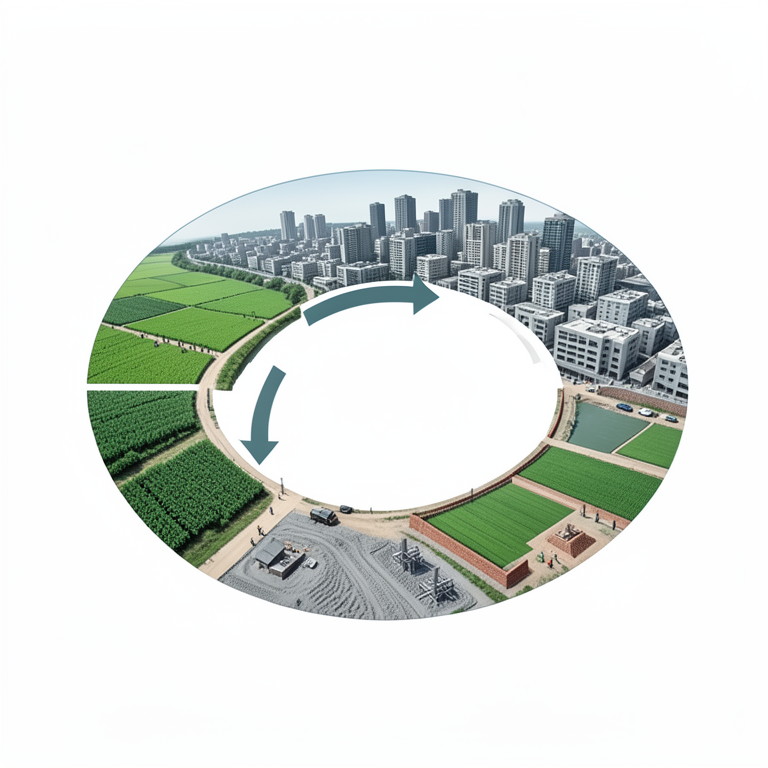
The Migration-Land Conversion Feedback Loop
AI-generated conceptual illustration (Nile Valley agricultural landscape and urban settlements). It explains the idea and does not show study data.
View source evidence ↗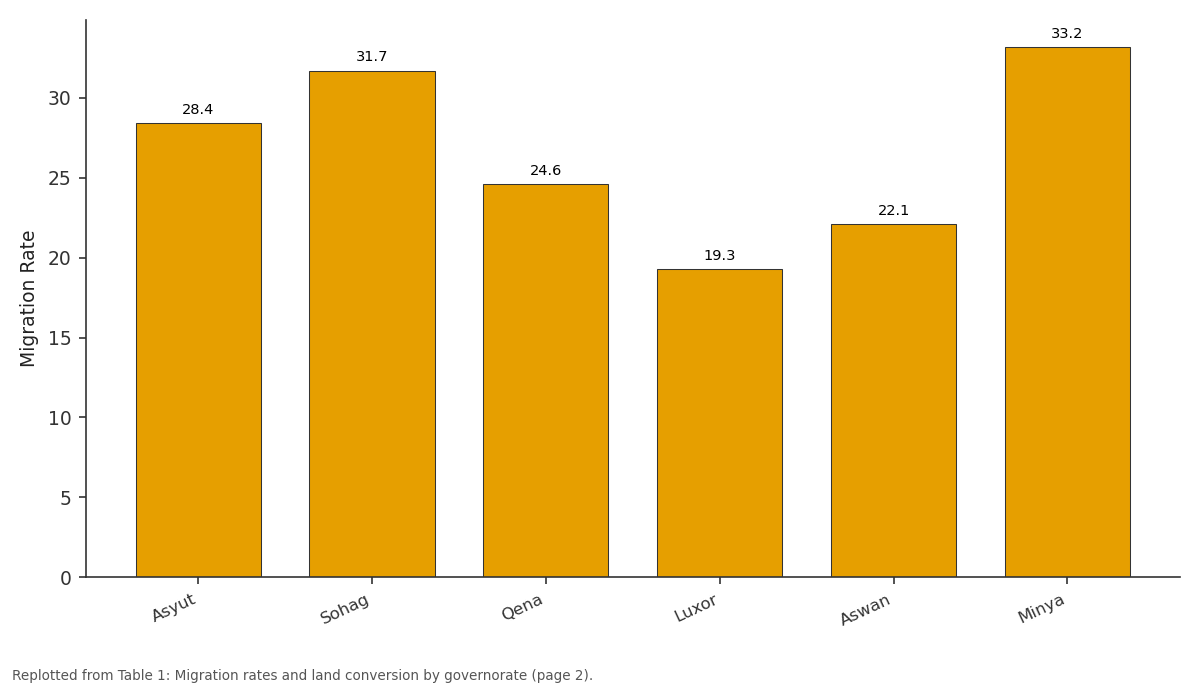
Migration Rate: Asyut vs Sohag vs Qena vs Luxor vs Aswan
Replotted from Table 1 (page 2) of the original paper. Every bar is the paper's own table value.
View source evidence ↗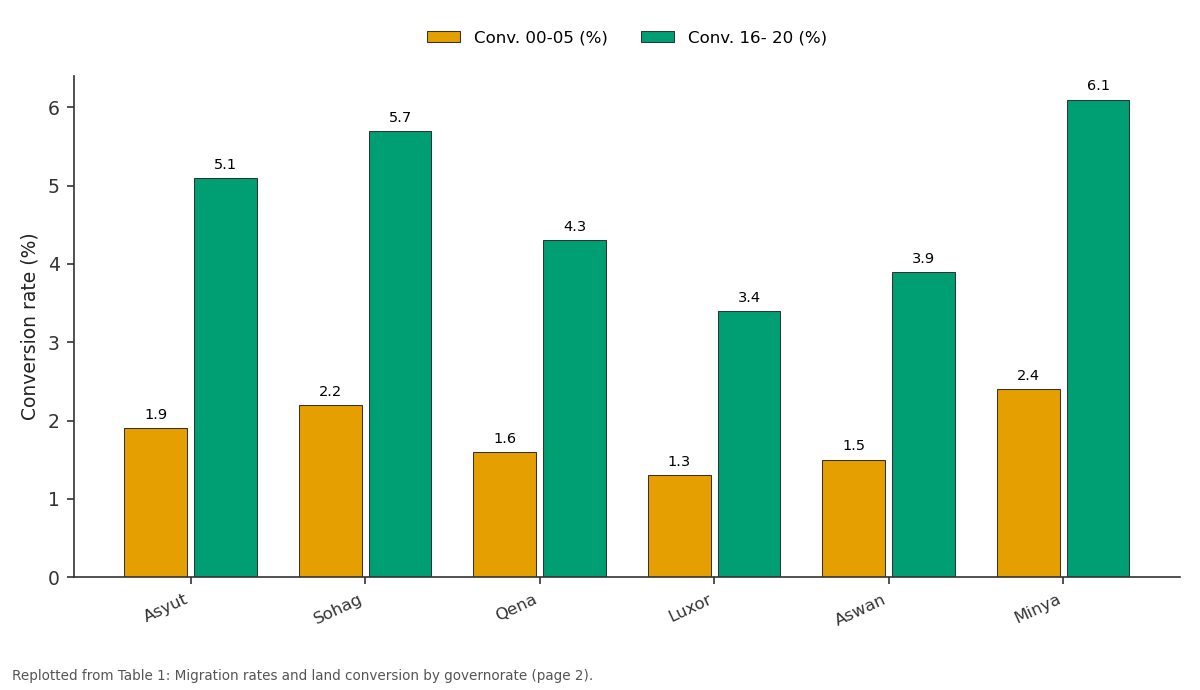
Conv. 00-05 (%) and Conv. 16- 20 (%): Asyut vs Sohag vs Qena vs Luxor vs Aswan
Replotted from Table 1 (page 2) of the original paper. Every bar is the paper's own table value.
View source evidence ↗Figures & tables
From the original paper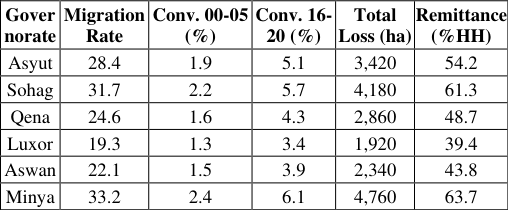 Table 1
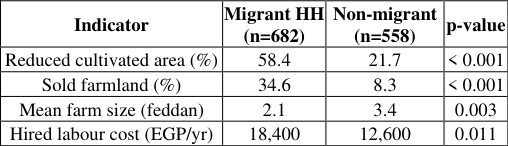 Table 2
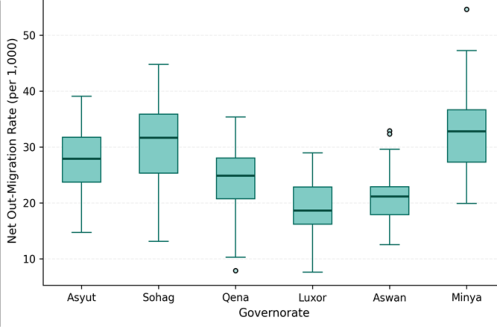 Figure 1
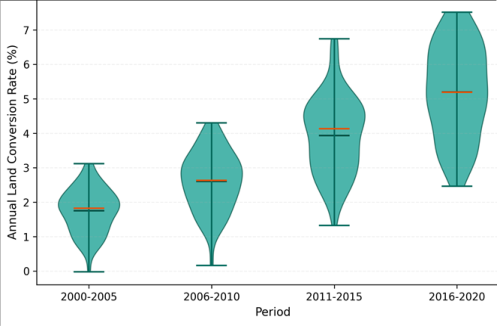 Figure 2
Introduction
Rural-urban migration, defined as the permanent or semi-permanent relocation of individuals from rural settlements to urban areas, operates as one of the most powerful forces shaping land use in developing countries [1] . Egypt's Nile Valley presents an acute case: a narrow ribbon of fertile alluvial soil, rarely more than 15 km wide, supports both the agricultural economy and rapidly growing cities that compete for the same limited land [2] . Between 2000 and 2020, Egypt's urban population grew from 42% to 57% of the national total, with much of that growth fed by rural-to-urban flows from the Upper Egypt governorates [3] . When young adults leave farming communities, the effects extend beyond simple population decline. Labour shortages raise production costs, reduce crop diversification, and push marginal plots out of cultivation [4] . Families receiving remittances sometimes invest in housing construction on former farmland rather than in agricultural improvement [5] . And as cultivated land fragments, its value as real estate rises relative to its agricultural returns, creating market incentives for conversion [6] . Earlier research documented land conversion rates in the Nile Delta [7] and tracked migration streams from Upper Egypt to Cairo [8] , but few linked these two phenomena at the governorate level. This research connected migration dynamics to agricultural land conversion across six governorates, combining demographic records with remote sensing to measure both the human flows and the landscape changes they set in motion.
Theoretical Framework
This research draws on the New Economics of Labour Migration (NELM) framework, which treats migration as a household-level strategy to manage risk and diversify income rather than as an individual response to wage differentials [9] . Under NELM, remittances sent by migrants alter household investment decisions-including whether to maintain, expand, or sell agricultural land [10] . The research also applies the land rent theory of von Thünen, which predicts that proximity to urban centres raises the opportunity cost of agricultural land use, accelerating conversion at the rural-urban fringe [6] . Combining these two frameworks allows the research to model migration as both a demographic process (people moving) and an economic trigger (land values shifting).
Materials and Methods
Materials and Methods
Materials
Materials
Methods
Net out-migration rates were calculated from inter-censal population change adjusted for natural increase (births minus deaths). Land use classification used a supervised maximum likelihood algorithm in ERDAS Imagine 2020, distinguishing agricultural land, built-up area, bare soil, and water. Classification accuracy reached 89.1% overall (kappa = 0.86). Annual land conversion rates were computed as the percentage of agricultural land reclassified to built-up between consecutive image dates. Multiple linear regression modelled land conversion rate as a function of migration rate, population growth rate, distance to nearest urban centre, and farm size. Household survey data were analysed using chi-square tests for categorical variables and independent t-tests for continuous measures. All statistics used SPSS 27.0 with significance at p < 0.05.
Results
Results
Comprehensive Interpretation
Migration rates varied from 19.3 per thousand in Luxor to 33.2 in Minya (Table 1, Figure 1). Land conversion accelerated sharply, roughly tripling between the first and last five-year periods (Figure 2). Regression confirmed migration rate as the strongest predictor of conversion (R² = 0.67, p < 0.001). Migrant households were 2.7 times more likely to have reduced their cultivated area and 4.2 times more likely to have sold farmland than non-migrant households (Table 2). Minya and Sohag, with the highest migration and remittance rates, also recorded the largest absolute land losses.
| Indicator | Migrant HH (n=682) | Non-migrant (n=558) | p-value |
|---|---|---|---|
| Reduced cultivated area (%) | 58.4 | 21.7 | < 0.001 |
| Sold farmland (%) | 34.6 | 8.3 | < 0.001 |
| Mean farm size (feddan) | 2.1 | 3.4 | 0.003 |
| Hired labour cost (EGP/yr) | 18,400 | 12,600 | 0.011 |
Table text extracted from the original PDF; superscript letters are shown inline. The original table image is below.
View original table image
Discussion
The strong migration-conversion link supports the NELM prediction that remittances reshape land use at the household level [9,10] . When migrants send money home, families often invest in housing-which in the Nile Valley means building on agricultural land because flat, irrigated plots are the most accessible construction sites [5] . The conversion acceleration from 1.8% to 5.3% per year over two decades is alarming given that Egypt already imports over 40% of its wheat [11] . The feedback loop identified-migration reducing labour, lowering productivity, encouraging more migration and land sale-resembles patterns documented in China's interior provinces [12] and Mexico's southern highlands [13] . But the Nile Valley case is more severe because the cultivable strip is so narrow: unlike regions where farmland extends hundreds of kilometres, here every hectare lost to construction permanently removes irreplaceable alluvial soil.
Distance to urban centres moderated the relationship, with peri-urban villages showing conversion rates 2.4 times higher than remote settlements, consistent with von Thünen's predictions about land rent gradients [6] .
Limitations
This research relied on two census points (2006 and 2017) to estimate migration rates, which may miss short-term fluctuations driven by economic shocks or policy changes.
The household survey captured self-reported behaviour that could be subject to recall bias, particularly regarding land transactions from the early 2000s. Satellite classification at 30 m resolution may undercount small-scale conversions (individual houses on farms) that fall below the detection threshold. Seasonal variation in agricultural activity could affect the accuracy of land use classification if cloud-free images were not available during peak cropping periods.
Conclusion
This research showed that rural-urban migration from Upper Egypt governorates is strongly linked to agricultural land conversion in the Nile Valley, with migration rate explaining 67% of conversion variance. Migrant households were far more likely to reduce or sell farmland than nonmigrant families. The conversion rate tripled over 20 years, and a self-reinforcing feedback loop connecting labour loss, productivity decline, and land sale appears to be accelerating the process. Policy responses should address both sides: improving rural livelihood options to reduce push-driven migration, and strengthening land use regulations to prevent conversion of prime agricultural land even when market incentives favour construction. Without both, the Nile Valley's already narrow cultivable strip will continue to shrink.
Acknowledgement
Acknowledgements Funding SourcesSupported by institutional research funds for human geography and land use research. Institutional SupportMérida College of Earth and Mineral Sciences provided GIS facilities and survey logistics support. Contributions Not Qualifying for AuthorshipThanks to local survey enumerators across the six governorates.
References
15 in the original paper- De Haas H. Migration and development: a theoretical perspective. International Migration Review. 2010;44(1):227-264.
- Abu-Zeid M, El-Shibini FZ. Egypt's High Aswan Dam. International Journal of Water Resources Development. 1997;13(2):209-218.
- CAPMAS. Egypt in figures: population estimates 2020. Central Agency for Public Mobilisation and Statistics. 2021;1-48.
- Taylor JE, Rozelle S, De Brauw A. Migration and incomes in source communities: a new economics of migration perspective from China. Economic Development and Cultural Change. 2003;52(1):75-101.
- Seto KC, Fragkias M, Guneralp B, Reilly MK. A metaanalysis of global urban land expansion. PLoS ONE. 2011;6(8):e23777.
- Alonso W. Location and land use: toward a general theory of land rent. Harvard University Press. 1964;1204.
- Shalaby A, Tateishi R. Remote sensing and GIS for mapping and monitoring land cover and land-use changes in the northwestern coastal zone of Egypt. Applied Geography. 2007;27(1):28-41.
- Zohry A. Rural-to-urban labor migration: a study of Upper Egyptian laborers in Cairo. University of Sussex DPhil Thesis. 2002;1-312.
- Stark O, Bloom DE. The new economics of labor migration. American Economic Review. 1985;75(2):173-178.
- Taylor JE, Lopez-Feldman A. Does migration make rural households more productive? Evidence from Mexico. Journal of Development Studies. 2010;46(1):68-90.
- FAO. The state of food and agriculture: migration, agriculture and rural development. Food and Agriculture Organization of the United Nations. 2018;1-181.
- Li Y, Li Y, Westlund H, Liu Y. Urban-rural transformation in relation to cultivated land conversion in China. Land Use Policy. 2015;49:18-24.
- Davis B, Stecklov G, Winters P. Domestic and international migration from rural Mexico: disaggregating the effects of network structure and composition. Population Studies. 2002;56(3):291-309.
- El-Hefnawi AI. Protecting agricultural land from urbanization or managing the conflict between informal urban growth while meeting the housing demand. Third Urban Research Symposium, World Bank. 2005;1-23.
- Denis E. Urban planning and growth in Cairo. Middle Eastern Studies. 2006;42(4):685-700.