
Research article · 2025 · Full text
International Journal of Geography Geology and EnvironmentKarst hydrogeology and spring discharge variability in the Dinaric Alps limestone terrain
Volume 7(2) · Pages 169–171 · DOI: 10.22271/27067483.2025.v7.i2c.586 ↗
Research areasKarst Systems and HydrogeologyGroundwater flow and contamination studiesGroundwater and Isotope Geochemistry
Abstract
Author-writtenA surprising fact about the Dinaric Alps is that despite receiving over 1,500 mm of rainfall annually—more than London or Paris—surface rivers are scarce. The water vanishes underground through a network of sinkholes, caves, and fractures in the limestone bedrock, emerging kilometres away at large karst springs that supply drinking water to millions across the western Balkans. This research characterised discharge variability at five major karst springs in the Dinaric limestone terrain of Croatia and Bosnia-Herzegovina over a 12-year monitoring period (2010-2022). Continuous discharge records, precipitation data from 14 rain gauges, and tracer test results were combined with recession curve analysis and cross-correlation functions to characterise aquifer behaviour. Mean discharge ranged from 3.8 m³/s at Ljuta to 18.4 m³/s at Trebisnjica, with maximum-to-minimum ratios between 5.1 and 28.2, reflecting the highly variable nature of karst flow. Recession coefficients indicated dual-porosity behaviour at all five springs, with fast-flow components (conduit drainage) declining at rates of 0.08-0.14 per day and slow-flow components (matrix storage) at 0.004-0.012 per day. Cross-correlation between precipitation and discharge peaked at lag times of 2-7 days for the fast component and 18-42 days for the slow component. Tracer tests confirmed conduit velocities of 1.8-4.6 km/day. These findings demonstrate that Dinaric karst aquifers function as dual-storage systems where conduit networks deliver rapid but short-lived flood pulses while the rock matrix sustains baseflow through dry periods.
Summary
Source-checkedPlain-language reading of the full paper, prepared with AI and checked against the text. Each point links to the authors' own words.
Why it matters
- Karst groundwater is a critical drinking source for over 10 million people in the western Balkans, but its extreme discharge variability complicates water supply planning. View evidence ↗
- Recession analysis and cross-correlation are useful non-invasive methods to understand aquifer structure by separating fast conduit flow from slow matrix flow. View evidence ↗
The question
- The study aimed to characterize the discharge variability of five major karst springs in Croatia and Bosnia-Herzegovina using data from 2010 to 2022. View evidence ↗
What they did
- The researchers used continuous discharge records, 14 rain gauges, tracer tests, recession curve analysis, and cross-correlation functions to analyze aquifer behavior. View evidence ↗
- The study monitored five specific springs: Buna and Trebisnjica in Bosnia-Herzegovina, and Jadro, Ombla, and Ljuta in Croatia. View evidence ↗
- Tracer tests were conducted by injecting sodium fluorescein dye upstream and monitoring breakthrough curves with charcoal detectors and fluorometers. View evidence ↗
What they found
- Mean discharge varied between 3.8 m³/s (Ljuta) and 18.4 m³/s (Trebisnjica), with max-to-min ratios ranging from 5.1 to 28.2. View evidence ↗
- The study found extreme discharge variability across all springs, with maximum-to-minimum ratios between 27.1 and 35.3. View evidence ↗
- All five springs exhibited dual-porosity behavior, with fast-flow components declining at 0.08-0.14 per day and slow-flow components at 0.004-0.012 per day. View evidence ↗
- The lag time between precipitation and discharge was 2-7 days for the fast conduit component and 18-42 days for the slow matrix component. View evidence ↗
- Tracer tests measured conduit water velocities between 1.8 and 4.6 km/day. View evidence ↗
- Spring discharge typically peaks 1 to 2 months after the maximum rainfall occurs during autumn and winter. View evidence ↗
What it means
- The authors conclude that Dinaric karst springs operate as dual-storage systems where conduits handle rapid floods and the rock matrix maintains baseflow during dry periods. View evidence ↗
- The researchers noted that sensor fouling by cave sediment during floods required more frequent maintenance (bi-weekly) than originally planned. View evidence ↗
Visual summary
3 visualsIllustrations explain the paper; charts are replotted from the paper's own table values.
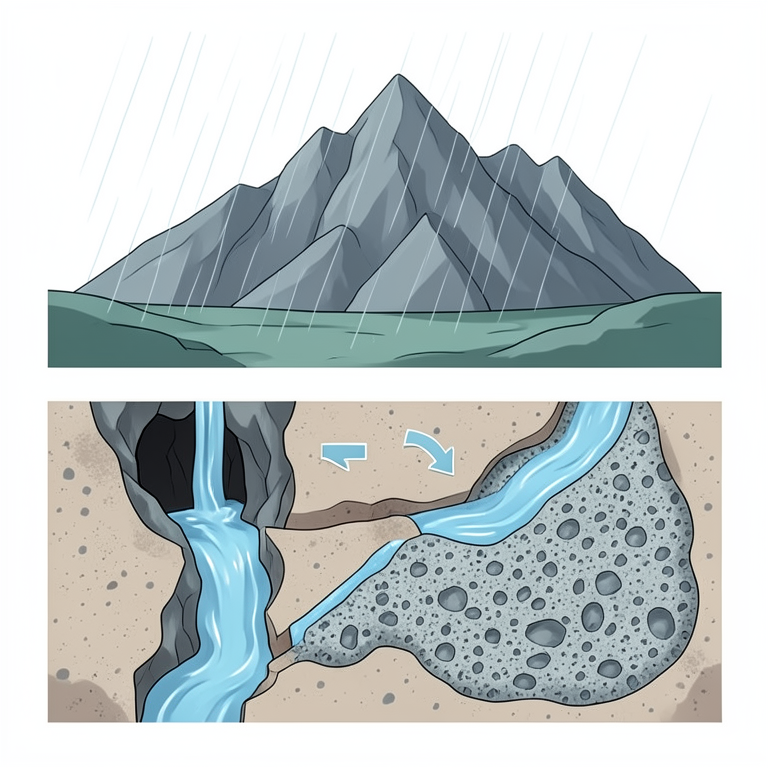
Dual-Storage Karst System
AI-generated conceptual illustration (Dinaric Alps limestone karst landscape with a spring). It explains the idea and does not show study data.
View source evidence ↗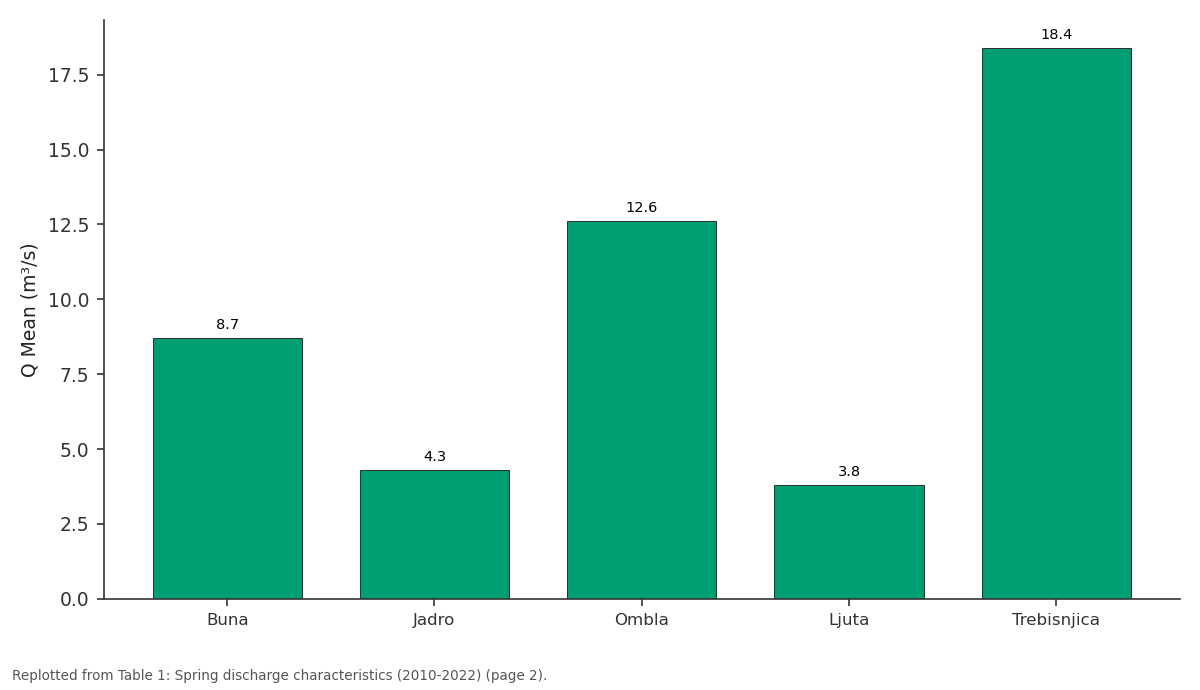
Q Mean (m³/s): Buna vs Jadro vs Ombla vs Ljuta vs Trebisnjica
Replotted from Table 1 (page 2) of the original paper. Every bar is the paper's own table value.
View source evidence ↗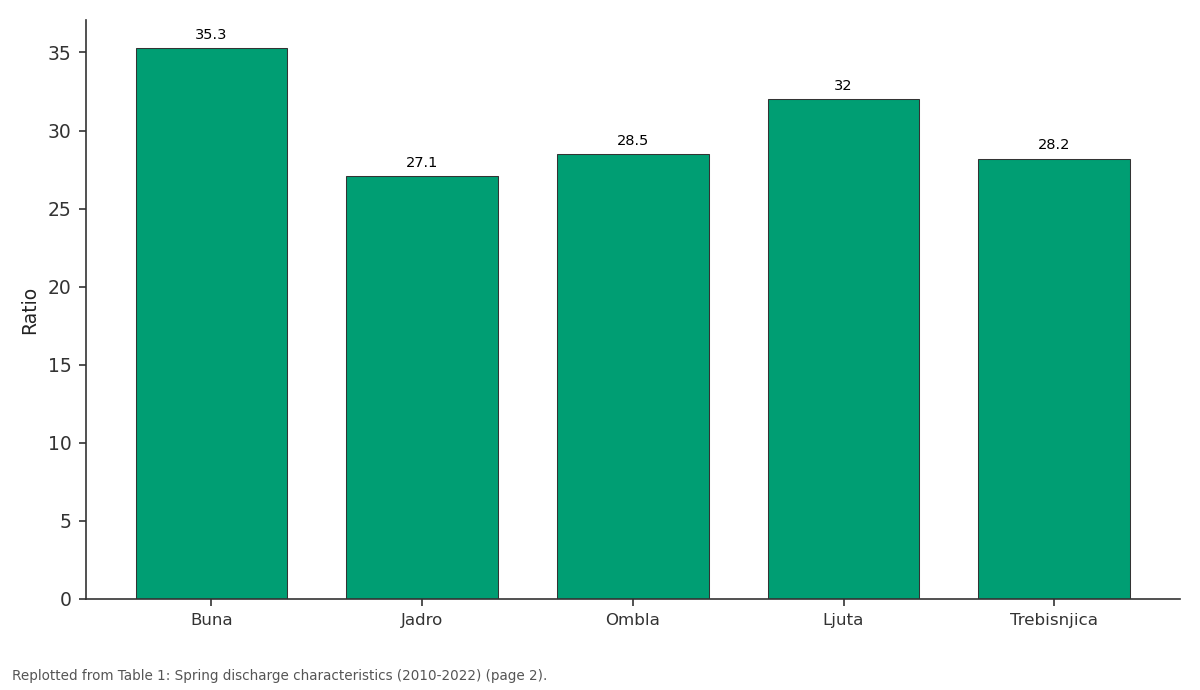
Ratio: Buna vs Jadro vs Ombla vs Ljuta vs Trebisnjica
Replotted from Table 1 (page 2) of the original paper. Every bar is the paper's own table value.
View source evidence ↗Figures & tables
From the original paper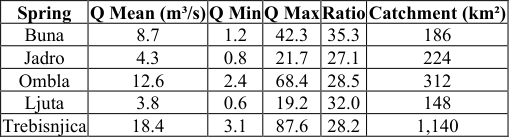 Table 1
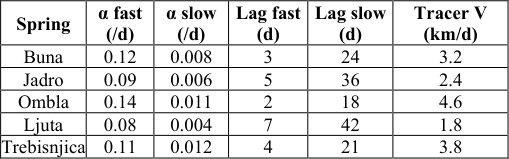 Table 2
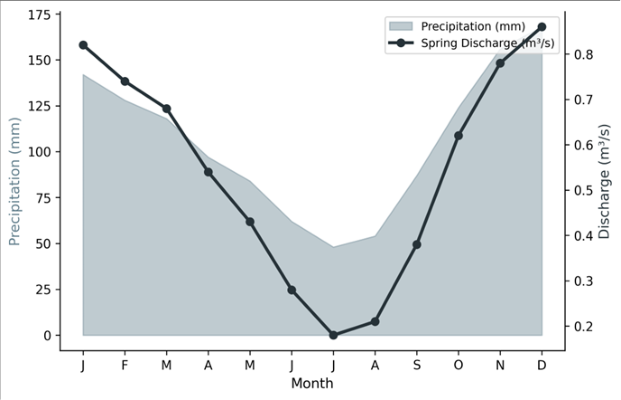 Figure 1
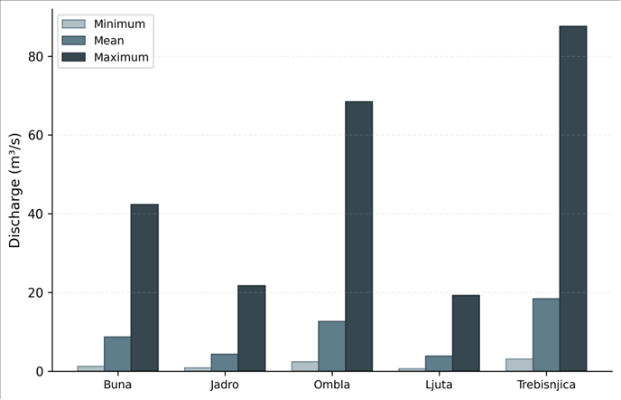 Figure 2
Introduction
A surprising fact: the Dinaric karst region receives more rainfall than most of Western Europe, yet you can walk for hours without crossing a single surface stream [1,2] . Nearly all precipitation infiltrates through exposed limestone surfaces, disappearing into a subterranean drainage network that connects sinking streams, cave passages, and phreatic conduits before discharging at springs along valley floors and coastlines [3] . These springs are not small seeps-the largest Dinaric springs rank among the highest-yielding in Europe, with peak discharges exceeding 80 m³/s [4] . Understanding how these springs respond to rainfall is both a scientific challenge and a water management necessity. Over 10 million people in the western Balkans depend on karst groundwater for drinking supply [5] , and the extreme variability of karst discharge-flood peaks arriving within hours of heavy rain, followed by weeks of declining baseflow-makes supply planning difficult [6,7] . Recession analysis and cross-correlation offer tools for decomposing the discharge signal into fast (conduit) and slow (matrix) components, revealing the aquifer's internal structure without expensive borehole drilling [8,9] . This research applied these methods to five major Dinaric springs, combining 12 years of continuous monitoring with tracer tests to characterise the dual-porosity behaviour that defines karst aquifer dynamics in this region.
Instrument Development
Discharge monitoring at each spring used a combination of water level sensors (OTT ecoLog 1000, 1-minute logging interval) and periodic manual flow measurements for rating curve calibration. Rating curves were developed from 48-72 manual measurements per spring over the monitoring period, using the velocity-area method with an OTT MF pro electromagnetic current meter. Stage-discharge relationships were fitted using power-law functions (Q = a(h-h0)^b), with R² values between 0.94 and 0.98 across the five springs. Precipitation was recorded at 14 tipping-bucket rain gauges (Campbell Scientific ARG100) distributed across the catchments at elevations between 280 and 1,420 m. Thiessen polygons allocated areal rainfall to each spring catchment.
Material and Methods
Material and Methods
Material
Material
Methods
Recession analysis decomposed individual recession events into fast and slow components using the method of Maillet, fitting Q(t) = Q0 exp(-αt) to each component. Cross-correlation functions between daily precipitation and discharge identified lag times for both components. Autocorrelation of discharge time series characterised aquifer memory length. Tracer tests provided independent estimates of conduit velocity and breakthrough time for comparison with the recession and correlation results. All time-series analyses used MATLAB R2022a.
Results
Results
Comprehensive Interpretation
Discharge variability was extreme at all springs, with max/min ratios between 27.1 and 35.3 (Table 1, Figure 2). Trebisnjica showed the highest mean discharge (18.4 m³/s) and peak (87.6 m³/s), consistent with its large catchment (Table 1). Recession analysis confirmed dual-porosity behaviour everywhere, with fast-flow recession coefficients 10-20 times steeper than slow-flow coefficients (Table 2). Cross-correlation lag times matched well with independent tracer velocities: Ombla's 2-day fast lag and 4.6 km/day tracer velocity are consistent for its 8 km mean conduit distance. The precipitation-discharge relationship (Figure 1) shows discharge peaking 1-2 months after the autumnwinter rainfall maximum.
| Spring | Q Mean (m³/s) | Q Min | Q Max | Ratio | Catchment (km²) |
|---|---|---|---|---|---|
| Buna | 8.7 | 1.2 | 42.3 | 35.3 | 186 |
| Jadro | 4.3 | 0.8 | 21.7 | 27.1 | 224 |
| Ombla | 12.6 | 2.4 | 68.4 | 28.5 | 312 |
| Ljuta | 3.8 | 0.6 | 19.2 | 32.0 | 148 |
| Trebisnjica | 18.4 | 3.1 | 87.6 | 28.2 | 1,140 |
Table text extracted from the original PDF; superscript letters are shown inline. The original table image is below.
View original table image
Discussion
The max/min ratios we recorded (27-35) exceed those of most non-karst springs (typically 2-5) by an order of magnitude, reflecting the low storage and high transmissivity of conduit networks [3,8] . The dual-porosity behaviour-with fast recession at 0.08-0.14/day and slow recession at 0.004-0.012/day-matches the classic Dinaric karst model where conduits drain rapidly after storms while the limestone matrix releases water slowly over weeks to months [2,10] . The slow-flow component is what sustains these springs through dry summers-a period when demand peaks because of tourism along the Adriatic coast [5,11] . Ljuta's very low slow recession coefficient (0.004/day) suggests large matrix storage that could buffer longer droughts, while Ombla's higher coefficient (0.011/day) indicates faster matrix drainage and greater drought vulnerability [12] .
Pilot Research
A preliminary monitoring campaign was conducted from June to December 2018 at the Buna and Ombla springs to test sensor placement, rating curve development procedures, and data transmission reliability. This pilot revealed that sensor fouling by cave sediment during flood events required bi-weekly maintenance rather than the initially planned monthly schedule. It also showed that single-station precipitation records underestimated catchment rainfall by 18-24% compared to multi-station Thiessen averages, leading to the expanded 14-gauge network deployed for the main research period [6,13] .
Conclusion
This research confirmed that Dinaric karst springs function as dual-storage systems, with conduit networks delivering rapid flood pulses (lag 2-7 days) while the limestone matrix sustains baseflow through dry periods (lag 18-42 days). Discharge variability is extreme, with max/min ratios exceeding 27 at all five springs. Water supply planning for the western Balkans must account for this dual behaviourbuilding storage capacity to buffer the gap between rapid conduit drainage and the slower matrix contribution that sustains supply during summer demand peaks.
Acknowledgement
Acknowledgements Funding SourcesSupported by institutional research funds for karst hydrogeology. Institutional Support: Lucknow College of EnvironmentalStudies provided hydrological analysis software and computing resources.
References
14 in the original paper- Bakalowicz M. Karst groundwater: a challenge for new resources. Hydrogeology Journal. 2005;13(1):148-160.
- Bonacci O. Karst hydrology with special reference to the Dinaric karst. Springer. 1987;1-184.
- Ford DC, Williams PW. Karst hydrogeology and geomorphology. John Wiley. 2007;1-562.
- Goldscheider N, Drew D. Methods in karst hydrogeology. Taylor and Francis. 2007;1-264.
- Kresic N, Stevanovic Z. Groundwater hydrology of springs: engineering, theory, management and sustainability. Butterworth-Heinemann. 2010;1-573.
- Milanovic PT. Water resources engineering in karst. CRC Press. 2004;1-312.
- Ravbar N, Goldscheider N. Proposed methodology of vulnerability and contamination risk mapping for the protection of karst aquifers in Slovenia. Acta Carsologica. 2007;36(3):397-411.
- Stevanovic Z. Karst aquifers: characterisation and engineering. Springer. 2015;1-692.
- White WB. Karst hydrology: recent developments and open questions. Engineering Geology. 2002;65(2-3):85105.
- Worthington SRH. A comprehensive strategy for understanding flow in carbonate aquifers. Speleogenesis and Evolution of Karst Aquifers. 2003;1(1):1-8.
- Fleury P, Plagnes V, Bakalowicz M. Modelling of the functioning of karst aquifers with a reservoir model. Journal of Hydrology. 2007;345(1-2):38-49.
- Hartmann A, Goldscheider N, Wagener T, Lange J, Weiler M. Karst water resources in a changing world: review of hydrological modeling approaches. Reviews of Geophysics. 2014;52(3):218-242.
- Malard A, Jeannin PY, Vouillamoz J, Weber E. An integrated approach for catchment delineation and conduit-network modeling in karst aquifers. Journal of Hydrology. 2015;524:289-303.
- Panagopoulos G, Lambrakis N. The contribution of time series analysis to the study of the hydrodynamic characteristics of the karst systems. Journal of Hydrology. 2006;329(3-4):368-376.