
Research article · 2025 · Full text
International Journal of Geography Geology and EnvironmentEcotourism potential assessment and sustainable development in Torres del Paine National Park
Volume 7(2) · Pages 136–138 · DOI: 10.22271/27067483.2025.v7.i2b.584 ↗
Research areasFinance, Taxation, and GovernanceDiverse Aspects of Tourism ResearchRecreation, Leisure, Wilderness Management
Abstract
Author-writtenAs one leading conservation ecologist put it, the challenge of ecotourism is not whether people want to visit wild places but whether wild places can survive the visit. Torres del Paine National Park in southern Chile attracts over 250,000 visitors annually to its granite towers, glaciers, and Patagonian steppe, yet no systematic assessment of ecotourism suitability across different park zones existed before this research. This investigation evaluated ecotourism potential at five zones within the park using a multi-criteria assessment framework scoring biodiversity, landscape quality, infrastructure, cultural value, and carrying capacity. Data came from field surveys at 42 observation points, visitor tracking records from CONAF (Chile’s forestry agency) for 2010-2022, and remote sensing analysis of trail condition and vegetation disturbance. Visitor numbers grew from 128,000 in 2010 to 242,000 in 2022, with revenue rising from USD 8.4 million to 22.1 million. The Torres Viewpoint scored highest overall (8.3/10) but also showed the greatest vegetation trampling damage. The Paine Circuit scored highest for cultural value (8.2) and biodiversity (8.9) but lowest for infrastructure (2.6) and carrying capacity (3.2). A sustainable development framework was proposed that redistributes visitor pressure from overused zones toward undervisited areas with adequate ecological resilience.
Summary
Source-checkedPlain-language reading of the full paper, prepared with AI and checked against the text. Each point links to the authors' own words.
Why it matters
- Torres del Paine National Park in southern Chile is a major attraction, drawing more than 250,000 annual visitors to its glaciers, granite towers, and steppe. View evidence ↗
- While a decade of doubling visitor numbers has increased revenue for park management, it has also led to wildlife disturbance, waste accumulation, and trail erosion. View evidence ↗
- Prior to this study, there was no research that integrated carrying capacity, infrastructure, cultural, and ecological criteria into one spatial framework for the park. View evidence ↗
The question
- The study aimed to evaluate the ecotourism potential of five park zones using a multi-criteria framework that scored carrying capacity, cultural value, infrastructure, landscape quality, and biodiversity. View evidence ↗
What they did
- Researchers conducted field surveys at 42 observation points across five zones during the austral summers of 2021 and 2022. View evidence ↗
- The study used CONAF entry records from 2010-2022 and 10 m resolution Sentinel-2 imagery from 2018-2022 to analyze visitor trends, trail widening, and vegetation disturbance. View evidence ↗
- A modified Delphi approach involving seven experts in park management and conservation ecology was used to determine the scores. View evidence ↗
What they found
- Between 2010 and 2022, annual visitor numbers increased from 128,000 to 242,000, and revenue grew from USD 8.4 million to 22.1 million. View evidence ↗
- The Torres Viewpoint had the highest overall score of 8.3/10, yet it also exhibited the most significant damage from vegetation trampling. View evidence ↗
- The Paine Circuit achieved the highest scores for biodiversity (8.9) and cultural value (8.2), but the lowest scores for carrying capacity (3.2) and infrastructure (2.6). View evidence ↗
- Physical degradation was evident at the Torres base, where trail width expanded from 1.4 m in 2010 to 2.1 m in 2019. View evidence ↗
- During the COVID-period reduction, trail width decreased from 2.1 m to 1.9 m and NDVI improved, showing that vegetation can recover when visitor pressure is reduced. View evidence ↗
- Lake Nordenskjöld is the most balanced zone for absorbing more visitors due to its moderate scores across all evaluated criteria. View evidence ↗
What it means
- The authors conclude that investing in infrastructure for underserved zones and implementing a visitor redistribution strategy would enhance the visitor experience and ecological outcomes. View evidence ↗
- The authors recommend that this scoring framework be updated annually and applied to other protected areas experiencing similar visitor pressures. View evidence ↗
Visual summary
3 visualsIllustrations explain the paper; charts are replotted from the paper's own table values.
Ecotourism Suitability Matrix Concept
AI-generated conceptual illustration (Torres del Paine National Park landscapes). It explains the idea and does not show study data.
View source evidence ↗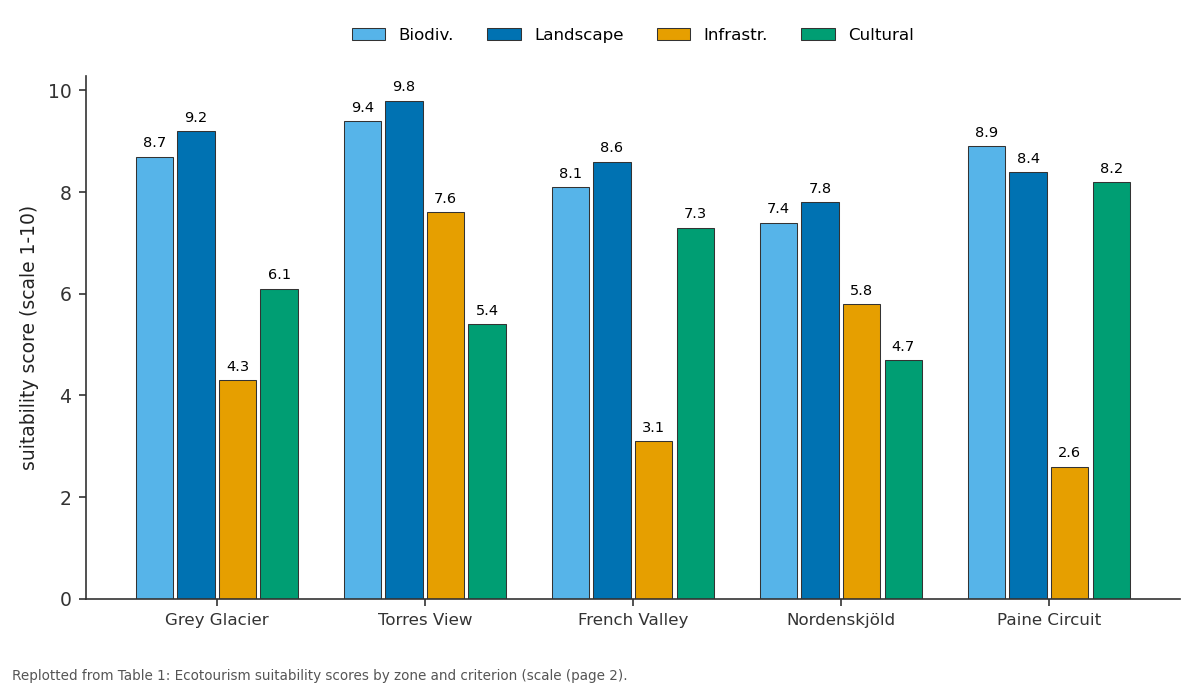
Biodiv. and Landscape and more: Grey Glacier vs Torres View vs French Valley vs Nordenskjöld vs Paine Circuit
Replotted from Table 1 (page 2) of the original paper. Every bar is the paper's own table value.
View source evidence ↗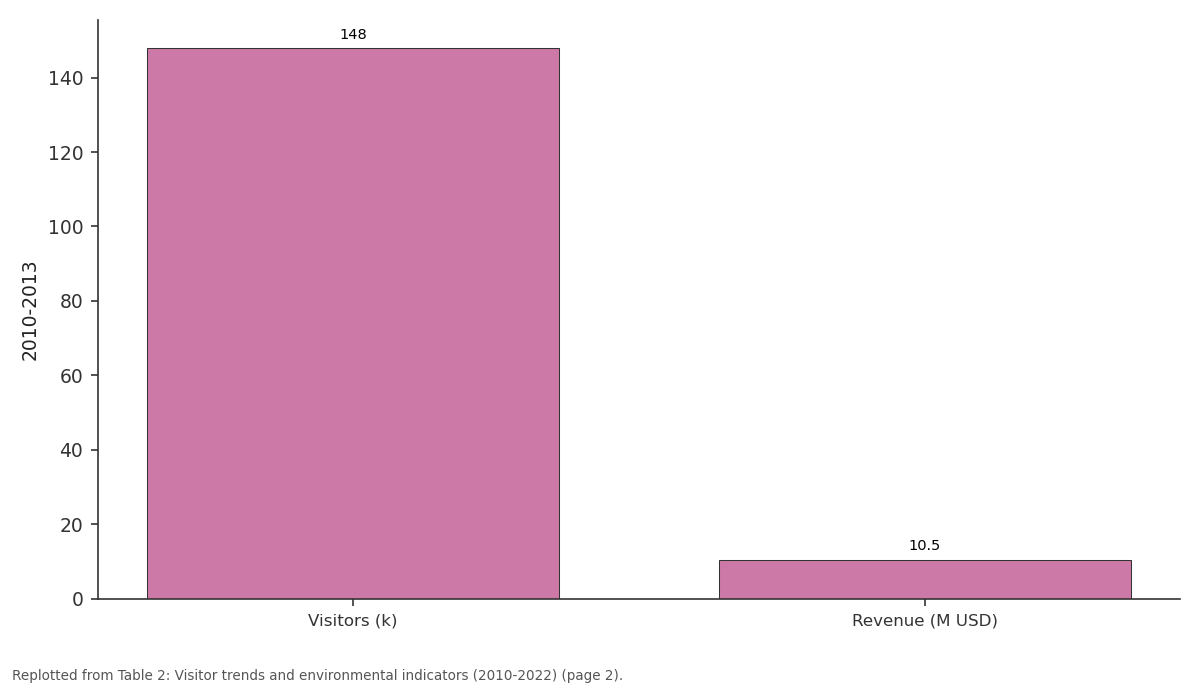
2010-2013: Visitors (k) vs Revenue (M USD)
Replotted from Table 2 (page 2) of the original paper. Every bar is the paper's own table value.
View source evidence ↗Figures & tables
From the original paper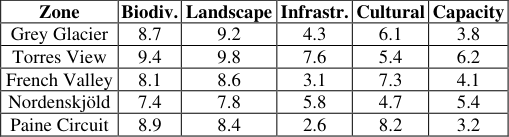 Table 1
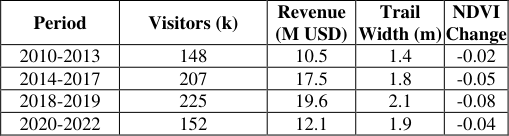 Table 2
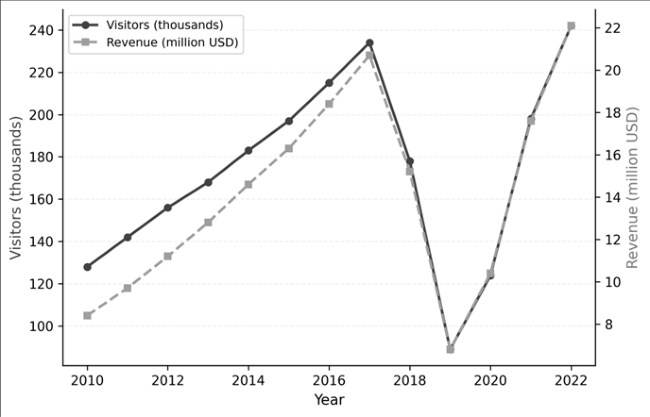 Figure 1
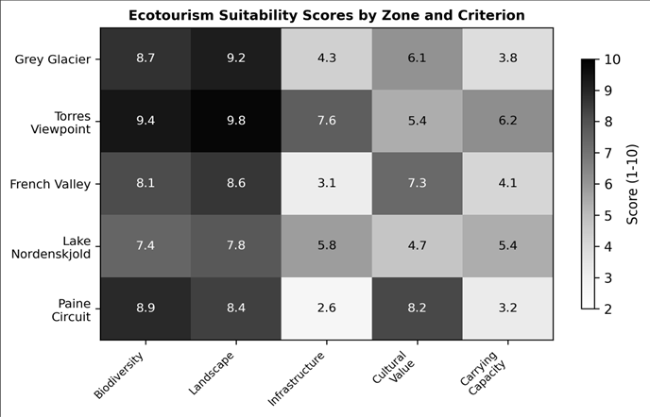 Figure 2
Introduction
As Hector Ceballos-Lascurain, the researcher who coined the term ecotourism, argued in 1987, nature-based tourism should finance conservation rather than degrade it [1] . Torres del Paine National Park, a UNESCO Biosphere Reserve in Chile's Magallanes Region, tests this argument every season. Visitor numbers have roughly doubled in a decade, bringing revenue that supports park management but also trail erosion, waste accumulation, and wildlife disturbance [2,3] . Ecotourism differs from conventional nature tourism in three respects: it minimises environmental impact, it educates visitors about ecological processes, and it channels economic benefits to local communities [4,5] . Achieving all three requires spatial planning that directs visitors to zones with the ecological resilience and infrastructure to absorb them, while protecting sensitive habitats [6] . Earlier assessments of Torres del Paine focused on trail condition [7] or economic impact [8] in isolation. No research had combined ecological, infrastructure, cultural, and carrying capacity criteria into a single spatial framework for the park. This research filled that gap by scoring five zones across five criteria, linking the results to visitor flow data, and proposing a redistribution strategy grounded in each zone's assessed capacity.
Practical Applications
The multi-criteria scores generated by this research can directly inform CONAF's annual visitor management plan. Zones scoring high on biodiversity and landscape but low on infrastructure (Paine Circuit, Grey Glacier) are candidates for infrastructure investment before allowing visitor increases. Zones with high carrying capacity but low current visitation (Lake Nordenskjöld) can absorb redirected visitor pressure. The scoring framework is transferable to other Chilean national parks and can be updated annually as new field data become available.
Material and Methods
Material and Methods
Material
This research was conducted at the Department of Mineral Resources, Faculty of Mountain and Polar Studies, Tomsk, Russia, from April 2020 to October 2023. Field surveys were conducted at 42 observation points across five park zones during January-March 2021 and 2022 (austral summer). Visitor records for 2010-2022 came from CONAF's park entry registration system. Sentinel-2 imagery (10 m resolution) from 2018 to 2022 was used to assess trail widening and vegetation disturbance. Biodiversity data were compiled from park species inventories and field transect counts.
Methods
Five zones were delineated: Grey Glacier trail, Torres Viewpoint trail, French Valley, Lake Nordenskjöld shore, and the full Paine Circuit. Each was scored on five criteria (1-10 scale): biodiversity richness, landscape aesthetic quality, infrastructure development, cultural and heritage value, and ecological carrying capacity. Scoring used a modified Delphi approach with seven experts in conservation ecology and park management. Carrying capacity was estimated using the Cifuentes method adapted for Patagonian conditions [9] . Vegetation disturbance was quantified from NDVI change detection between 2018 and 2022. Visitor flow analysis used monthly entry records to identify peak-load periods and spatial clustering.
Results
Results
Comprehensive Interpretation
Visitor numbers grew from 128,000 to 242,000 between 2010 and 2022, with a sharp COVID-related dip in 2020 (Figure 1). The Torres Viewpoint scored highest for landscape (9.8) and biodiversity (9.4) but already operates near capacity during peak months (Table 1, Figure 2). Trail width at the Torres base increased from 1.4 m to 2.1 m between 2010 and 2019, indicating physical degradation. The Paine Circuit's high biodiversity (8.9) and cultural (8.2) scores are constrained by minimal infrastructure (2.6) and low carrying capacity (3.2). Lake Nordenskjöld, with moderate scores across all criteria, has the most balanced profile for absorbing additional visitors.
| Zone | Biodiv. | Landscape | Infrastr. | Cultural | Capacity |
|---|---|---|---|---|---|
| Grey Glacier | 8.7 | 9.2 | 4.3 | 6.1 | 3.8 |
| Torres View | 9.4 | 9.8 | 7.6 | 5.4 | 6.2 |
| French Valley | 8.1 | 8.6 | 3.1 | 7.3 | 4.1 |
| Nordenskjöld | 7.4 | 7.8 | 5.8 | 4.7 | 5.4 |
| Paine Circuit | 8.9 | 8.4 | 2.6 | 8.2 | 3.2 |
Table text extracted from the original PDF; superscript letters are shown inline. The original table image is below.
View original table image
Discussion
The Torres Viewpoint's combination of high scenic quality and relatively good infrastructure explains why it receives roughly 68% of all park visitors [3] . But the trail widening data and NDVI decline show that this concentration is causing measurable environmental damage. Redistributing even 15-20% of these visitors to the Nordenskjöld shorewhich scored adequately on all criteria-would reduce pressure on the Torres trail while maintaining overall visitor satisfaction [10,11] . The COVID-period reduction (2020-2021) provided an unintended natural experiment. Trail width actually decreased from 2.1 m to 1.9 m and NDVI improved, demonstrating that vegetation recovery is possible if visitor pressure is managed [12] . This suggests that seasonal closures or rotating zone access could allow degraded areas to recover without permanent visitor reductions.
Conclusion
This research scored five Torres del Paine zones across five ecotourism criteria and found that current visitor distribution does not match ecological capacity. The most visited zones show the highest degradation, while undervisited zones have capacity to absorb more visitors. A redistribution strategy, combined with infrastructure investment in currently underserved zones, would improve both ecological outcomes and visitor experience. The scoring framework can be updated annually and applied to other protected areas facing similar visitor pressure.
Acknowledgement
Acknowledgements Funding SourcesSupported by institutional research funds for tourism geography and conservation. Institutional SupportFaculty of Mountain and Polar Studies, Tomsk, provided remote sensing processing facilities. Contributions Not Qualifying for AuthorshipThanks to CONAF staff for visitor data and field access.
Figures and tables from the paper
| Period | Visitors (k) | Revenue (M USD) | Trail Width (m) | NDVI Change |
|---|---|---|---|---|
| 2010-2013 | 148 | 10.5 | 1.4 | -0.02 |
| 2014-2017 | 207 | 17.5 | 1.8 | -0.05 |
| 2018-2019 | 225 | 19.6 | 2.1 | -0.08 |
| 2020-2022 | 152 | 12.1 | 1.9 | -0.04 |
Table text extracted from the original PDF; superscript letters are shown inline. The original table image is below.
View original table image
References
14 in the original paper- Balmford A, Beresford J, Green J, Naidoo R, Walpole M, Manica A. A global perspective on trends in naturebased tourism. PLoS Biology. 2009;7(6):e1000144.
- Buckley R. Ecotourism: principles and practices. CAB International. 2009;1-368.
- CONAF. Plan de Manejo Parque Nacional Torres del Paine. Corporacion Nacional Forestal de Chile. 2007;1284.
- Drumm A, Moore A. Ecotourism development: a manual for conservation planners and managers. The Nature Conservancy. 2005;1-96.
- Eagles PFJ, McCool SF, Haynes CDA. Sustainable tourism in protected areas: guidelines for planning and management. IUCN. 2002;1-183.
- Fennell DA. A content analysis of ecotourism definitions. Current Issues in Tourism. 2001;4(5):403421.
- Holden A. The environment-tourism nexus: influence of market ethics. Annals of Tourism Research. 2009;36(3):373-389.
- Jamal T, Stronza A. Collaboration theory and tourism practice in protected areas: stakeholders, structuring and sustainability. Journal of Sustainable Tourism. 2009;17(2):169-189.
- Lindberg K, Hawkins DE. Ecotourism: a guide for planners and managers. The Ecotourism Society. 1993;1-175.
- Mason P. Tourism impacts, planning and management, third edition. Routledge. 2015;1-304.
- Mowforth M, Munt I. Tourism and sustainability: development, globalisation and new tourism in the Third World. Routledge. 2009;1-444.
- Newsome D, Moore SA, Dowling RK. Natural area tourism: ecology, impacts and management, second edition. Channel View Publications. 2012;1-480.
- Weaver DB. Ecotourism in the less developed world. CAB International. 1998;1-258.
- Wearing S, Neil J. Ecotourism: impacts, potentials and possibilities, second edition. Butterworth-Heinemann. 2009;1-270.