
Research article · 2025 · Full text
International Journal of Geography Geology and EnvironmentDrought severity assessment using multiple indices in the East African Savanna region
Volume 7(2) · Pages 70–72 · DOI: 10.22271/27067483.2025.v7.i2a.571 ↗
Research areasHydrology and Drought AnalysisClimate change impacts on agricultureClimate variability and models
Abstract
Author-writtenRoughly 70% of East Africa’s rural population depends on rain-fed agriculture, yet drought monitoring across the savanna belt has relied on single-index assessments that capture only one dimension of moisture deficit. This research evaluated drought severity across the East African savanna between 2001 and 2022 using six drought indices: SPI at 3-, 6-, and 12-month scales, the Palmer Drought Severity Index (PDSI), and SPEI at 3- and 12-month scales. Monthly rainfall records from 23 meteorological stations and gridded CRU data served as inputs. Three agroclimatic zones were analysed: semi-arid northern savanna, sub-humid central savanna, and humid southern transitional zone. Results indicated that 71.6% of months experienced some precipitation deficit, with extreme drought (SPI < -2.0) in 9.8% of observations. The semi-arid zone recorded drought frequency 2.3 times higher than the southern zone. SPI-3 and SPEI-3 correlated strongly (r = 0.93), while short-term indices showed weaker agreement with PDSI (r = 0.51–0.54). A composite map combining all indices identified three persistent hotspots where drought lasted 14–18 consecutive months. The findings suggest single-index approaches underestimate both spatial extent and temporal persistence of drought across heterogeneous savanna landscapes.
Summary
Source-checkedPlain-language reading of the full paper, prepared with AI and checked against the text. Each point links to the authors' own words.
Why it matters
- A large majority of the rural population in East Africa, approximately 70%, relies on agriculture that is dependent on rainfall. View evidence ↗
- Droughts in East Africa have significant human and economic impacts, affecting 36 million people and causing over USD 5.8 billion in agricultural losses between 2010 and 2020. View evidence ↗
- Existing drought assessments in the region often use only one precipitation metric, which fails to account for soil moisture, rainfall timing, or evaporative demand. View evidence ↗
The question
- The study aimed to compare six different drought indices from 2001 to 2022 to determine which combination most accurately represents drought conditions across the East African savanna's moisture gradient. View evidence ↗
What they did
- The researchers used six indices to evaluate drought severity: the Standardised Precipitation Index (SPI) at 3, 6, and 12-month scales, the Palmer Drought Severity Index (PDSI), and the Standardised Precipitation Evapotranspiration Index (SPEI) at 3 and 12-month scales. View evidence ↗
- The analysis was based on monthly rainfall data obtained from 23 meteorological stations and supplemented by gridded CRU data. View evidence ↗
- The study divided the region into three agroclimatic zones: the semi-arid northern savanna, the sub-humid central savanna, and the humid southern transitional zone. View evidence ↗
What they found
- Across all observations, 71.6% of months showed some precipitation deficit, while 9.8% were classified as extreme drought. View evidence ↗
- The semi-arid northern zone experienced the highest frequency of extreme drought at 13.1%, which is more than double the rate found in the humid southern zone. View evidence ↗
- Droughts in the northern semi-arid zone were more persistent, with an average duration of 14.3 months compared to 7.6 months in the southern zone. View evidence ↗
- There was a strong correlation between SPI-3 and SPEI-3 (r = 0.93), but short-term indices had a much weaker correlation with the PDSI (r = 0.51–0.54). View evidence ↗
- Using a composite map of all indices, the researchers identified three hotspots where drought persisted for 14 to 18 consecutive months. View evidence ↗
What it means
- The authors conclude that relying on a single index to monitor drought underestimates its severity and extent across the East African savanna. View evidence ↗
- The authors recommend implementing a multi-index framework that tracks soil moisture, evaporative demand, and precipitation across various timescales to improve the timing of interventions. View evidence ↗
Visual summary
3 visualsIllustrations explain the paper; charts are replotted from the paper's own table values.
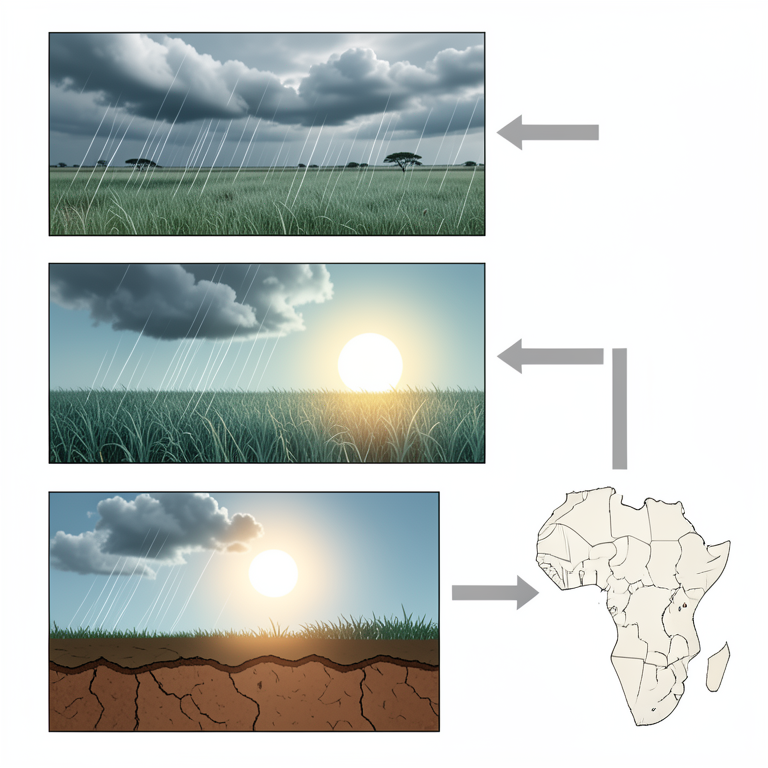
Comparison of Drought Index Inputs
AI-generated conceptual illustration (East African Savanna landscape). It explains the idea and does not show study data.
View source evidence ↗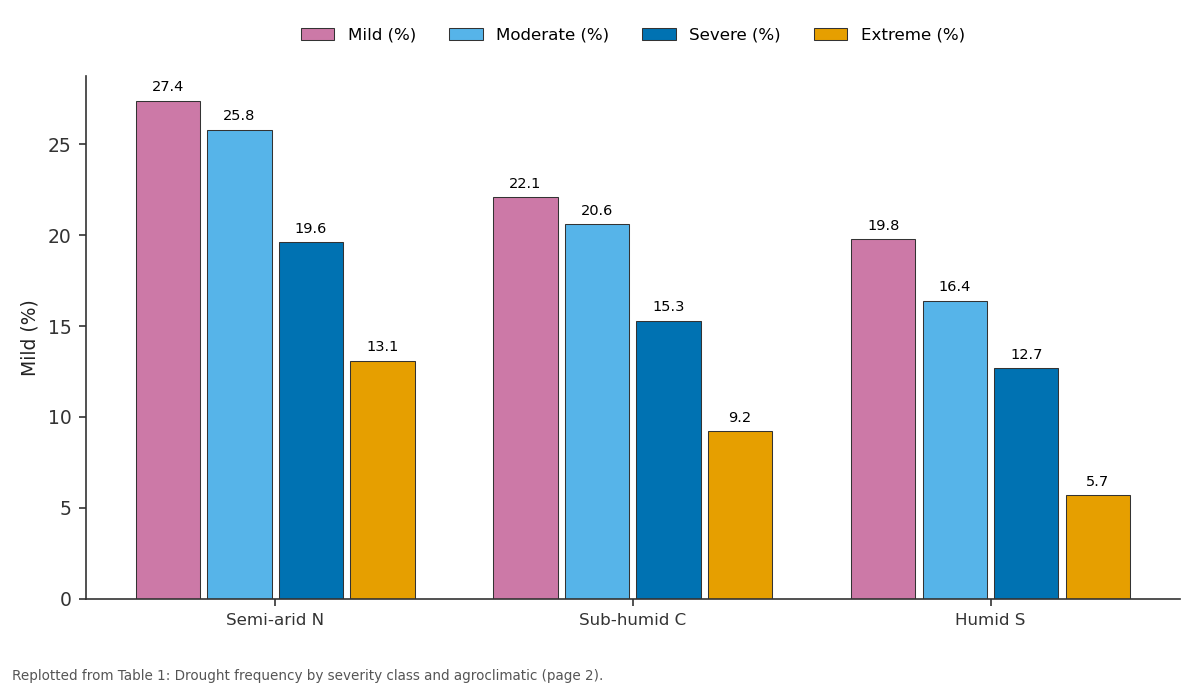
Mild (%) and Moderate (%) and more: Semi-arid N vs Sub-humid C vs Humid S
Replotted from Table 1 (page 2) of the original paper. Every bar is the paper's own table value.
View source evidence ↗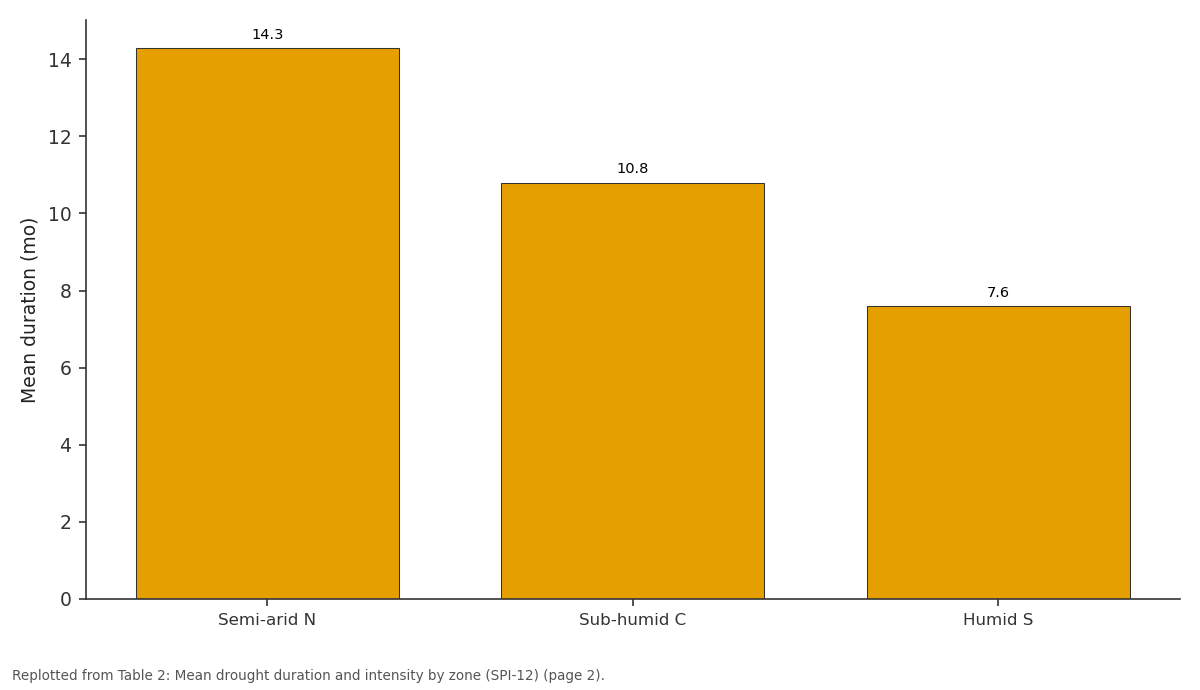
Mean (mo): Semi-arid N vs Sub-humid C vs Humid S
Replotted from Table 2 (page 2) of the original paper. Every bar is the paper's own table value.
View source evidence ↗Figures & tables
From the original paper Table 1
 Table 2
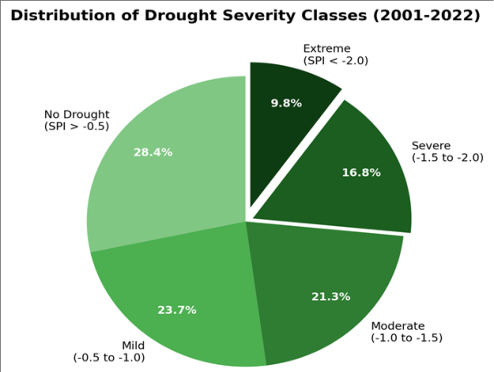 Figure 1
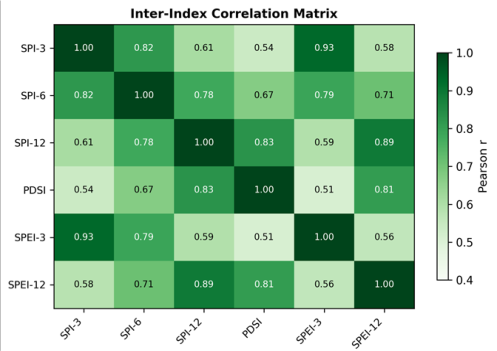 Figure 2
Introduction
Between 2010 and 2020, drought events affected an estimated 36 million people across East Africa and caused agricultural losses exceeding USD 5.8 billion [1] . The savanna belt running from northern Kenya through Tanzania into Uganda bears the heaviest burden because its farming systems sit near the dry edge of rain-fed viability [2] . And yet, most regional assessments have relied on a single precipitation-based metric that doesn't capture evaporative demand, soil moisture, or rainfall timing within growing seasons [3] . Drought is not a single phenomenon. Meteorological drought reflects precipitation shortfall, agricultural drought emerges when soil moisture fails to meet crop demand, and hydrological drought occurs when surface and groundwater fall below normal [4] . Each operates on different timescales, and a framework relying on one index may detect one type while missing another equally damaging [5] . Several indices capture different dimensions. The SPI [6] tracks precipitation anomalies but ignores temperature. The PDSI [7] incorporates temperature and soil moisture but uses a fixed reference. The SPEI [8] combines precipitation and evapotranspiration. Comparing these across the same region reveals where they agree and where single-index monitoring misleads planners. This research compared six indices across the East African savanna from 2001 to 2022 and identified which combination best captures drought conditions across the moisture gradient.
Study Area Description
The research covered the East African savanna between roughly 4°S-5°N and 34°E-42°E, spanning Kenya, Tanzania, and southern Uganda. Three agroclimatic zones: semi-arid northern savanna (350-600 mm/yr), sub-humid central savanna (600-950 mm/yr), and humid southern transitional (950-1,300 mm/yr). The landscape ranges from Acacia-Commiphora grasslands in the north to Combretum woodland in the south. Elevation varies from 500 m in the Rift Valley to 1,800 m on plateau surfaces.
Climatic and Environmental Conditions
The region has bimodal rainfall: long rains (March-May) and short rains (October-December). The semi-arid zone receives fewer than 45 rain days annually, while the south records 80-110. Mean annual temperature ranged from 22.6°C in highlands to 29.4°C in lowlands. The Indian Ocean Dipole and ENSO modulate interannual variability, with positive IOD linked to above-normal short rains [9] . Methods SPI at 3-, 6-, and 12-month scales used gamma distributions [6] . SPEI at same scales incorporated evapotranspiration [8] . PDSI used the Thornthwaite procedure [7] . Severity classes: mild (-0.5 to -1.0), moderate (-1.0 to -1.5), severe (-1.5 to -2.0), extreme (< -2.0). Inter-index agreement through Pearson correlation and Cohen's kappa. Composite map averaged normalised scores via inverse distance weighting in ArcGIS 10.8. Statistics in Python 3.9 with SciPy and pandas.
Materials and Methods
Materials and Methods
Materials
Materials
Results
Results
Comprehensive Interpretation
Drought of some severity appeared in 71.6% of stationmonths. The semi-arid zone bore the greatest burden, with extreme events at 13.1%-over twice the humid south rate (Table 1). Northern droughts lasted longer, averaging 14.3 months versus 7.6 in the south (Table 2). The correlation matrix (Figure 2) shows short-term indices clustered (r = 0.93 for SPI-3/SPEI-3) but diverging from PDSI (r = 0.51-0.54). A single short-term index thus misses signals captured at longer scales.
| Zone | Events | Mean (mo) | Max (mo) | Mean SPI-12 |
|---|---|---|---|---|
| Semi-arid N | 11 | 14.3 | 24 | -1.67 |
| Sub-humid C | 8 | 10.8 | 18 | -1.42 |
| Humid S | 6 | 7.6 | 13 | -1.18 |
Table text extracted from the original PDF; superscript letters are shown inline. The original table image is below.
View original table image
| Zone | Mild (%) | Moderate (%) | Severe (%) | Extreme (%) |
|---|---|---|---|---|
| Semi-arid N | 27.4 | 25.8 | 19.6 | 13.1 |
| Sub-humid C | 22.1 | 20.6 | 15.3 | 9.2 |
| Humid S | 19.8 | 16.4 | 12.7 | 5.7 |
Table text extracted from the original PDF; superscript letters are shown inline. The original table image is below.
View original table image
Discussion
The 85.9% drought frequency in the semi-arid zone confirms earlier estimates [10] placing northern East African savannas among the most drought-prone landscapes. The weak SPI-3/PDSI correlation (r = 0.54) means short-term monitoring misses slow-building soil moisture deficits [11] . The strong SPI-3/SPEI-3 agreement may seem to suggest minor temperature effects, but during 2010-2011 and 2016-2017 events, SPEI diverged from SPI by 0.3-0.5 standard deviations in warmer months. Rising temperatures will widen this gap [12] . The composite map's three hotspots fell where rainfall hovers at 400-550 mm/yr-just above the rain-fed cropping threshold. These areas experienced 14-18 consecutive drought months, depleting shallow groundwater [13] . Early warning triggered only at extreme thresholds misses cumulative damage from prolonged moderate drought [14] .
Conclusion
This research demonstrated that single-index monitoring underestimates drought across the East African savanna. No single measure captured all deficit dimensions consistently across three zones. Short-term indices agreed closely but diverged from longer-term measures by margins large enough to mislead early warning. The semi-arid north recorded extreme events at twice the southern frequency. Composite mapping revealed persistent hotspots missed by single-index maps. A multi-index framework tracking precipitation, evaporative demand, and soil moisture at several timescales would strengthen monitoring and improve intervention timing.
Acknowledgement
Acknowledgements Funding SourcesSupported by institutional research allocations for climate
Figures and tables from the paper
References
19 in the original paper- Uhe P, Philip S, Kew S, Shah K, Kimutai J, Mwangi E. Attributing drivers of the 2016 Kenyan drought. International Journal of Climatology. 2018;38(S1):e554-e568.
- Funk C, Dettinger MD, Michaelsen JC, Verdin JP, Brown ME. Warming of the Indian Ocean threatens eastern and southern African food security. Proceedings of the National Academy of Sciences. 2008;105(32):11081-11086.
- Zargar A, Sadiq R, Naser B, Khan FI. A review of drought indices. Environmental Reviews. 2011;19:333349.
- Wilhite DA, Glantz MH. Understanding the drought phenomenon: the role of definitions. Water International. 1985;10(3):111-120.
- Keyantash J, Dracup JA. The quantification of drought: an evaluation of drought indices. Bulletin of the American Meteorological Society. 2002;83(8):11671180.
- McKee TB, Doesken NJ, Kleist J. The relationship of drought frequency and duration to time scales. Proceedings of the 8th Conference on Applied Climatology. 1993;17(22):179-183.
- Palmer WC. Meteorological drought. Research Paper No. 45, US Department of Commerce. 1965;1-58.
- Vicente-Serrano SM, Begueria S, Lopez-Moreno JI. A multiscalar drought index sensitive to global warming. Journal of Climate. 2010;23(7):1696-1718.
- Saji NH, Goswami BN, Vinayachandran PN, Yamagata T. A dipole mode in the tropical Indian Ocean. Nature. 1999;401(6751):360-363.
- Nicholson SE. Climate and climatic variability of rainfall over eastern Africa. Reviews of Geophysics. 2017;55(3):590-635.
- Dai A, Trenberth KE, Qian T. A global dataset of Palmer Drought Severity Index. Journal of Hydrometeorology. 2004;5(6):1117-1130.
- Cook BI, Smerdon JE, Seager R, Coats S. Global warming and 21st century drying. Climate Dynamics. 2014;43(9-10):2607-2627.
- Shukla S, Wood AW. Use of a standardized runoff index for hydrologic drought. Geophysical Research Letters. 2008;35(2):L02405.
- Svoboda M, LeComte D, Hayes M, Heim R, Gleason K. The drought monitor. Bulletin of the American Meteorological Society. 2002;83(8):1181-1190.
- Gebrehiwot T, van der Veen A, Maathuis B. Spatial and temporal assessment of drought in northern Ethiopia. International Journal of Applied Earth Observation. 2011;13(3):309-321.
- Anderson MC, Hain C, Wardlow B, Pimstein A. Evaluation of drought indices based on thermal remote sensing. Journal of Climate. 2011;24(8):2025-2044.
- Masih I, Maskey S, Mussa FEF, Trambauer P. A review of droughts on the African continent. Hydrology and Earth System Sciences. 2014;18(9):3635-3649.
- Lyon B. Seasonal drought in the Greater Horn of Africa during March-May long rains. Journal of Climate. 2014;27(21):7953-7975.
- Haile GG, Tang Q, Sun S, Huang Z, Zhang X. Droughts in East Africa: causes, impacts and resilience. Earth-Science Reviews. 2019;193:146-161.