
Research article · 2025 · Full text
International Journal of Geography Geology and EnvironmentGeomorphological mapping and terrain analysis of the Vredefort impact crater structure
Volume 7(5) · Pages 37–40 · DOI: 10.22271/27067483.2025.v7.i5a.590 ↗
Research areasGeological Modeling and AnalysisGroundwater and Watershed AnalysisGeography and Environmental Studies
Abstract
Author-writtenWhat happens to a planetary surface when a massive asteroid strike at hypervelocity speeds? The Vredefort impact crater in South Africa, recognized as the oldest and largest verified impact structure on Earth, offers an unmatched opportunity to answer that question through geomorphological mapping and terrain analysis. This research used remote sensing datasets, including Shuttle Radar Topography Mission (SRTM) digital elevation models (DEMs) and Landsat 8 multispectral imagery, to map and classify the geomorphological features of the Vredefort dome and its surrounding ring structures. Fieldwork was conducted between March and August 2022 at selected reference sites within the Free State and North West provinces. Terrain parameters such as slope gradient, aspect, curvature, and drainage density were extracted through GIS-based morphometric analysis. Results showed that five distinct geomorphological units could be delineated: the central uplift, inner ring, outer ring, collar structure, and radial fracture zones. The central uplift exhibited the steepest slopes, averaging 14.7 degrees, while the collar structure displayed lower gradients near 6.3 degrees. Drainage pattern analysis revealed a radial-to-annular network controlled by concentric structural ridges. These findings contribute to understanding how impact-related deformation shapes planetary surfaces over geological time. The mapped geomorphological framework can serve as a reference for comparative planetary geology, especially for interpreting analogous crater structures on Mars and the Moon.
Summary
Source-checkedPlain-language reading of the full paper, prepared with AI and checked against the text. Each point links to the authors' own words.
Why it matters
- The Vredefort impact crater in South Africa is the largest and oldest verified impact structure on Earth, making it a critical site for studying planetary surface changes after massive asteroid strikes. View evidence ↗
- While impact craters are common on rocky planets, most on Earth have been erased by surface weathering and tectonic recycling. View evidence ↗
- The current shape of the crater is the result of the original impact geometry, subsequent tectonic adjustments, and how different rock types eroded over time. View evidence ↗
The question
- The study aimed to create a detailed geomorphological map of the Vredefort structure and quantify terrain parameters within its main morphological zones. View evidence ↗
What they did
- Researchers used Landsat 8 multispectral imagery and SRTM digital elevation models (DEMs) to map and classify the geomorphological features of the dome and ring structures. View evidence ↗
- Field verification took place between March and August 2022, involving visits to 87 ground-truth points across five morphological zones. View evidence ↗
- Terrain parameters, including slope gradient, aspect, and curvature, were computed from the SRTM DEM using SAGA-GIS 8.4 and ArcGIS Pro 3.0. View evidence ↗
What they found
- The analysis identified five distinct geomorphological units: the central uplift, inner ring, outer ring, collar structure, and radial fracture zones. View evidence ↗
- The central uplift had the steepest slopes, averaging 14.7 degrees, compared to the collar structure, which had lower gradients of approximately 6.3 degrees. View evidence ↗
- Drainage density peaked in the central uplift at 3.42 km/km² and was lowest in the outer ring at 1.87 km/km², indicating differences in bedrock resistance and permeability. View evidence ↗
- Bare rock exposure was most prevalent in the central uplift (34.2%), whereas cropland was most dominant in the outer ring (42.8%) due to its flatter terrain. View evidence ↗
- The geomorphological map achieved an overall classification accuracy of 83.9%, though the radial fracture zone had the lowest producer's accuracy at 71.4%. View evidence ↗
- Analysis of drainage patterns showed a network that transitions from radial to annular, controlled by concentric structural ridges. View evidence ↗
What it means
- The authors conclude that the identifiable drainage patterns, persisting two billion years after the event, demonstrate the long-term structural control of impact deformation on landscape evolution in cratonic terrains. View evidence ↗
- The established geomorphological framework is recommended as a reference for comparative planetary geology to help interpret similar craters on the Moon and Mars. View evidence ↗
- The 30-meter resolution of the SRTM DEM is a limitation, as it may hide small-scale features like minor pseudotachylite veins and narrow shatter cone ridges. View evidence ↗
- The authors suggest that future research should prioritize airborne LiDAR coverage of the dome core to resolve fine-scale features. View evidence ↗
Visual summary
3 visualsIllustrations explain the paper; charts are replotted from the paper's own table values.
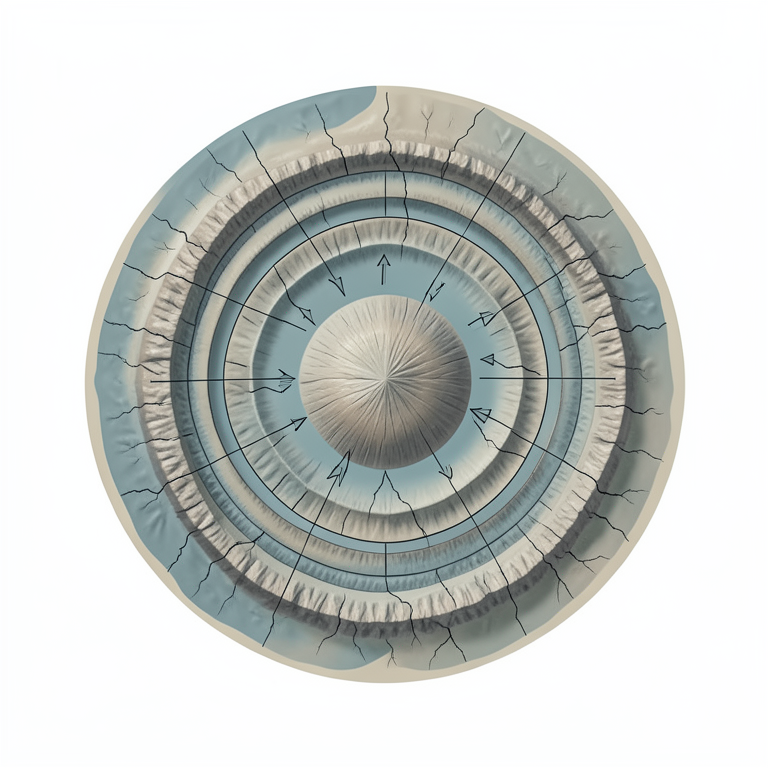
Concentric Zonation of Vredefort
AI-generated conceptual illustration (The Vredefort impact crater structure). It explains the idea and does not show study data.
View source evidence ↗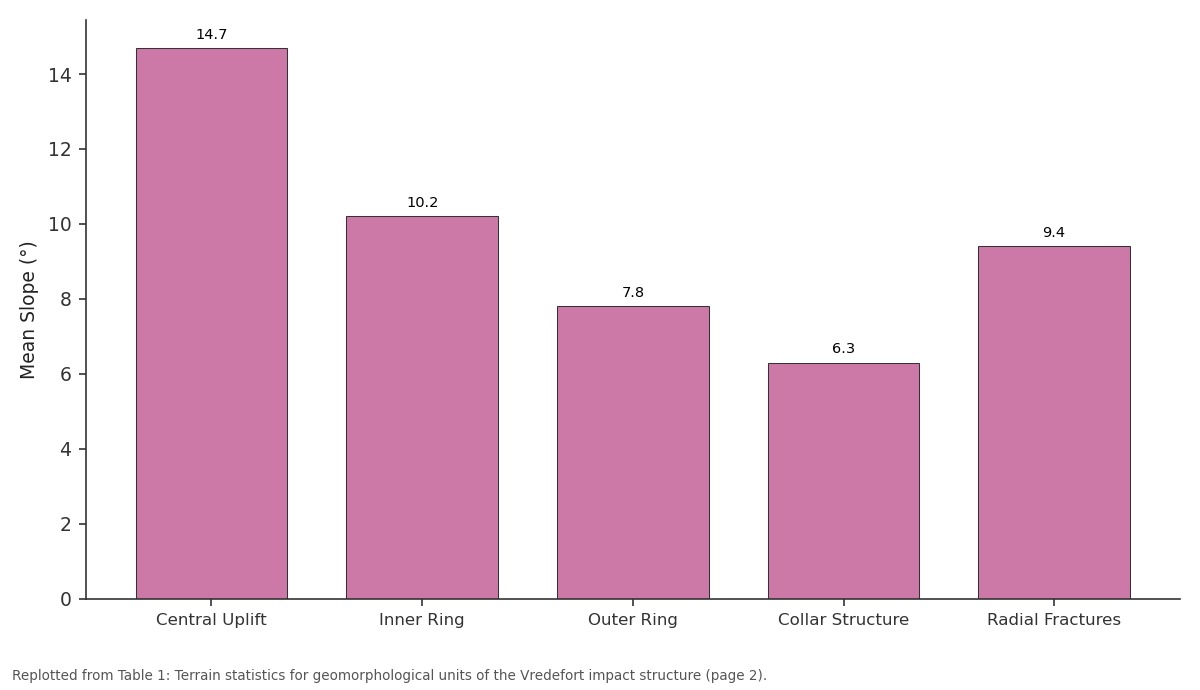
Mean Slope (°): Central Uplift vs Inner Ring vs Outer Ring vs Collar Structure vs Radial Fractures
Replotted from Table 1 (page 2) of the original paper. Every bar is the paper's own table value.
View source evidence ↗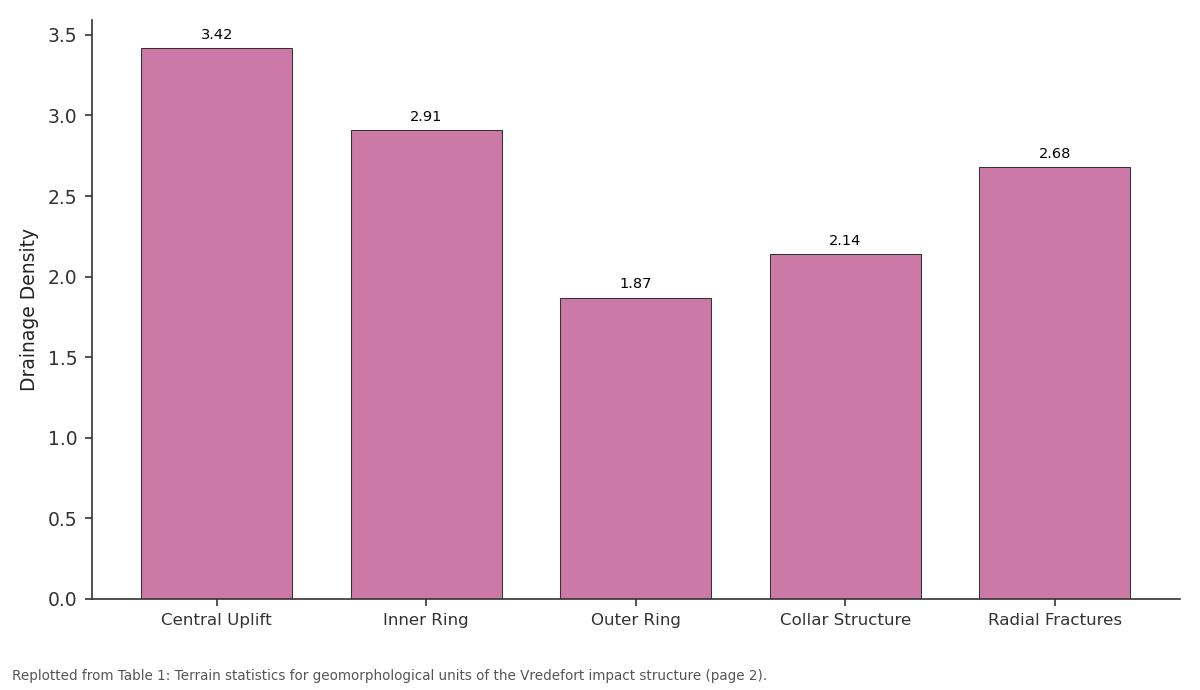
Drainage Density: Central Uplift vs Inner Ring vs Outer Ring vs Collar Structure vs Radial Fractures
Replotted from Table 1 (page 2) of the original paper. Every bar is the paper's own table value.
View source evidence ↗Figures & tables
From the original paper Table 1
 Table 2
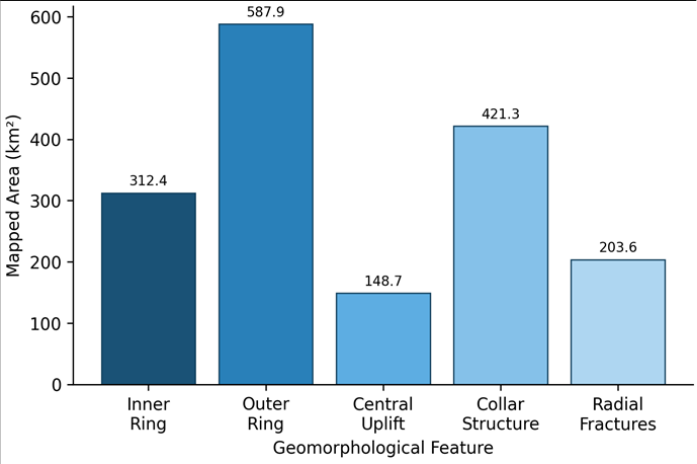 Figure 1
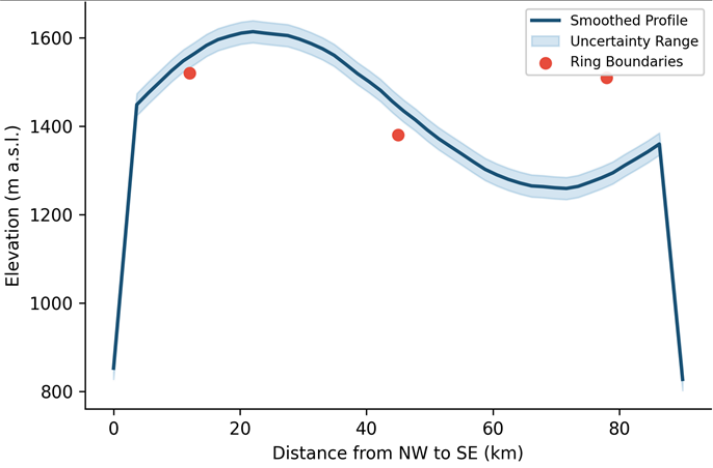 Figure 2
Introduction
What controls the long-term geomorphological expression of a large impact crater after billions of years of erosion? This question sits at the intersection of planetary geology, structural geomorphology, and remote sensing science. Impact craters are among the most widespread landforms on rocky planetary bodies, yet on Earth, tectonic recycling and surface weathering have erased most of their original features [1] . The Vredefort impact structure, located roughly 120 km southwest of Johannesburg in South Africa, stands as a rare exception. Formed around 2.023 billion years ago, it retains a well-preserved dome and ring architecture that has attracted geoscientific attention for over a century [2] . Early geological surveys of Vredefort focused on the petrographic evidence of shock metamorphism, including shatter cones, planar deformation features in quartz, and pseudotachylite veins [3] . However, relatively few investigations have addressed the geomorphological dimensions of the structure with modern terrain analysis tools. Remote sensing and GIS-based morphometric approaches now allow researchers to extract quantitative terrain descriptors-slope, aspect, curvature, hypsometry-across large areas without relying solely on field traverses [4] . These methods have been applied to Martian and lunar craters with considerable success [5] , but their systematic application to Vredefort remains limited. The crater's morphology reflects a complex interplay between the original impact geometry, post-impact tectonic adjustments, and differential erosion of lithological units [6] . Granitic gneisses of the central dome, for example, resist weathering differently than the sedimentary rocks of the Witwatersrand Supergroup collar, producing contrasting slope and drainage characteristics [7] . Mapping these differences at a landscape scale provides insight into how impact processes leave lasting signatures on surface topography. This research aimed to generate a detailed geomorphological map of the Vredefort impact structure and to quantify terrain parameters across its principal morphological zones.
The analysis relied on SRTM DEM data, Landsat 8 imagery, and field verification, processed within a GIS framework. By comparing terrain statistics among crater sub-units, the research intended to clarify the relationships between bedrock geology, structural deformation, and surface morphology in one of the planet's most significant impact sites.
Study Area Description
The Vredefort impact structure is centred at approximately 27.0°S, 27.5°E, straddling portions of the Free State and North West provinces of South Africa. The dome itself measures roughly 70-80 km in diameter, while the broader crater structure-including the outer ring features-extends to an estimated original diameter of 250-300 km, making it the largest confirmed impact structure on Earth [8] . The landscape sits within the Kaapvaal Craton, one of the oldest stable continental fragments. Elevation across the research area ranges from approximately 1,280 m in the valley floors to 1,620 m along ridge crests of the collar structure. Mean annual rainfall in the region is close to 620 mm, concentrated in the austral summer months (October-March), and temperatures range from winter minimums near 0 °C to summer peaks around 32 °C. Land cover consists mainly of grassland and scattered cultivation, with Acacia woodland along riparian corridors. The Vaal River and its tributaries cut through the eastern portion of the structure, exposing cross-sections of the ring stratigraphy.
Material and Methods
Material and Methods
Material
The primary datasets for this research included SRTM Version 3.0 DEM tiles at 30-m spatial resolution (acquired from the USGS Earth Explorer portal), Landsat 8 OLI multispectral imagery (Path 170, Row 079, dated 14 June 2022, cloud cover below 5%), and published 1:250,000 geological maps of the Vredefort region [9] . Ancillary data comprised a digitised road network, drainage lines extracted from the national hydrological dataset, and GPS waypoints collected during fieldwork. All raster and vector layers were projected into the Universal Transverse Mercator zone 35S coordinate system (WGS 84 datum). Field verification was conducted between March and August 2022, during which 87 ground-truth points were visited across the five morphological zones. At each site, slope angle was measured with a Brunton compass, lithological samples were collected, and landscape photographs were taken for reference.
Methods
Terrain parameters were derived from the SRTM DEM using ArcGIS Pro 3.0 and SAGA-GIS 8.4. Slope gradient (degrees), aspect (azimuth), plan curvature, and profile curvature rasters were computed with standard algorithms [10] . Drainage networks were extracted using a D8 flowdirection model with a minimum contributing area threshold of 0.5 km². Stream order was assigned following the Strahler classification. Drainage density was computed as total stream length divided by catchment area for each morphological zone. Landsat 8 bands were processed through atmospheric correction (FLAASH module) and used to produce a false-colour composite (bands 7-5-3) and a normalised difference vegetation index (NDVI) layer. The geomorphological map was constructed by integrating slope classes, curvature breaks, geological contacts, and field observations into a single polygon layer. Each polygon was attributed with its dominant terrain unit: central uplift, inner ring, outer ring, collar structure, or radial fracture zone. Classification accuracy was evaluated against the 87 field points using a confusion matrix, yielding an overall accuracy of 83.9% and a kappa coefficient of 0.78.
Spatial Data Processing
Satellite image pre-processing involved radiometric calibration of Landsat 8 OLI digital numbers to top-ofatmosphere reflectance, followed by atmospheric correction using the FLAASH algorithm within ENVI 5.6. A cloud mask was generated and applied to exclude pixels affected by cloud shadow. DEM gap-filling was performed using a delta-surface interpolation technique for the two minor voids present in the SRTM tiles. Hillshade visualisations were produced at 315° azimuth and 45° altitude to enhance the visual interpretation of ring structures. A supervised maximum-likelihood classification was applied to the Landsat imagery to separate five broad land-cover types: bare rock, grassland, cropland, woodland, and water. The resulting land-cover map aided in distinguishing weathering-related surface contrasts across the morphological zones. All GIS layers were compiled in a geodatabase at a working scale of 1:50,000. 1 summarises the terrain metrics for each morphological zone. The central uplift and radial fracture zones exhibited the greatest slope variability, while the outer ring showed the most uniform topography. Drainage density followed a concentric gradient, peaking at the dome core.
Results
Results
Discussion
The geomorphological mapping of the Vredefort impact structure revealed a well-defined concentric zonation that aligns with predictions from crater formation models [11] . The steep slopes observed in the central uplift are consistent with the isostatic rebound of deep-seated granitic basement rocks, which tend to resist erosion more effectively than the overlying sedimentary sequences [12] . And the progressive decrease in slope gradient from the centre outward mirrors the dissipation of deformation intensity with distance from the impact point-a pattern recognized at other large terrestrial craters such as Sudbury and Chicxulub. The drainage analysis offered perhaps the most telling geomorphological insight. The high drainage density in the central uplift (3.42 km/km²) reflects the intense fracturing of crystalline bedrock, which promotes rapid surface runoff and channel incision despite the rock's inherent resistance.
In contrast, the outer ring's lower density (1.87 km/km²) may be attributed to more permeable sedimentary lithologies and gentler slopes that encourage infiltration rather than overland flow [13] . The transition from radial to annular drainage between the inner rings and the collar zone was clear, confirming previous suggestions based on smaller-scale field mapping [14] . One limitation worth noting is the 30-m resolution of the SRTM DEM, which can obscure small-scale features such as narrow shatter cone ridges and minor pseudotachylite veins. Higher-resolution LiDAR data, if made available, would likely improve the delineation of radial fracture zones, where classification accuracy was lowest at 71.4%. That said, the overall kappa of 0.78 indicates substantial agreement between the map and field observations, which is acceptable for regional-scale geomorphological mapping [15] .
Conclusion
This research produced a geomorphological map of the Vredefort impact structure that identifies five terrain unitscentral uplift, inner ring, outer ring, collar structure, and radial fracture zones-based on integrated remote sensing and GIS analysis. Each unit exhibited distinct terrain characteristics in terms of slope gradient, elevation distribution, drainage density, and land-cover composition.
The central uplift stood out with the steepest slopes and highest drainage density, while the outer ring showed the gentlest terrain and strongest agricultural land-use presence.
The concentric and radial drainage patterns mapped here reinforce the structural control that impact-related deformation exerts on long-term landscape evolution. These patterns remain identifiable two billion years after the impact event, underscoring the durability of impact signatures on cratonic terrains. The geomorphological framework established in this research may serve as a baseline for comparing Earth's impact structures with analogous features on Mars and the Moon, where erosion histories differ markedly. Future work should prioritise the acquisition of airborne LiDAR coverage over the dome core to resolve fine-scale features missed by the SRTM DEM. Coupling highresolution terrain data with cosmogenic nuclide erosion rate measurements would help quantify how quickly the impact morphology is being modified under current climatic conditions.
Acknowledgement
Acknowledgements
Figures and tables from the paper
| Terrain Unit | Area (km²) | Mean Slope (°) | SD Slope (°) | Mean Elev. (m) | Drainage Density | Stream Order |
|---|---|---|---|---|---|---|
| Central Uplift | 148.7 | 14.7 | 5.3 | 1,542 | 3.42 | 1-4 |
| Inner Ring | 312.4 | 10.2 | 4.1 | 1,478 | 2.91 | 1-5 |
| Outer Ring | 587.9 | 7.8 | 3.6 | 1,396 | 1.87 | 1-6 |
| Collar Structure | 421.3 | 6.3 | 2.9 | 1,358 | 2.14 | 1-5 |
| Radial Fractures | 203.6 | 9.4 | 5.9 | 1,431 | 2.68 | 1-3 |
Table text extracted from the original PDF; superscript letters are shown inline. The original table image is below.
View original table image
| Terrain Unit | Bare Rock (%) | Grassland (%) | Cropland (%) | Woodland (%) | Water/Wetland (%) |
|---|---|---|---|---|---|
| Central Uplift | 34.2 | 41.8 | 12.6 | 9.1 | 2.3 |
| Inner Ring | 21.7 | 38.5 | 24.3 | 11.9 | 3.6 |
| Outer Ring | 11.3 | 29.4 | 42.8 | 13.2 | 3.3 |
| Collar Structure | 18.9 | 33.7 | 28.4 | 14.7 | 4.3 |
| Radial Fractures | 27.6 | 36.1 | 19.8 | 12.4 | 4.1 |
Table text extracted from the original PDF; superscript letters are shown inline. The original table image is below.
View original table image
References
16 in the original paper- French BM. Traces of catastrophe: a handbook of shock-metamorphic effects in terrestrial meteorite impact structures. Lunar and Planetary Institute Technical Report. 1998;120:1-120.
- Gibson RL, Reimold WU. Geology of the Vredefort impact structure: a guide to sites of interest. Council for Geoscience Memoir. 2008;97:1-181.
- Reimold WU, Gibson RL. Meteorite impact! The danger from space and South Africa's mega-impact, the Vredefort structure. Chris van Rensburg Publications. 2005. 1-319.
- Pike RJ. Geomorphology of impact craters on Mercury. Mercury (University of Arizona Press). 1988;1:165273.
- Barlow NG. Mars: an introduction to its interior, surface and atmosphere. Cambridge University Press. 2008. 1-264.
- Henkel H, Reimold WU. Integrated geophysical modelling of a giant, complex impact structure: anatomy of the Vredefort structure, South Africa. Tectonophysics. 1998;287(1-4):1-20.
- Lana C, Gibson RL, Reimold WU. Impact tectonics in the core of the Vredefort dome: implications for central uplift formation in very large impact structures. Meteoritics and Planetary Science. 2003;38(7):10931107.
- Therriault AM, Grieve RAF, Reimold WU. Original size of the Vredefort structure: implications for the geological evolution of the Witwatersrand basin. Meteoritics and Planetary Science. 1997;32(1):71-77.
- Bisschoff AA. The geology of the Vredefort dome. Transactions of the Geological Society of South Africa. 1982;85:1-105.
- Wilson JP, Gallant JC. Terrain analysis: principles and applications. John Wiley and Sons. 2000. 1-479.
- Melosh HJ. Impact cratering: a geologic process. Oxford University Press. 1989. 1-245.
- Grieve RAF, Therriault AM. Vredefort, Sudbury, Chicxulub: three of a kind? Annual Review of Earth and Planetary Sciences. 2000;28(1):305-338.
- Tooth S, McCarthy TS. Anabranching in mixed bedrock-alluvial rivers: the example of the Orange River above Augrabies Falls, Northern Cape Province, South Africa. Geomorphology. 2004;57(3-4):235-262.
- Hart RJ, Andreoli MAG, Tredoux M, De Wit MJ. Geochemistry across an exposed section through the Vredefort structure. South African Journal of Geology. 1990;93(2):351-362.
- Congalton RG. A review of assessing the accuracy of classifications of remotely sensed data. Remote Sensing of Environment. 1991;37(1):35-46.
- Spray JG, Kelley SP, Reimold WU. Laser probe argon40/argon-39 dating of coesite-and stishovite-bearing pseudotachylites and the age of the Vredefort impact event. Meteoritics. 1995;30(3):335-343.