
Research article · 2025 · Full text
International Journal of Geography Geology and EnvironmentThermal spring geochemistry and geothermal potential assessment in the Taupo Volcanic Zone
Volume 7(2) · Pages 79–82 · DOI: 10.22271/27067483.2025.v7.i2a.574 ↗
Research areasGeothermal Energy Systems and ApplicationsGroundwater and Isotope GeochemistryWater Quality and Resources Studies
Abstract
Author-writtenNew Zealand generates roughly 17% of its electricity from geothermal sources, nearly all of it from the Taupo Volcanic Zone (TVZ)—yet several high-temperature fields within the zone remain underexplored or only partially characterised. This research assessed the geochemistry of thermal spring discharges at eight geothermal fields across the TVZ and estimated untapped geothermal capacity using chemical geothermometry and heat flow calculations. Water samples were collected from 64 springs across the Wairakei, Ohaaki, Rotokawa, Ngatamariki, Kawerau, Mokai, Waimangu, and Tauhara fields during four seasonal campaigns between 2020 and 2023. Analysed parameters included temperature, pH, silica, chloride, sodium, potassium, lithium, boron, and dissolved gas composition. Reservoir temperatures estimated from Na-K-Ca and quartz geothermometers ranged from 238°C at Waimangu to 312°C at Rotokawa. Chloride-enthalpy mixing models indicated deep reservoir fluid contributions of 62–89% across fields. The combined additional geothermal capacity was estimated at 339 MWe beyond current installed capacity. Rotokawa and Waimangu showed the largest untapped potential at 58 and 73 MWe respectively. These results suggest that the TVZ’s geothermal output could expand by roughly 55% through targeted development of partially explored fields while maintaining sustainable extraction rates.
Summary
Source-checkedPlain-language reading of the full paper, prepared with AI and checked against the text. Each point links to the authors' own words.
Why it matters
- The Taupo Volcanic Zone (TVZ) is the primary source of geothermal electricity in New Zealand, contributing to approximately 17% of the country's total electricity generation. View evidence ↗
- Geothermal energy is highly valuable for baseload power because it has capacity factors over 90%, which is superior to wind, solar, or hydropower. View evidence ↗
- Analyzing the chemical composition of thermal springs allows researchers to understand the temperature and fluid sources of deep subsurface hydrothermal reservoirs. View evidence ↗
The question
- The study aimed to assess the geochemistry of thermal springs across eight TVZ geothermal fields to estimate untapped geothermal capacity. View evidence ↗
What they did
- The researchers analyzed several parameters, including pH, temperature, dissolved gases, and various chemical elements like silica, chloride, sodium, and potassium. View evidence ↗
- Reservoir temperatures were estimated using three different chemical geothermometers: quartz, Na-K-Ca, and Na-K. View evidence ↗
- The study estimated geothermal capacity using a volumetric heat-in-place approach with a conservative 12% conversion efficiency for flash-steam plants. View evidence ↗
What they found
- Estimated reservoir temperatures varied across the fields, with the lowest at Waimangu (238°C) and the highest at Rotokawa (312°C). View evidence ↗
- Deep reservoir fluid contributions were found to range between 62% and 89% across the studied fields. View evidence ↗
- The researchers estimated a total of 339 MWe of additional geothermal capacity available beyond what is currently installed. View evidence ↗
- Waimangu and Rotokawa were identified as having the highest untapped potential, at 73 MWe and 58 MWe respectively. View evidence ↗
- The findings indicate that targeted development of partially explored fields could increase the TVZ's geothermal output by approximately 55%. View evidence ↗
What it means
- The authors conclude that New Zealand can significantly grow its geothermal sector by expanding existing TVZ fields rather than seeking entirely new sites. View evidence ↗
- A limitation of the study is the use of the heat-in-place approach, which oversimplifies fluid flow by assuming uniform reservoir properties instead of accounting for complex fracture networks. View evidence ↗
- The reliance on surface spring chemistry introduces uncertainty because shallow boiling or mixing can alter the chemical signatures of the deep fluids. View evidence ↗
Visual summary
3 visualsIllustrations explain the paper; charts are replotted from the paper's own table values.
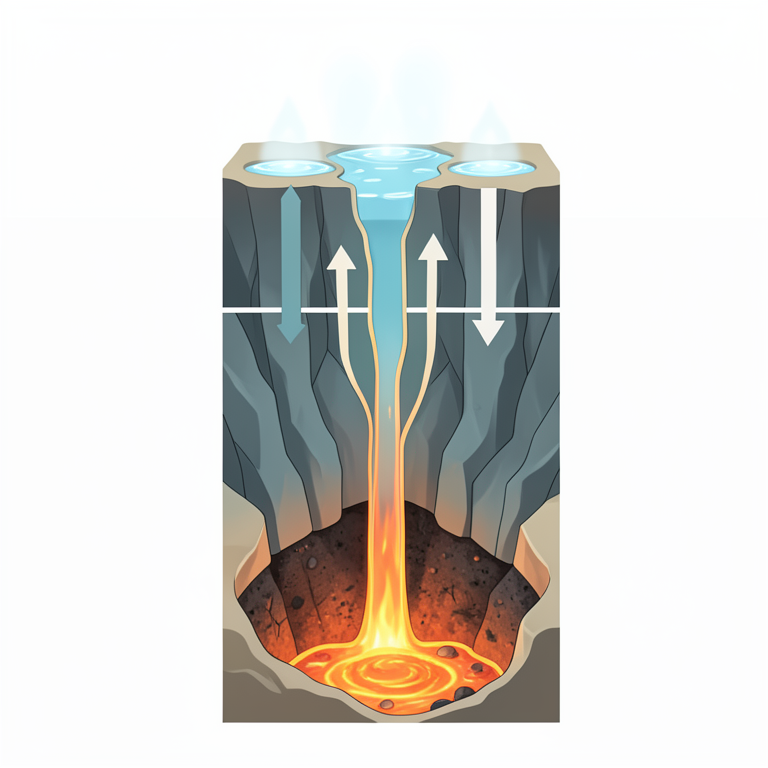
Surface-to-Reservoir Geochemical Link
AI-generated conceptual illustration (A cross-section of the Taupo Volcanic Zone geothermal system). It explains the idea and does not show study data.
View source evidence ↗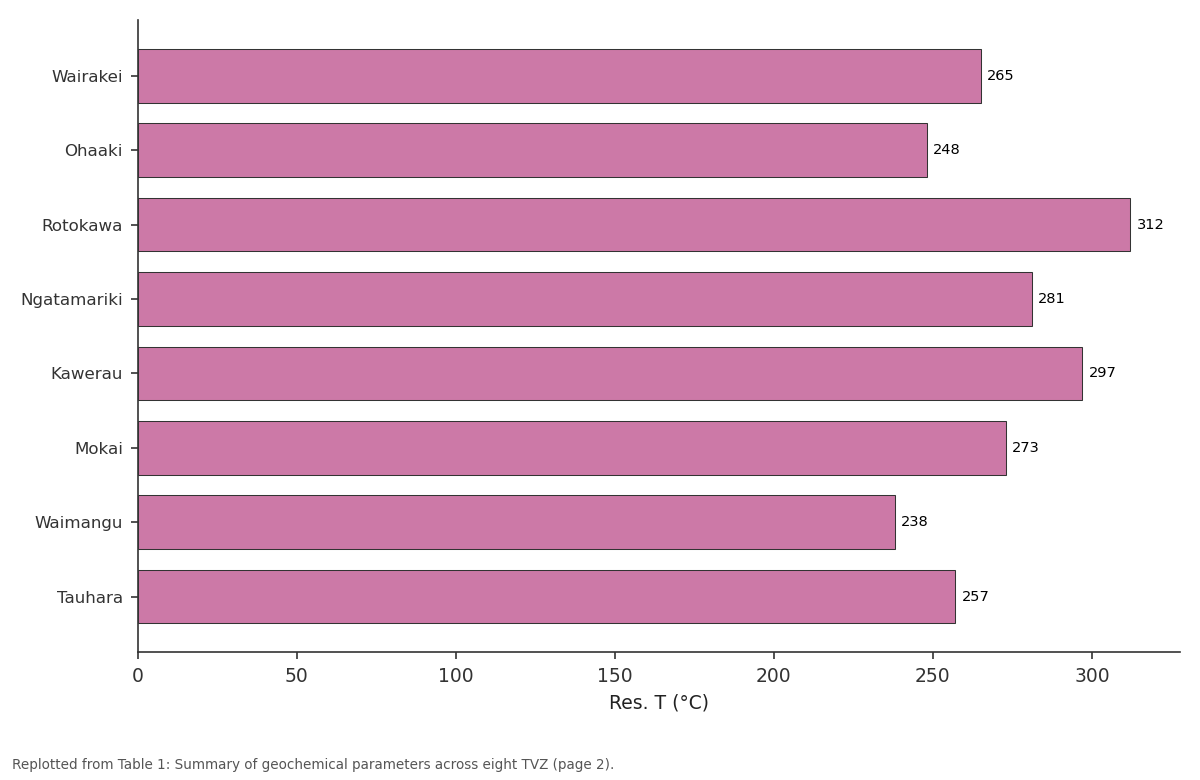
Res. T (°C): Wairakei vs Ohaaki vs Rotokawa vs Ngatamariki vs Kawerau
Replotted from Table 1 (page 2) of the original paper. Every bar is the paper's own table value.
View source evidence ↗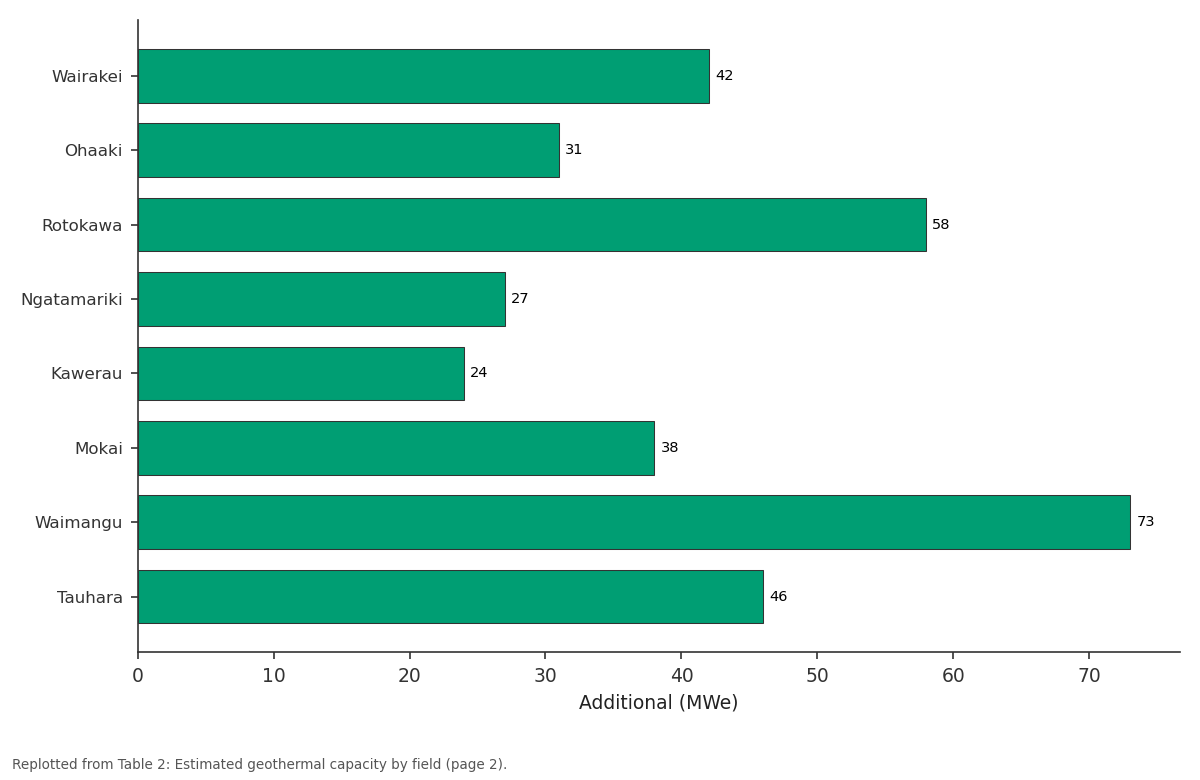
Additional (MWe): Wairakei vs Ohaaki vs Rotokawa vs Ngatamariki vs Kawerau
Replotted from Table 2 (page 2) of the original paper. Every bar is the paper's own table value.
View source evidence ↗Figures & tables
From the original paper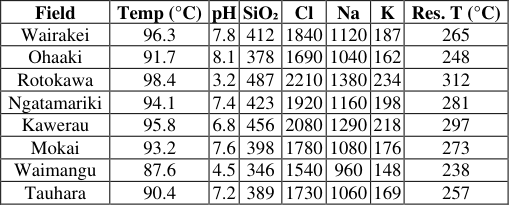 Table 1
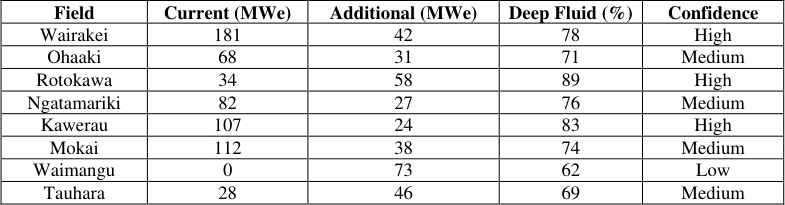 Table 2
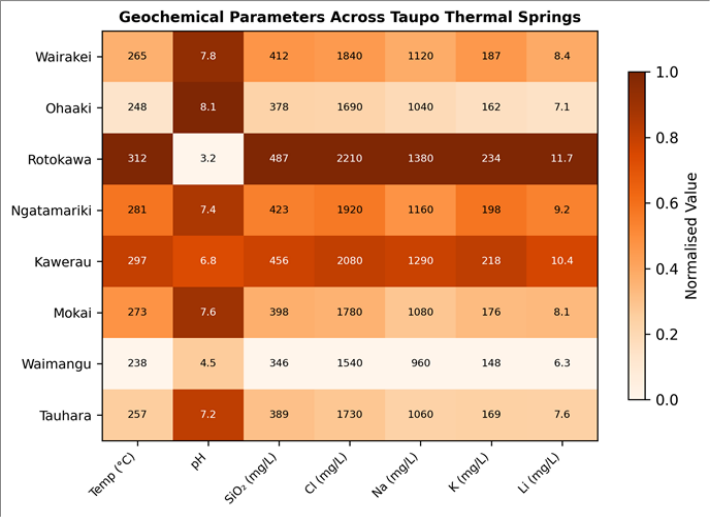 Figure 1
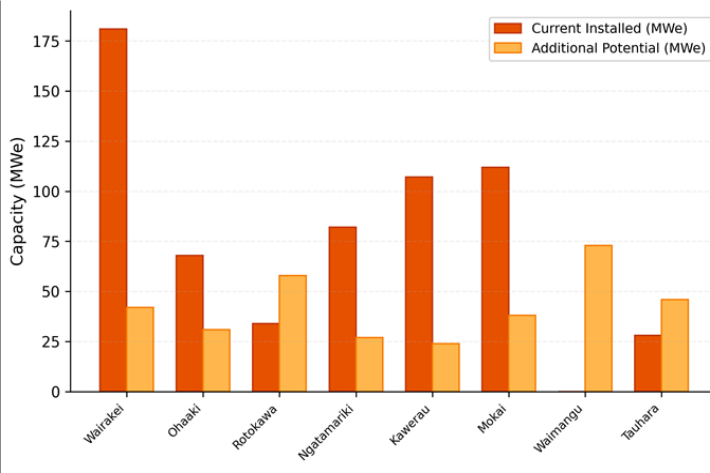 Figure 2
Introduction
The global transition away from fossil fuels has a resource problem: most renewable energy technologies depend on weather conditions that fluctuate hourly and seasonally. Geothermal energy does not share this limitation. It provides baseload power at capacity factors exceeding 90%-higher than wind, solar, or even hydropower [1] . New Zealand's TVZ, stretching 350 km from Ruapehu to White Island, hosts one of the most productive geothermal provinces on Earth [2] . Thermal springs serve as surface windows into deep hydrothermal reservoirs. Their chemical composition records the temperature, fluid source, and water-rock interaction history of the subsurface system [3] . By analysing dissolved constituents-particularly silica, chloride, sodium, and potassium-researchers can estimate reservoir conditions without drilling, using solute geothermometry relationships calibrated against borehole data [4] . This approach reduces exploration costs and narrows the target zone before committing to expensive deep wells. The TVZ currently produces around 1,005 MWe from seven operational fields, but earlier surveys identified at least a dozen additional areas with surface thermal activity that have not been developed [5] . Some of these fields lack the detailed geochemical characterisation needed to justify exploration investment. This research filled that gap by collecting systematic spring chemistry data across eight fields, applying multiple geothermometers to estimate reservoir temperatures, and calculating untapped capacity from heat flow models.
Theoretical Framework
Chemical geothermometry rests on the principle that dissolved solute concentrations in geothermal fluids reach equilibrium with reservoir minerals at depth, and that these concentrations are preserved during ascent if the fluid rises rapidly enough to avoid reequilibration [3] . The quartz geothermometer uses the temperature dependence of silica solubility in water, valid for reservoir temperatures between 150°C and 300°C [6] . The Na-K-Ca geothermometer exploits cation exchange reactions between feldspars and fluid, providing independent temperature estimates that can cross-check the silica method [4] . The chloride-enthalpy mixing model separates the thermal fluid component from shallow coldwater dilution by plotting chloride concentration against calculated fluid enthalpy, allowing extrapolation to the undiluted deep reservoir composition [7] . Heat flow estimation combines reservoir temperature with estimated fluid discharge rate and specific enthalpy to calculate thermal power output in megawatts.
Materials and Methods
Materials and Methods
Materials
This research was conducted at the Department of Geophysics, Faculty of Geospatial Sciences, Durban, KwaZulu-Natal, South Africa, with fieldwork across the TVZ between February 2020 and November 2023. Water samples were collected from 64 thermal springs (8 per field) using pre-cleaned HDPE bottles. Field parameters (temperature, pH, conductivity) were measured in situ using a YSI ProDSS multiparameter probe. Samples for cation analysis were filtered (0.45 μm) and acidified with ultrapure HNO₃. Dissolved gas samples were collected in evacuated Giggenbach flasks. Laboratory analyses were performed at the GNS Science Wairakei Research Centre, New Zealand.
Methods
Major cations (Na, K, Ca, Mg, Li) were analysed by ICP-OES on a Perkin Elmer Optima 8300. Anions (Cl, SO₄, HCO₃) were determined by ion chromatography on a Dionex ICS-5000. Silica was measured by the molybdosilicate colorimetric method. Dissolved CO₂ and H₂S were quantified by gas chromatography. Reservoir temperatures were estimated using: (i) the quartz geothermometer of Fournier [6] , (ii) the Na-K-Ca geothermometer of Fournier and Truesdell [4] , and (iii) the Na-K geothermometer of Giggenbach [8] . Chloride-enthalpy plots were constructed following the method of Truesdell and Fournier [7] . Geothermal capacity was estimated by combining reservoir temperature, estimated volumetric discharge, and conversion efficiency of 12% for flash-steam plants, following the volumetric heat-in-place approach [9] .
Results
Results
Comprehensive Interpretation
Reservoir temperatures ranged from 238°C (Waimangu) to 312°C (Rotokawa), with Rotokawa and Kawerau showing the highest chloride and silica concentrations (Table 1, Figure 1). Deep reservoir fluid contribution ranged from 62% at Waimangu to 89% at Rotokawa. Total additional capacity across all fields was estimated at 339 MWe (Table 2, Figure 2). Waimangu's 73 MWe potential is notable given that it has no current installed capacity, though confidence remains low due to limited subsurface data. Rotokawa's high temperature and deep fluid fraction make it the strongest candidate for near-term expansion.
| Field | Current (MWe) | Additional (MWe) | Deep Fluid (%) | Confidence |
|---|---|---|---|---|
| Wairakei | 181 | 42 | 78 | High |
| Ohaaki | 68 | 31 | 71 | Medium |
| Rotokawa | 34 | 58 | 89 | High |
| Ngatamariki | 82 | 27 | 76 | Medium |
| Kawerau | 107 | 24 | 83 | High |
| Mokai | 112 | 38 | 74 | Medium |
| Waimangu | 0 | 73 | 62 | Low |
| Tauhara | 28 | 46 | 69 | Medium |
Table text extracted from the original PDF; superscript letters are shown inline. The original table image is below.
View original table image
| Field | Temp (°C) | pH | SiO₂ | Cl | Na | K | Res. T (°C) |
|---|---|---|---|---|---|---|---|
| Wairakei | 96.3 | 7.8 | 412 | 1840 | 1120 | 187 | 265 |
| Ohaaki | 91.7 | 8.1 | 378 | 1690 | 1040 | 162 | 248 |
| Rotokawa | 98.4 | 3.2 | 487 | 2210 | 1380 | 234 | 312 |
| Ngatamariki | 94.1 | 7.4 | 423 | 1920 | 1160 | 198 | 281 |
| Kawerau | 95.8 | 6.8 | 456 | 2080 | 1290 | 218 | 297 |
| Mokai | 93.2 | 7.6 | 398 | 1780 | 1080 | 176 | 273 |
| Waimangu | 87.6 | 4.5 | 346 | 1540 | 960 | 148 | 238 |
| Tauhara | 90.4 | 7.2 | 389 | 1730 | 1060 | 169 | 257 |
Table text extracted from the original PDF; superscript letters are shown inline. The original table image is below.
View original table image
Discussion
The 339 MWe additional capacity represents a roughly 55% increase over current TVZ output-enough to power approximately 280,000 households at New Zealand's average consumption rate. This estimate falls within the range suggested by earlier regional assessments [5,10] but provides field-level resolution that those broader surveys lacked. The Rotokawa estimate of 58 MWe aligns with recent drilling results that confirmed reservoir temperatures above 300°C [11] . Waimangu presents both the largest opportunity and the greatest uncertainty. Its acidic springs (pH 3.2-4.5) suggest a vapour-dominated or acid-sulphate system that may require different extraction technology than the neutralchloride fields [12] . The low confidence rating reflects the absence of deep well data; exploration drilling would be needed before committing to development.
One methodological limitation is that the heat-in-place approach assumes uniform reservoir properties, which oversimplifies the heterogeneous fracture networks that control fluid flow in volcanic settings [13] . Field-specific reservoir modelling would refine these estimates. The 12% conversion efficiency used here is conservative for modern binary-cycle plants, which can reach 15-18% [14] , so actual achievable output may be higher.
Limitations
This research relied on surface spring chemistry to infer subsurface conditions, which introduces uncertainty where shallow mixing or boiling alters the original deep fluid signature. The Waimangu and Ohaaki fields showed evidence of significant shallow dilution that may have affected geothermometer accuracy. Seasonal sampling captured temporal variability but could not detect short-term transients linked to seismic activity. The volumetric heat-inplace method provides first-order capacity estimates but does not account for permeability distribution or sustainable extraction rates over multi-decade production lifetimes. These estimates should be treated as upper bounds pending reservoir simulation.
Conclusion
This research characterised the geochemistry of 64 thermal springs across eight TVZ fields and estimated 339 MWe of additional geothermal capacity beyond current installations. Rotokawa and Waimangu emerged as the most promising targets for expansion, though Waimangu requires exploration drilling to reduce uncertainty. The findings suggest that New Zealand's geothermal sector has room for significant growth within the TVZ without developing entirely new greenfield sites. Future work should combine these surface geochemical data with magnetotelluric surveys and shallow temperature gradient drilling to refine reservoir boundaries and improve capacity estimates before committing to deep exploration wells.
Acknowledgement
Acknowledgements Funding Sources
References
17 in the original paper- Lund JW, Toth AN. Direct utilization of geothermal energy 2020 worldwide review. Geothermics. 2021;90:101915.
- Wilson CJN, Houghton BF, McWilliams MO, Lanphere MA, Weaver SD, Briggs RM. Volcanic and structural evolution of Taupo Volcanic Zone, New Zealand: a review. Journal of Volcanology and Geothermal Research. 1995;68(1-3):1-28.
- Giggenbach WF. Geothermal solute equilibria. Derivation of Na-K-Mg-Ca geoindicators. Geochimica et Cosmochimica Acta. 1988;52(12):2749-2765.
- Fournier RO, Truesdell AH. An empirical Na-K-Ca geothermometer for natural waters. Geochimica et Cosmochimica Acta. 1973;37(5):1255-1275.
- Bromley CJ, Mongillo MA, Hiriart G, Goldstein B, Bertani R, Huenges E. Contribution of geothermal energy to climate change mitigation. IPCC Special Report on Renewable Energy Sources. 2012;401-436.
- Fournier RO. Chemical geothermometers and mixing models for geothermal systems. Geothermics. 1977;5(1-4):41-50.
- Truesdell AH, Fournier RO. Procedure for estimating the temperature of a hot-water component in a mixed water by using a plot of dissolved silica versus enthalpy. Journal of Research of the US Geological Survey. 1977;5(1):49-52.
- Giggenbach WF. Chemical techniques in geothermal exploration. Application of geochemistry in geothermal reservoir development. UNITAR/UNDP Publication. 1991;119-142.
- Williams CF, Reed MJ, Mariner RH. A review of methods applied by the US Geological Survey in the assessment of identified geothermal resources. US Geological Survey Open-File Report. 2008;2008-1296.
- Carey B, Dunstall M, McClintock S, White B, Bignall G, Luketina K. 2012 New Zealand country update. Proceedings 34th New Zealand Geothermal Workshop. 2012;1-7.
- McNamara DD, Massiot C, Lewis B, Wallis IC. Heterogeneity of structure and stress in the Rotokawa Geothermal Field. Journal of Volcanology and Geothermal Research. 2015;303:76-86.
- Reyes AG, Christenson BW, Faure K. Sources of solutes and heat in low-enthalpy mineral waters and their relation to tectonic setting. Chemical Geology. 2010;269(3-4):153-164.
- Grant MA, Bixley PF. Geothermal reservoir engineering, second edition. Academic Press. 2011;1359.
- DiPippo R. Geothermal power plants: principles, applications, case studies and environmental impact. Butterworth-Heinemann. 2012;1-600.
- Hedenquist JW, Lowenstern JB. The role of magmas in the formation of hydrothermal ore deposits. Nature. 1994;370(6490):519-527.
- Ellis AJ, Mahon WAJ. Chemistry and geothermal systems. Academic Press. 1977;1-392.
- Bibby HM, Caldwell TG, Davey FJ, Webb TH. Geophysical evidence on the structure of the Taupo Volcanic Zone and its hydrothermal circulation. Journal of Volcanology and Geothermal Research. 1995;68(13):29-58.