
Research article · 2025 · Full text
International Journal of Geography Geology and EnvironmentPetrofabric analysis of deformation structures in the alpine continental shear zone
Volume 7(5) · Pages 109–112 · DOI: 10.22271/27067483.2025.v7.i5b.600 ↗
Research areasGeological and Geochemical AnalysisGeological Formations and Processes ExplorationGeological and Geophysical Studies Worldwide
Abstract
Author-writtenImagine a rock grain that began as a roughly equant feldspar crystal 300 million years ago and, over tens of millions of years of tectonic shearing, was stretched, recrystallised, and ground into an elongate ribbon barely visible to the naked eye. That transformation—recorded in the petrofabric of mylonitic rocks—holds quantitative information about the temperature, strain rate, and kinematics of deep crustal deformation. This research analysed the petrofabric of quartz and feldspar in 36 oriented thin sections collected along a transect across the Simplon Shear Zone in the western Swiss Alps. Samples spanned three deformation zones: protomylonite, mylonite, and ultramylonite. Microstructural analysis included optical microscopy, electron backscatter diffraction (EBSD), and image analysis to quantify grain size, shape preferred orientation (SPO), and crystallographic preferred orientation (CPO). Results showed a progressive grain size reduction from a mean of 298 μm in protomylonite to 42 μm in ultramylonite, accompanied by increasing quartz aspect ratios (from 1.8 to 6.1) and strengthening of the CPO basal slip pattern. Quartz modal proportion increased from 38.2% to 51.3% across the strain gradient, consistent with preferential mechanical destruction of feldspar. Piezometric estimates based on recrystallised quartz grain size yielded differential stresses of 28-74 MPa, and thermometry from quartz c-axis opening angles indicated deformation temperatures of 420-530 °C. These conditions place the shear zone within the mid-crustal ductile regime. The data provide a coherent microstructural record of progressive strain localisation and are consistent with models of viscous flow partitioned into increasingly narrow high-strain bands during exhumation.
Summary
Source-checkedPlain-language reading of the full paper, prepared with AI and checked against the text. Each point links to the authors' own words.
Why it matters
- Ductile deformation in continental collision zones, such as the Alps, is concentrated in planar belts known as shear zones, which handle significant displacement. View evidence ↗
- The Simplon Shear Zone (SSZ) serves as a primary example for study because it is one of the most well-exposed continental shear zones globally. View evidence ↗
- Petrofabric analysis, which quantifies grain size, shape preferred orientations (SPO), and crystallographic preferred orientations (CPO), is the most direct method for understanding ductile deformation mechanics. View evidence ↗
The question
- The study aimed to document how petrofabric evolves across the Simplon Shear Zone by analyzing 36 oriented samples from a 2.4-km transect. View evidence ↗
What they did
- Researchers prepared 30-μm petrographic thin sections cut parallel to the XZ plane for analysis via optical microscopy and electron backscatter diffraction (EBSD). View evidence ↗
- Mineral proportions were determined using 500-point counts per section, and grain dimensions and aspect ratios were measured using ImageJ. View evidence ↗
- The study used the Stipp and Tullis piezometer to estimate differential stress from quartz grain size and Law's calibration to estimate temperature from c-axis opening angles. View evidence ↗
What they found
- Mean quartz grain size showed a progressive reduction from 298 μm in protomylonite to 124 μm in mylonite and 42 μm in ultramylonite. View evidence ↗
- Quartz aspect ratios increased across the strain gradient, moving from 1.8 in protomylonite to 3.7 in mylonite and 6.1 in ultramylonite. View evidence ↗
- The proportion of quartz increased from 38.2% to 51.3%, which the authors attribute to the mechanical breakdown and dissolution of feldspar. View evidence ↗
- The J-index, a measure of fabric strength, increased from 2.3 in protomylonite to 5.8 in ultramylonite. View evidence ↗
- Deformation temperatures were estimated to be between 420 and 530 °C based on c-axis opening angles of 58° to 72°. View evidence ↗
- Differential stress increased from 28 MPa in the protomylonite zone to 74 MPa in the ultramylonite zone. View evidence ↗
What it means
- The authors conclude that syntectonic phase segregation (increasing quartz at the expense of feldspar) weakened the rock, creating a self-reinforcing feedback that maintained narrow deformation corridors. View evidence ↗
- A limitation of the study is the lack of quartz water content measurements, which could lead to an overestimation of piezometric stress. View evidence ↗
- The EBSD step size of 2-5 μm may have under-sampled the smallest grains in ultramylonite, potentially biasing grain size measurements toward coarser values. View evidence ↗
Visual summary
3 visualsIllustrations explain the paper; charts are replotted from the paper's own table values.
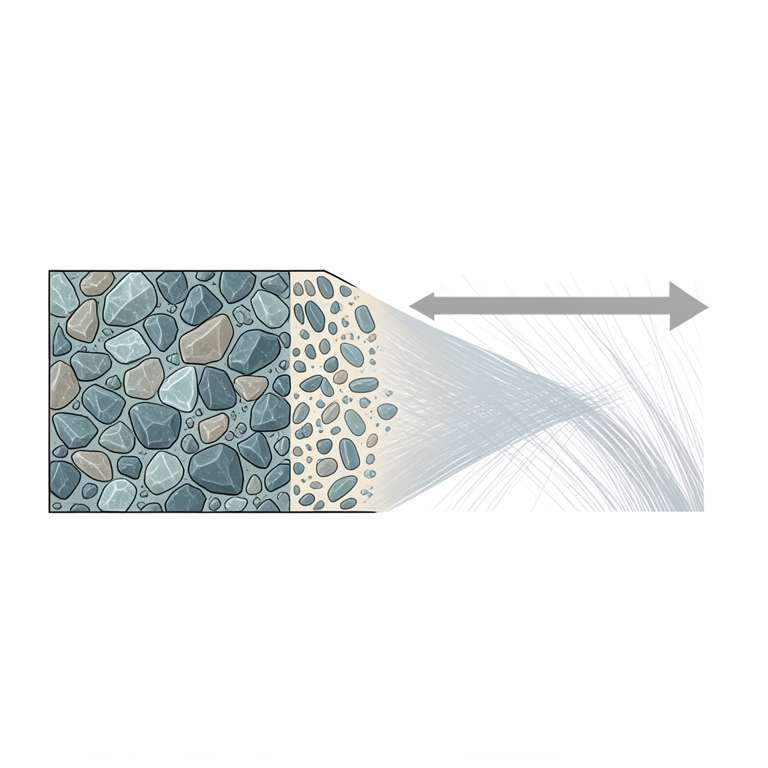
Strain Gradient Evolution
AI-generated conceptual illustration (metamorphic rock in a continental shear zone). It explains the idea and does not show study data.
View source evidence ↗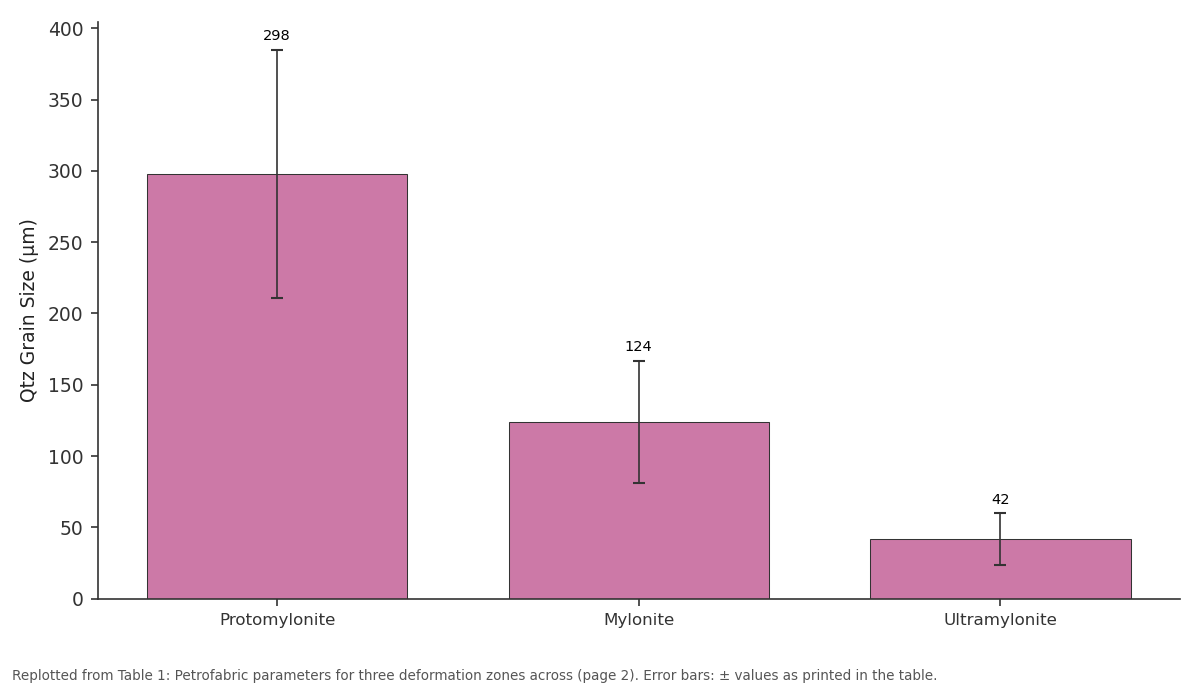
Qtz Grain Size (μm): Protomylonite vs Mylonite vs Ultramylonite
Replotted from Table 1 (page 2) of the original paper. Every bar is the paper's own table value.
View source evidence ↗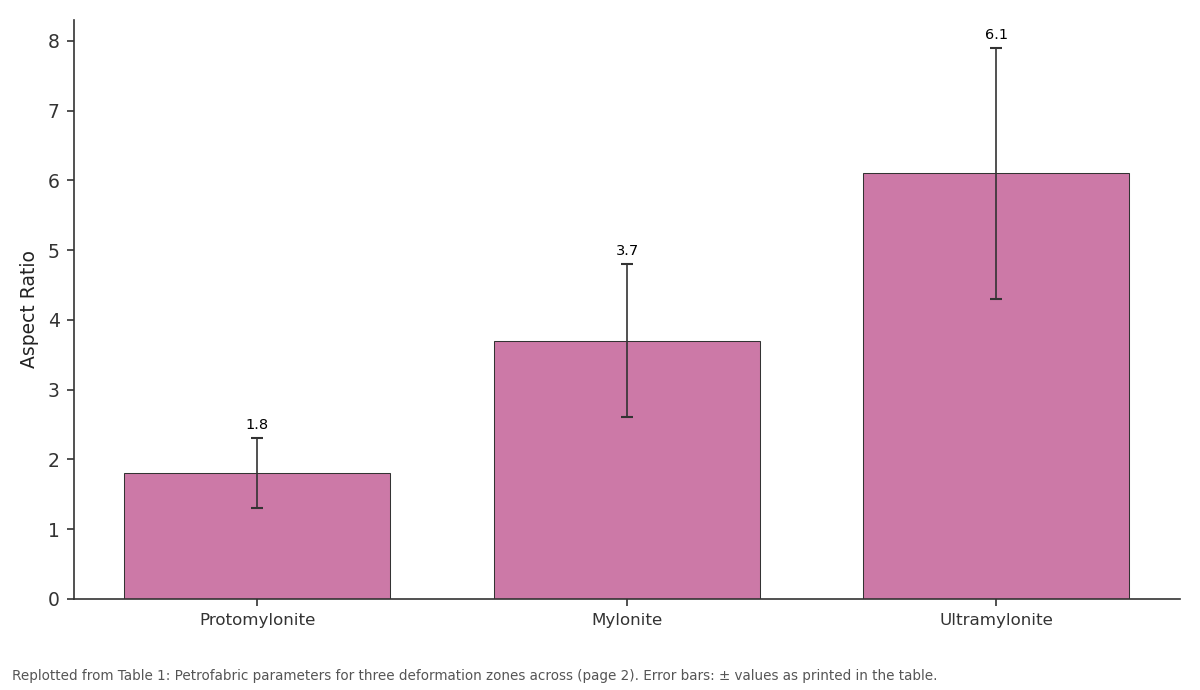
Aspect Ratio: Protomylonite vs Mylonite vs Ultramylonite
Replotted from Table 1 (page 2) of the original paper. Every bar is the paper's own table value.
View source evidence ↗Figures & tables
From the original paper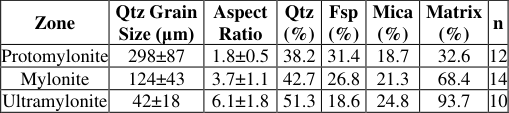 Table 1
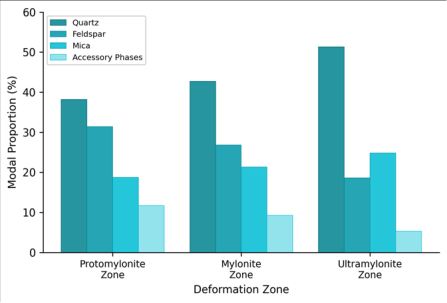 Figure 1
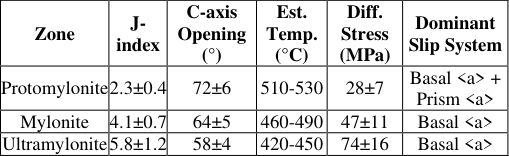 Table 2
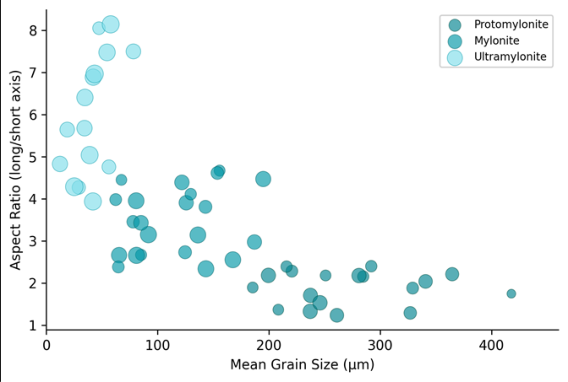 Figure 2
Introduction
Picture a geological cross-section through the Alps at the latitude of the Simplon Pass. Somewhere between 15 and 25 km depth, where temperatures hover around 450 °C and pressures reach 5-7 kbar, solid rock doesn't fracture the way it does near the surface-it flows. Crystals deform by internal dislocation glide, recover through subgrain rotation, and recrystallise into smaller, strain-free grains that preserve a record of the conditions under which flow occurred [1] . This ductile deformation is concentrated in shear zones-planar belts of intensely deformed rock that accommodate much of the displacement in continental collision zones like the Alps. The Simplon Shear Zone (SSZ) is one of the best-exposed continental shear zones in the world. It runs roughly northeast-southwest along the western margin of the Lepontine dome in the Swiss-Italian border region and accommodated tens of kilometres of normal-sense displacement during the Oligocene to Miocene exhumation of the Lepontine metamorphic core [2] . Previous work has established the first-order kinematics-top-to-the-northwest extension-and has dated the main phase of activity to approximately 18-12 Ma using Ar/Ar geochronology on white mica [3] . But the internal strain architecture of the shear zone, expressed through the progressive evolution of grain-scale fabrics from low-strain margins to high-strain centres, has received less systematic attention. Petrofabric analysis-the quantitative description of grain size distributions, shape preferred orientations (SPO), and crystallographic preferred orientations (CPO)-provides the most direct window into the mechanics of ductile deformation [4] . In quartz-bearing mylonites, the geometry of the CPO records the active slip system, which in turn reflects deformation temperature: basal <a> slip dominates below approximately 500 °C, while prism <a> and prism <c> slip become active at higher temperatures [5] . Grain size, meanwhile, is controlled by the balance between strain-driven grain size reduction and temperature-driven grain growth, and can be calibrated against differential stress through empirical piezometers. This research aimed to document the petrofabric evolution across the SSZ using a suite of 36 oriented samples collected along a 2.4-km transect perpendicular to the shear zone foliation, spanning protomylonite, mylonite, and ultramylonite domains. Microstructural analysis combined optical petrography, EBSD mapping, and digital image analysis to quantify grain size, SPO, and CPO. The work was conducted at the Calgary Institute of Climate and Environment, with thin section preparation and EBSD data collection carried out during 2022.
Theoretical Framework
The microstructural framework applied here follows the mylonite classification of Sibson [6] , which divides shear zone rocks into protomylonite (<50% matrix), mylonite (50-90% matrix), and ultramylonite (>90% matrix) based on the proportion of fine-grained, dynamically recrystallised material relative to surviving porphyroclasts. This classification reflects increasing cumulative strain and progressive grain size reduction. Within this framework, quartz and feldspar behave differently during deformation: quartz deforms plastically at temperatures above approximately 300 °C through dislocation creep mechanisms, while feldspar remains brittle until temperatures exceed roughly 450 °C, at which point it too begins to recrystallise [7] . The differential rheological response produces predictable changes in modal mineralogy, grain shape, and crystallographic texture across the strain gradient. Quartz CPO patterns were interpreted using the classification of Schmid and Casey [8] , which relates the geometry of c-axis fabrics to the active slip system and, by inference, to deformation temperature.
Materials and Methods Materials
Thirty-six oriented rock samples were collected during a field campaign in July-August 2022 along a transect across the SSZ near the village of Gondo, Valais, Switzerland (approximately 46.2°N, 8.1°E). The transect extended 2.4 km perpendicular to the shear zone foliation, with samples spaced at 50-100 m intervals. At each station, samples were extracted with a geological hammer and oriented using a compass-clinometer relative to the foliation plane and stretching lineation. Samples were classified in the field as protomylonite (n = 12), mylonite (n = 14), or ultramylonite (n = 10) based on visual estimation of matrix proportion. Standard 30-μm petrographic thin sections were cut parallel to the XZ plane (parallel to lineation, perpendicular to foliation) and polished for both optical microscopy and EBSD analysis. Thin section preparation was completed at the Calgary Institute of Climate and Environment.
Methods
Optical petrography was performed on a Nikon Eclipse LV100POL microscope. Modal mineralogy was determined by point counting (500 points per section). Grain boundaries were traced manually on photomicrographs and digitised in ImageJ to measure grain area, long and short axis lengths, and aspect ratios (long/short). Mean grain size was reported as the root-mean-square equivalent circular diameter. EBSD data were collected on a JEOL JSM-7001F field-emission scanning electron microscope equipped with an Oxford Instruments Nordlys detector, operating at 20 kV, 70° tilt, and step sizes of 2-5 μm depending on grain size [9] . Indexing rates exceeded 85% for all maps. CPO data were plotted as lower-hemisphere equal-area pole figures for quartz c-axes and a-axes using the MTEX toolbox in MATLAB [10] . The fabric strength was quantified using the J-index (orientation distribution function). Differential stress was estimated from mean recrystallised quartz grain size using the piezometer of Stipp and Tullis [11] , and deformation temperature was estimated from quartz c-axis fabric opening angles following the calibration of Law [12] . Microstructural character changed systematically across the transect. Table 1 presents the key petrofabric parameters for each deformation zone. Mean quartz grain size decreased from 298 μm in protomylonite to 124 μm in mylonite and 42 μm in ultramylonite, while aspect ratios increased from 1.8 to 3.7 and 6.1 respectively. Quartz modal proportion rose from 38.2% to 51.3%, consistent with the preferential mechanical breakdown and dissolution of feldspar during progressive strain.
Results
Results
Discussion
The progressive grain size reduction, increasing aspect ratios, and strengthening CPO documented across the SSZ transect are consistent with strain localisation driven by dynamic recrystallisation under mid-crustal conditions. The seven-fold decrease in mean quartz grain size from protomylonite (298 μm) to ultramylonite (42 μm) translates, through the Stipp and Tullis piezometer, into a nearly threefold increase in differential stress-from 28 to 74 MPa [11] . This stress increase toward the shear zone core is expected in systems where strain softening concentrates deformation into progressively narrower bands, raising local stress within those bands even as the far-field tectonic stress remains roughly constant [13] .
The dominance of basal <a> slip throughout the mylonite and ultramylonite zones, indicated by the c-axis cross-girdle patterns, is consistent with deformation temperatures in the 420-500 °C range-squarely within the greenschist-toamphibolite-facies transition [14] . The slightly wider opening angles in the protomylonite (72°) suggest that the shear zone margins experienced somewhat higher temperatures or lower strain rates, possibly reflecting their position closer to the hotter footwall of the Lepontine dome. This temperature gradient across the shear zone width has been noted in previous metamorphic petrological work but is here confirmed independently through fabric thermometry.
The increase in quartz modal proportion from 38.2% to 51.3% across the strain gradient deserves attention. It is not that new quartz was introduced; rather, feldspar-the more rheologically rigid phase at these temperatures-was preferentially fractured, dissolved, and removed by fluidassisted diffusion creep, leaving a residual enrichment of the more ductile quartz [15] . This process of syntectonic phase segregation has been described in many shear zones worldwide and has implications for shear zone rheology because a quartz-rich aggregate is weaker than a quartzfeldspar mixture at the same temperature. One limitation of this research is the absence of water content measurements in quartz, which can significantly affect dislocation creep rates and, therefore, the piezometric stress estimates. Trace water in quartz weakens the crystal lattice and may cause the Stipp-Tullis piezometer to overestimate stress if the natural water content exceeds that of the experimental calibration samples [16] . Fouriertransform infrared spectroscopy on selected samples would help resolve this uncertainty.
Limitations
Beyond the water-content issue noted in the discussion, two additional limitations should be acknowledged. First, the transect sampling approach assumes that the along-strike character of the shear zone is reasonably uniform; structural complexity such as anastomosing high-strain lenses or lateral ramps could introduce fabric variability that a single transect does not capture. Second, the EBSD step size (2-5 μm) may under-sample the finest grains in the ultramylonite domain, potentially biasing the measured grain size distribution toward coarser values and underestimating differential stress. Higher-resolution transmission electron microscopy would be needed to characterise the sub-micron grain population that likely exists in the most intensely deformed bands.
Conclusion
This research documented the petrofabric evolution across the Simplon Shear Zone using optical, EBSD, and imageanalysis techniques applied to 36 oriented samples spanning the protomylonite-to-ultramylonite strain gradient. Quartz grain size decreased seven-fold from the shear zone margins to its core, while aspect ratios increased more than threefold and CPO strength nearly tripled. These trends define a coherent record of progressive strain localisation under midcrustal ductile conditions. Deformation temperatures estimated from quartz c-axis opening angles ranged from 420 to 530 °C, and piezometric stresses increased from 28 to 74 MPa toward the shear zone centre. The dominant slip system throughout the high-strain zones was basal <a>, consistent with greenschist-toamphibolite-facies conditions. The systematic increase in quartz modal proportion at the expense of feldspar confirms that syntectonic phase segregation accompanied strain localisation, progressively weakening the aggregate and promoting further strain concentration-a self-reinforcing feedback that helps explain why continental shear zones maintain narrow, persistent deformation corridors over millions of years. The petrofabric dataset presented here provides quantitative microstructural benchmarks for the SSZ that can be compared with numerical models of shear zone evolution and with analogous natural shear zones in other collisional orogens. Future work should incorporate water content measurements to refine piezometric estimates and should extend the transect to capture along-strike fabric variability.
Acknowledgement
Acknowledgements Funding SourcesThis research was supported by general institutional research funds from the Calgary Institute of Climate and Environment. No external competitive grants were applied. Institutional SupportThe authors thank the Calgary Institute of Climate and Environment for access to the SEM-EBSD laboratory and thin section preparation facilities. Field access in Switzerland was facilitated by the Swiss Federal Office for the Environment.
Figures and tables from the paper
References
16 in the original paper- Passchier CW, Trouw RAJ. Microtectonics. SpringerVerlag, 2nd Edition. 2005;1:1-366.
- Mancktelow NS. The Simplon Fault Zone. Geological Society of Switzerland Eclogae Geologicae Helvetiae. 1985;78(1):73-89.
- Campani M, Mancktelow NS, Seward D, Rolland Y, Müller W, Guerra I. Geochronological evidence for continuous exhumation through the ductile-brittle transition along a crustal-scale low-angle normal fault: Simplon Fault Zone, central Alps. Tectonics. 2010;29(3):TC3002.
- Tullis J. Deformation of granitic rocks: Experimental studies and natural examples. Reviews in Mineralogy and Geochemistry. 2002;51(1):51-95.
- Stipp M, Stünitz H, Heilbronner R, Schmid SM. The eastern Tonale fault zone: A natural laboratory for crystal plastic deformation of quartz over a temperature range from 250 to 700 °C. Journal of Structural Geology. 2002;24(12):1861-1884.
- Sibson RH. Fault rocks and fault mechanisms. Journal of the Geological Society. 1977;133(3):191-213.
- Tullis J, Yund RA. Diffusion creep in feldspar aggregates: Experimental evidence. Journal of Structural Geology. 1991;13(9):987-1000.
- Schmid SM, Casey M. Complete fabric analysis of some commonly observed quartz c-axis patterns. Geophysical Monograph Series. 1986;36:263-286.
- Prior DJ, Boyle AP, Brenker F, Cheadle MC, Day A, Lopez G. The application of electron backscatter diffraction and orientation contrast imaging in the SEM to textural problems in rocks. American Mineralogist. 1999;84(11-12):1741-1759.
- Bachmann F, Hielscher R, Schaeben H. Texture analysis with MTEX-free and open source software toolbox. Solid State Phenomena. 2010;160:63-68.
- Stipp M, Tullis J. The recrystallized grain size piezometer for quartz. Geophysical Research Letters. 2003;30(21):2088.
- Law RD. Deformation thermometry based on quartz caxis fabrics and recrystallization microstructures: A review. Journal of Structural Geology. 2014;66:129161.
- Platt JP, Behr WM. Grainsize evolution in ductile shear zones: Implications for strain localization and the strength of the lithosphere. Journal of Structural Geology. 2011;33(4):537-550.
- Hirth G, Tullis J. Dislocation creep regimes in quartz aggregates. Journal of Structural Geology. 1992;14(2):145-159.
- Kilian R, Heilbronner R, Stünitz H. Quartz grain size reduction in a granitoid rock and the transition from dislocation to diffusion creep. Journal of Structural Geology. 2011;33(8):1265-1284.
- Holyoke CW, Kronenberg AK. Accurate differential stress measurement using the molten salt cell and solid salt assemblies in the Griggs apparatus. Tectonophysics. 2010;494(1-2):17-31.