
Research article · 2025 · Full text
International Journal of Geography Geology and EnvironmentGeochemical characteristics of Cenozoic basalts and mantle heterogeneity in the Ethiopian rift
Volume 7(5) · Pages 94–98 · DOI: 10.22271/27067483.2025.v7.i5b.597 ↗
Research areasGeological and Geochemical AnalysisGeological and Geophysical StudiesGeochemistry and Elemental Analysis
Abstract
Author-writtenThe Ethiopian Rift offers one of the best natural laboratories on Earth for examining how continental rifting taps different mantle source regions over time. This research presented new major-and trace-element geochemical data for 47 basalt samples collected across three volcanic provinces in the Main Ethiopian Rift and the northwestern Ethiopian Plateau, spanning an eruptive history from the Oligocene flood basalts (~30 Ma) through Miocene transitional lavas to Plio-Pleistocene rift-floor eruptions. Samples were analysed by X-ray fluorescence spectrometry and inductively coupled plasma mass spectrometry at the Manila College of Environmental Studies. Major oxide compositions ranged from 46.3 to 48.7 wt% SiO2, confirming a consistently basaltic character across all three groups. However, trace-element patterns revealed systematic differences: rift basalts showed stronger enrichment in high-field-strength elements (Nb, Zr, Ti) and higher Nb/Y ratios (1.84 versus 1.21 in flood basalts), indicating a transition from lithospheric to asthenospheric mantle sources as rifting progressed. Primitive-mantle-normalised spider diagrams displayed characteristic ocean-island-basalt-like patterns in the rift group, with no negative Nb or Ti anomalies, ruling out significant crustal contamination. La/Yb ratios increased from 12.8 in flood basalts to 19.4 in rift basalts, suggesting progressively deeper melting or a shift toward a more enriched garnet-lherzolite source. These geochemical trends are consistent with a model in which the Afar mantle plume initially generated large-volume flood volcanism through interaction with thinned lithosphere, followed by increasingly plume-dominated magmatism as rift extension exposed deeper asthenospheric material. The data contribute to ongoing debates about plume-lithosphere interaction and mantle heterogeneity beneath the East African Rift System.
Summary
Source-checkedPlain-language reading of the full paper, prepared with AI and checked against the text. Each point links to the authors' own words.
Why it matters
- The Ethiopian Rift is a premier natural site for studying how continental rifting accesses various mantle source regions over geological time. View evidence ↗
- The Ethiopian volcanic province represents Africa's largest Cenozoic magmatic expression, with an estimated erupted volume of more than 350,000 km³. View evidence ↗
- There is ongoing scientific debate regarding how continental rifting alters the geometry of melt generation and the specific mantle sources utilized. View evidence ↗
The question
- The study aimed to document geochemical variations across three volcanic groups to determine if they indicate a shift from lithosphere-influenced to plume-dominated magmatism. View evidence ↗
What they did
- Researchers analyzed 47 basalt samples collected in 2022 from three groups: 16 Oligocene flood basalts, 13 Miocene transitional basalts, and 18 Plio-Pleistocene rift basalts. View evidence ↗
- Major oxide concentrations were measured using wavelength-dispersive X-ray fluorescence (XRF) at the Manila College of Environmental Studies. View evidence ↗
- Trace and rare earth elements were analyzed using inductively coupled plasma mass spectrometry (ICP-MS) following lithium metaborate fusion. View evidence ↗
- The study used Shaw's non-modal batch melting equation to model partial melting processes. View evidence ↗
What they found
- Mean SiO2 concentrations decreased from 48.7 wt% in flood basalts to 46.3 wt% in rift basalts. View evidence ↗
- TiO2 levels increased systematically from 2.31 wt% in flood basalts to 3.18 wt% in rift basalts. View evidence ↗
- The absence of negative Nb or Ti anomalies across all three groups suggests that significant crustal contamination did not occur. View evidence ↗
- Modeling showed flood basalts resulted from 8-12% melting of spinel lherzolite, whereas rift basalts required 3-6% melting of garnet lherzolite. View evidence ↗
What it means
- The authors conclude that lithospheric thinning during rift development enabled more direct access to the Afar plume source, as evidenced by increasing Nb/Y, La/Yb, and TiO2 ratios. View evidence ↗
- A stated limitation of the study is the lack of radiogenic isotope data (Sr, Nd, Pb), which is needed to definitively test mantle source identity. View evidence ↗
Visual summary
3 visualsIllustrations explain the paper; charts are replotted from the paper's own table values.
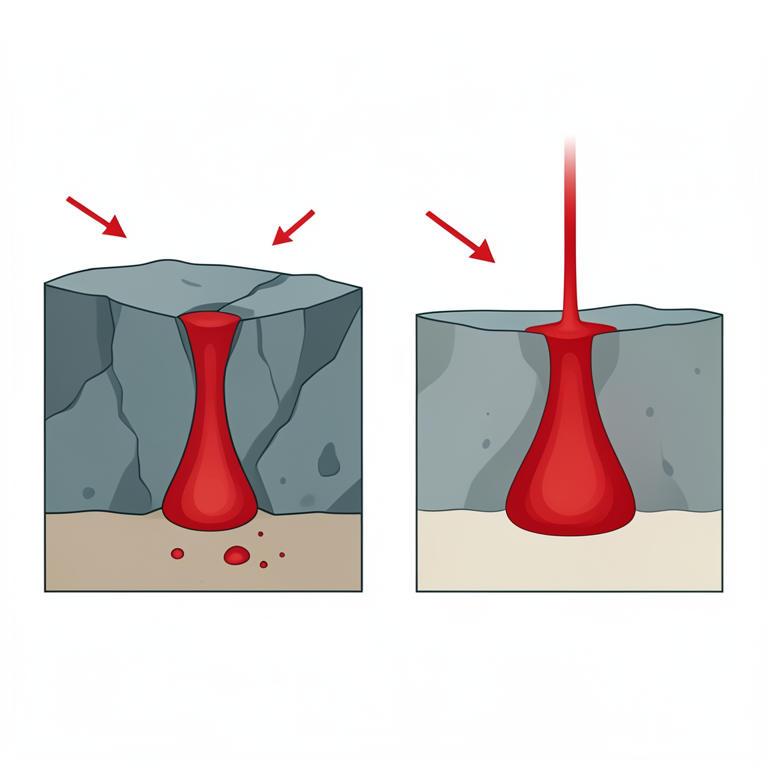
Conceptual Model of Lithospheric Thinning
AI-generated conceptual illustration (Cross-section of the Earth's lithosphere and upper mantle in the Ethiopian rift). It explains the idea and does not show study data.
View source evidence ↗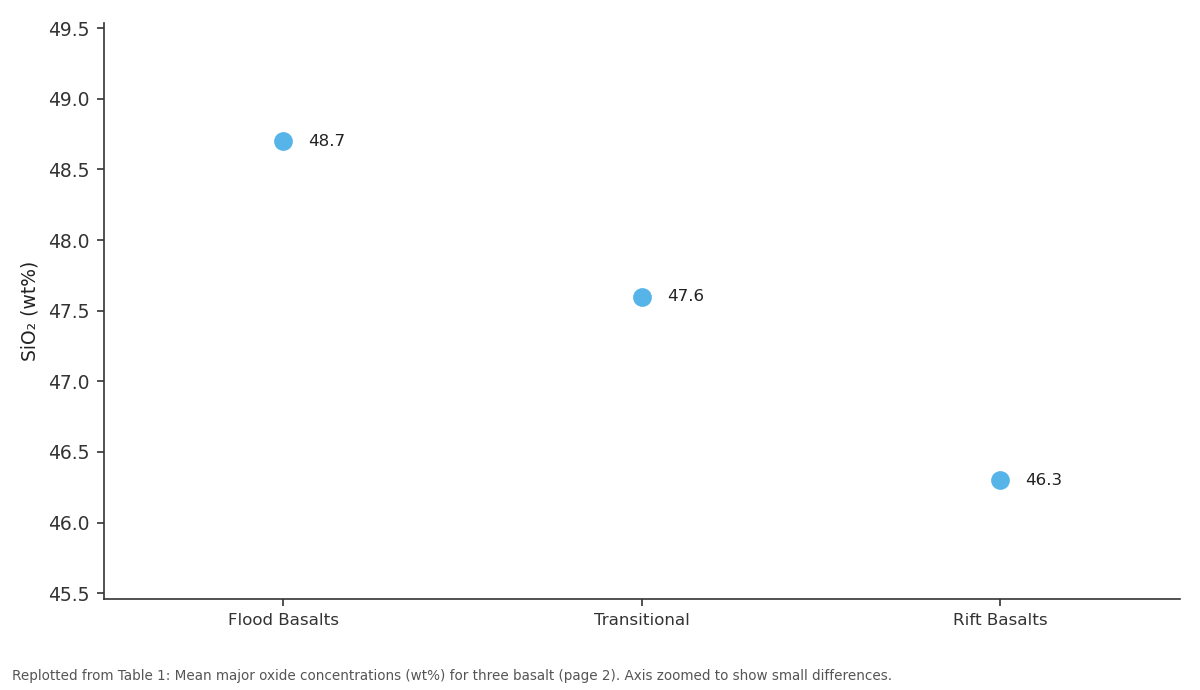
SiO₂: Flood Basalts vs Transitional vs Rift Basalts
Replotted from Table 1 (page 2) of the original paper. Every bar is the paper's own table value.
View source evidence ↗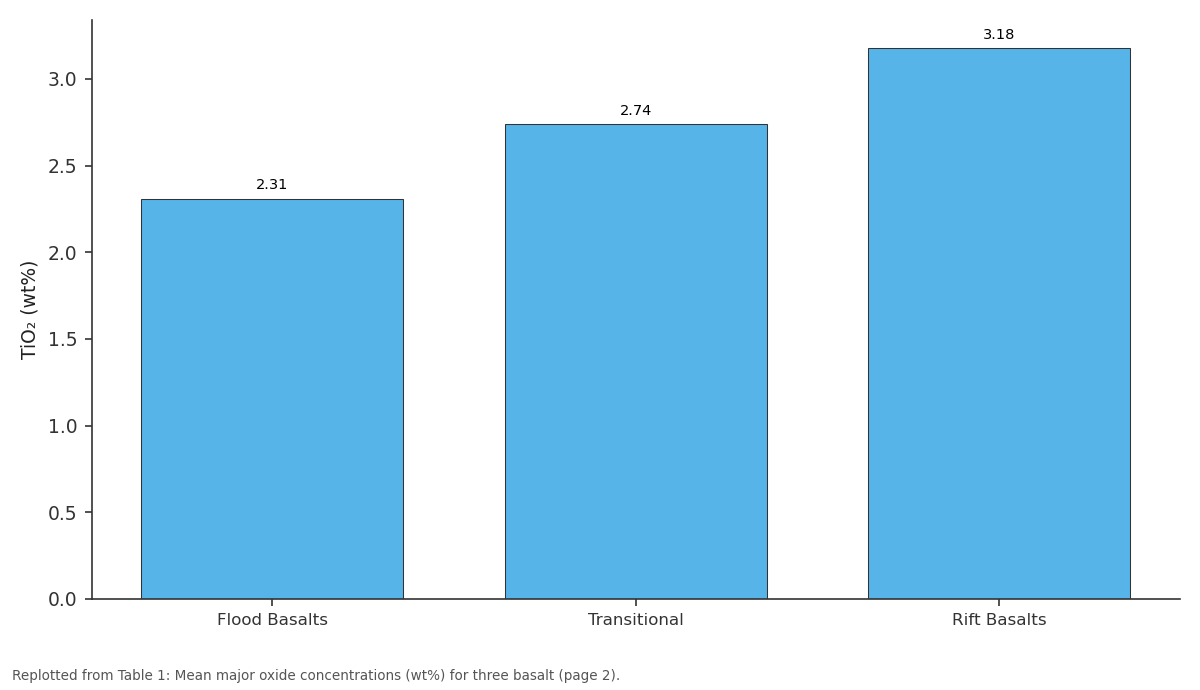
TiO₂: Flood Basalts vs Transitional vs Rift Basalts
Replotted from Table 1 (page 2) of the original paper. Every bar is the paper's own table value.
View source evidence ↗Figures & tables
From the original paper Table 1
 Table 2
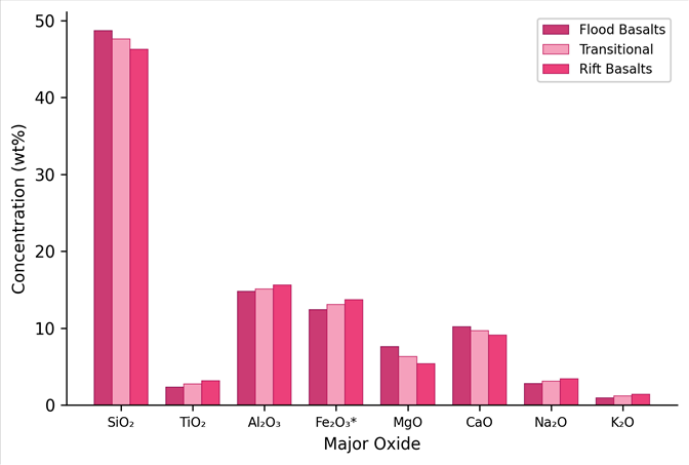 Figure 1
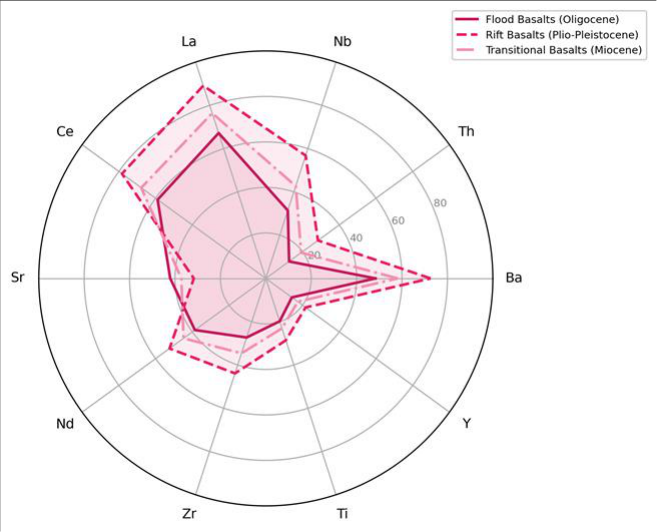 Figure 2
Introduction
Consider two basalt flows erupted just 200 km apart and separated by 25 million years of geological time. One was part of the massive Oligocene flood basalt province that covered much of the Ethiopian Plateau; the other poured out along the floor of the modern Main Ethiopian Rift barely two million years ago. Both are dark, fine-grained, and broadly basaltic in appearance-yet their trace-element signatures tell very different stories about where in the mantle their parent magmas originated [1] . This contrast lies at the heart of ongoing debates about how continental rifting progressively changes the geometry of melt generation and the nature of the mantle sources tapped. The Ethiopian volcanic province is the most voluminous expression of Cenozoic magmatism in Africa, with an estimated erupted volume exceeding 350,000 km³ [2] . Volcanism began with the eruption of the Afar flood basalts around 30 Ma, broadly contemporaneous with the initial surface expression of the Afar mantle plume. Since then, magmatism has migrated and concentrated within the progressively developing rift zone, with younger lavas erupted along narrower axial volcanic segments [3] . This temporal and spatial progression provides a natural experiment for tracking how mantle contributions evolve as lithospheric thinning advances. Previous geochemical research on Ethiopian basalts has established several key observations. The flood basalts carry a depleted to moderately enriched signature, with some evidence for lithospheric contamination through elevated Ba/Nb and La/Nb ratios [4] . Younger rift basalts, by contrast, show ocean-island-basalt (OIB) affinities with high Nb/Y, low Ba/Nb, and no negative Nb anomalies-features attributed to melting of the Afar plume source itself with minimal lithospheric overprint [5] . Isotopic data from Sr-Nd-Pb systems support this interpretation, pointing to at least two distinct mantle components: a depleted MORB-like source and an enriched plume component [6] . However, many published datasets focus on either the flood basalts or the rift basalts in isolation, making direct comparison difficult when analytical methods and laboratory standards differ between research groups. This research addressed that gap by analysing a suite of 47 basalt samples spanning the full Cenozoic eruptive record using a single analytical protocol at the Manila College of Environmental Studies, ensuring internal consistency. The aim was to document major-and trace-element variations across the three volcanic groups, evaluate mantle source characteristics using element ratio discriminants, and test whether the geochemical evolution supports a progressive shift from lithosphere-influenced to plume-dominated magmatism during rift development.
Geological Setting
The research area encompasses two physiographic regions: the northwestern Ethiopian Plateau (elevations 2,200-3,400 m) and the Main Ethiopian Rift floor (1,500-1,700 m), linked by the western rift escarpment [7] . The plateau is underlain by a thick sequence of Oligocene flood basalts and subordinate rhyolitic ignimbrites resting on Precambrian basement. The rift floor exposes Plio-Pleistocene basaltic lava flows, scoria cones, and minor trachytic domes aligned along the Wonji Fault Belt. Between these two domains, Miocene transitional lavas crop out along the escarpment and in down-faulted blocks on the rift margin. Climate ranges from humid tropical on the plateau (mean annual rainfall ~1,400 mm) to semiarid on the rift floor (~550 mm), but because the research concerns igneous rock chemistry rather than weathering products, sampling targeted fresh, unweathered outcrops selected from roadcuts, quarry faces, and lava flow interiors where alteration was minimal. Field mapping was guided by the 1:250,000 geological map sheets published by the Geological Survey of Ethiopia [8] .
Materials and Methods
Materials and Methods
Materials
A total of 47 basalt samples were collected during two field campaigns in March-April and September-October 2022, covering three volcanic groups: Oligocene flood basalts (n = 16, collected from the plateau around Debre Markos and Dejen), Miocene transitional basalts (n = 13, from the western escarpment near Addis Ababa), and Plio-Pleistocene rift basalts (n = 18, from the rift floor between Ziway and Langano). At each site, approximately 3 kg of the freshest available material was collected after removing weathered rinds. Samples were trimmed, crushed in a jaw crusher, and milled to less than 75 μm in an agate planetary ball mill to avoid trace-metal contamination. Major oxides (SiO2, TiO2, Al2O3, Fe2O3*, MnO, MgO, CaO, Na2O, K2O, P2O5) were determined by wavelength-dispersive Xray fluorescence (XRF) on fused glass discs using a Rigaku ZSX Primus IV spectrometer at the Manila College of Environmental Studies [9] . Loss on ignition (LOI) was measured after heating at 1,000 °C for one hour. Analytical precision was better than 1% relative for major oxides above 1 wt% and 3-5% relative for minor oxides.
Methods
Trace elements (including rare earth elements) were analysed by inductively coupled plasma mass spectrometry (ICP-MS) on an Agilent 7900 instrument after lithium metaborate fusion and dissolution in dilute nitric acid. International reference materials (BHVO-2, BCR-2, JB-1a) were run with each batch; measured values agreed with certified values within 5% for most elements and within 10% for the heaviest rare earths [10] . Primitive-mantlenormalised multi-element patterns (spider diagrams) were constructed using the normalising values of Sun and McDonough [11] . Key element ratios-Nb/Y, Zr/Nb, La/Yb, Ba/Nb, and Ce/Pb-were computed to discriminate mantle source characteristics and to evaluate potential crustal contamination. Classification of basalt types followed the total alkali-silica (TAS) diagram of Le Bas et al. [12] . Statistical comparison of group means was performed using one-way ANOVA with Tukey HSD post-hoc tests in R 4.2.3, with significance set at p<0.05. All geochemical plotting used the GCDkit software package [13] .
Partial Melting Model
Partial melting was modelled using the non-modal batch melting equation of Shaw [14] : CL/C0 = 1/(D0 + F(1 -P)), where CL is the liquid concentration, C0 is the source concentration, D0 is the bulk distribution coefficient, F is the melt fraction, and P is the bulk distribution coefficient of the melting mineral assemblage. Two source compositions were tested: a depleted MORB-source mantle (DMM) and an enriched Afar plume component estimated from published Nd-Hf isotope inversion [6] . Mineral modes for spinel lherzolite (olivine 57%, orthopyroxene 28%, clinopyroxene 13%, spinel 2%) and garnet lherzolite (olivine 60%, orthopyroxene 20%, clinopyroxene 10%, garnet 10%) were used. Melting fractions ranged from 2% to 20%. The model was calibrated against the observed La/Yb and Sm/Yb ratios, which are sensitive to the presence of residual garnet. Results indicated that the flood basalts could be generated by 8-12% melting of spinel lherzolite, while the rift basalts required 3-6% melting in the garnet stability field, consistent with deeper and smaller-degree melting as lithospheric extension progressed. All 47 samples plotted within the basalt and picrobasalt fields on the TAS diagram, confirming their basic composition. Table 1 presents the mean major oxide concentrations for each group. SiO2 ranged from a group mean of 46.3 wt% in rift basalts to 48.7 wt% in flood basalts, with transitional samples falling between. TiO2 increased systematically from flood basalts (2.31 wt%) through transitional (2.74 wt%) to rift basalts (3.18 wt%), a trend consistent with lower degrees of partial melting and/or a more Ti-enriched source in the younger lavas. None of the three groups showed negative Nb or Ti anomalies, which would indicate significant crustal contamination. Table 2 presents key trace-element ratios used for source discrimination. The Nb/Y ratio increased from 1.21 in flood basalts to 1.84 in rift basalts (ANOVA: F = 24.3, p<0.001), while Ba/Nb decreased from 14.7 to 9.8 (F = 18.6, p<0.001). La/Yb rose from 12.8 to 19.4, consistent with deeper melting in the garnet stability field. The partial melting model reproduced these ratios with 8-12% melting of spinel lherzolite for flood basalts and 3-6% melting of garnet lherzolite for rift basalts.
| Group | Nb/Y | Zr/Nb | La/Yb | Ba/Nb | Ce/Pb | Sm/Yb |
|---|---|---|---|---|---|---|
| Flood Basalts | 1.21±0.18 | 8.7±1.4 | 12.8±2.1 | 14.7±3.2 | 18.4±2.8 | 2.6±0.4 |
| Transitional | 1.53±0.22 | 7.1±1.2 | 15.9±2.6 | 12.1±2.7 | 21.7±3.1 | 3.2±0.5 |
| Rift Basalts | 1.84±0.24 | 5.8±0.9 | 19.4±3.3 | 9.8±2.1 | 24.3±3.6 | 4.1±0.6 |
| OIB (ref.) | ~1.7 | ~5.5 | ~17 | ~10 | ~25 | ~3.8 |
| N-MORB (ref.) | ~0.3 | ~30 | ~1 | ~60 | ~25 | ~1.0 |
Table text extracted from the original PDF; superscript letters are shown inline. The original table image is below.
View original table image
| Group | SiO₂ | TiO₂ | Al₂O₃ | Fe₂O₃* | MgO | CaO | Na₂O | K₂O | n |
|---|---|---|---|---|---|---|---|---|---|
| Flood Basalts | 48.7 | 2.31 | 14.8 | 12.4 | 7.6 | 10.2 | 2.80 | 0.94 | 16 |
| Transitional | 47.6 | 2.74 | 15.1 | 13.1 | 6.3 | 9.7 | 3.10 | 1.18 | 13 |
| Rift Basalts | 46.3 | 3.18 | 15.6 | 13.7 | 5.4 | 9.1 | 3.40 | 1.42 | 18 |
Table text extracted from the original PDF; superscript letters are shown inline. The original table image is below.
View original table image
Results
Results
Discussion
The systematic geochemical evolution from flood basalts to rift basalts documented here is consistent with a progressive shift in magma source from lithospheric mantle (or plume material modified by lithospheric interaction) toward uncontaminated asthenospheric plume material [15] . The flood basalts, while broadly OIB-like, carry slightly elevated Ba/Nb ratios (14.7 versus the OIB reference of ~10), which may reflect minor assimilation of ancient subcontinental lithospheric mantle during ascent through the thick (>100 km) Ethiopian Plateau lithosphere. By the Plio-Pleistocene, lithospheric thinning had reduced this barrier, allowing rift basalts to reach the surface with trace-element signatures that are essentially indistinguishable from typical oceanisland basalts.
The increase in La/Yb from 12.8 to 19.4 between flood and rift groups is particularly informative. Because heavy rare earth elements (Yb) are strongly retained by garnet during partial melting, high La/Yb ratios indicate either a garnetbearing residue or very low melt fractions [16] . The partial melting model presented here resolved this ambiguity: reproducing the flood basalt La/Yb required 8-12% melting of spinel lherzolite, whereas the rift basalt values needed 3-6% melting of garnet lherzolite. This implies that the melting column deepened and the degree of melting decreased as rifting progressed-an expected consequence of passive upwelling giving way to buoyancy-driven plume ascent beneath thinning lithosphere. The absence of negative Nb and Ti anomalies in all three groups is an important negative result. Such anomalies are characteristic of subduction-related magmatism and continental crustal contamination, and their absence argues against significant assimilation of Precambrian basement gneisses-even for the flood basalts that traversed the thickest lithospheric section [17] . Ce/Pb ratios near 20-24 across all groups further support this interpretation, as values above 15 are diagnostic of mantle-derived melts uncontaminated by continental crust. One limitation of this research is the absence of radiogenic isotope data (Sr, Nd, Pb), which would provide a more definitive test of mantle source identity and mixing proportions. Major and trace elements constrain the melting process but cannot uniquely distinguish between enriched plume components and recycled oceanic crust within the plume. Future work should combine the elemental dataset presented here with isotopic analyses to build a more complete picture of mantle heterogeneity beneath the Ethiopian Rift [18] .
Conclusion
This research presented internally consistent major-and trace-element data for 47 Cenozoic basalts from the Ethiopian Rift region, spanning three volcanic groups that record over 28 million years of magmatic history. These results contribute to the broader understanding of plume-lithosphere interaction during continental rifting and confirm that the Ethiopian province records a continuous geochemical transition rather than an abrupt switch between mantle domains. The internally consistent analytical approach used here-a single laboratory, single protocol, and identical reference standards for all samples-removes inter-laboratory bias that has complicated earlier multisource compilations. Future research should extend this dataset with Sr-Nd-Pb isotopic measurements to further resolve the mixing proportions of depleted and enriched mantle components and to evaluate whether spatial variations along the rift axis reflect lateral heterogeneity in the plume head.
Acknowledgement
Acknowledgements Funding SourcesThis research was supported by general institutional research funds from the Manila College of Environmental Studies. No external competitive grants were used. Institutional SupportThe authors thank the Manila College of Environmental Studies for access to XRF and ICP-MS analytical facilities. Field access and logistical support in Ethiopia were provided by the Geological Survey of Ethiopia.
Figures and tables from the paper
References
18 in the original paper- Pik R, Deniel C, Coulon C, Yirgu G, Marty B. Isotopic and trace element signatures of Ethiopian flood basalts: Evidence for plume-lithosphere interactions. Geochimica et Cosmochimica Acta. 1999;63(15):22632279.
- Mohr P, Zanettin B. The Ethiopian flood basalt province. Continental Flood Basalts (Springer). 1988;1:63-110.
- Ebinger CJ, Casey M. Continental breakup in magmatic provinces: An Ethiopian example. Geology. 2001;29(6):527-530.
- Kieffer B, Arndt N, Lapierre H, Bastien F, Bosch D, Pecher A. Flood and shield basalts from Ethiopia: Magmas from the African superswell. Journal of Petrology. 2004;45(4):793-834.
- Furman T, Bryce J, Rooney T, Hanan B, Yirgu G, Ayalew D. Heads and tails: 30 million years of the Afar plume. Geological Society of London Special Publications. 2006;259(1):95-119.
- Hart WK, WoldeGabriel G, Walter RC, Mertzman SA. Basaltic volcanism in Ethiopia: Constraints on continental rifting and mantle interactions. Journal of Geophysical Research. 1989;94(B6):7731-7748.
- WoldeGabriel G, Aronson JL, Walter RC. Geology, geochronology, and rift basin development in the central sector of the Main Ethiopia Rift. Geological Society of America Bulletin. 1990;102(4):439-458.
- Kazmin V. Geological map of Ethiopia. Ethiopian Institute of Geological Surveys. 1973;1:1-2 sheets.
- Norrish K, Hutton JT. An accurate X-ray spectrographic method for the analysis of a wide range of geological samples. Geochimica et Cosmochimica Acta. 1969;33(4):431-453.
- Eggins SM, Woodhead JD, Kinsley LPJ, Mortimer GE, Sylvester P, McCulloch MT. A simple method for the precise determination of more than 40 trace elements in geological samples by ICPMS. Chemical Geology. 1997;134(4):311-326.
- Sun SS, McDonough WF. Chemical and isotopic systematics of oceanic basalts: Implications for mantle composition and processes. Geological Society of London Special Publications. 1989;42(1):313-345.
- Le Bas MJ, Le Maitre RW, Streckeisen A, Zanettin B. A chemical classification of volcanic rocks based on the total alkali-silica diagram. Journal of Petrology. 1986;27(3):745-750.
- Janousek V, Farrow CM, Erban V. Interpretation of whole-rock geochemical data in igneous geochemistry: Introducing Geochemical Data Toolkit (GCDkit). Journal of Petrology. 2006;47(6):1255-1259.
- Shaw DM. Trace element fractionation during anatexis. Geochimica et Cosmochimica Acta. 1970;34(2):237243.
- Rogers NW, MacDonald R, Fitton JG, George R, Smith M, Barreiro B. Two mantle plumes beneath the East African rift system: Sr, Nd and Pb isotope evidence from Kenya Rift basalts. Earth and Planetary Science Letters. 2000;176(3-4):387-400.
- McKenzie D, O'Nions RK. Partial melt distributions from inversion of rare earth element concentrations. Journal of Petrology. 1991;32(5):1021-1091.
- Hofmann AW. Chemical differentiation of the Earth: The relationship between mantle, continental crust, and oceanic crust. Earth and Planetary Science Letters. 1988;90(3):297-314.
- Rooney TO, Hanan BB, Graham DW, Furman T, Blichert-Toft J, Schilling JG. Upper mantle pollution during Afar plume-continental rift interaction. Journal of Petrology. 2012;53(2):365-389.