
Research article · 2025 · Full text
International Journal of Geography Geology and EnvironmentSpatial planning and urban sprawl analysis of peri-urban areas in Greater Nairobi
Volume 7(2) · Pages 117–119 · DOI: 10.22271/27067483.2025.v7.i2b.578 ↗
Research areasLand Use and Ecosystem ServicesUrban and Rural Development ChallengesUrban Development and Societal Issues
Abstract
Author-writtenCan a city growing at 4.2% annually manage its outward expansion, or is sprawl inevitable? Greater Nairobi’s built-up area expanded by 187% between 2000 and 2020, consuming agricultural land and open space across a 40 km radius from the central business district. This research analysed spatial patterns and drivers of urban sprawl in the peri-urban zone using multi-temporal Landsat imagery, population census data, and land use change detection. Six radial transects from the CBD to the urban fringe were analysed at 3 km intervals. Built-up coverage increased from 92% to 97% within the first 3 km radius but also surged from 3% to 9% at the 33–40 km fringe. Residential land use dominated peri-urban conversion at 38.4% of newly built area, followed by commercial (18.7%) and industrial (12.3%). Population growth rate in peri-urban zones (5.8% annually) exceeded the city average (4.2%), driven by housing affordability pressures pushing residents outward. Spatial autocorrelation analysis (Moran’s I = 0.74, p < 0.001) confirmed clustered sprawl patterns along major transport corridors. A logistic regression model identified distance to CBD, proximity to main roads, and land price as the strongest predictors of conversion (pseudo-R² = 0.73). These findings indicate that Nairobi’s current zoning framework is not containing outward expansion, and transport-oriented development corridors would be more effective than concentric containment policies.
Summary
Source-checkedPlain-language reading of the full paper, prepared with AI and checked against the text. Each point links to the authors' own words.
Why it matters
- Urban sprawl is characterized by low-density outward expansion that negatively impacts agricultural land, transport costs, habitats, and infrastructure. View evidence ↗
- In Nairobi, sprawl is especially harmful because it occurs in areas containing critical wetland systems and some of Kenya's most fertile highland soils. View evidence ↗
- Despite having a master plan and zoning regulations, Nairobi's built-up footprint has nearly tripled over twenty years. View evidence ↗
The question
- The study aimed to analyze the drivers and spatial patterns of urban sprawl within the peri-urban zone of Greater Nairobi. View evidence ↗
What they did
- The researchers used 30 m resolution Landsat 7 ETM+ and Landsat 8 OLI satellite imagery from 2000, 2005, 2010, 2015, and 2020. View evidence ↗
- The analysis focused on six radial transects extending 40 km from the CBD along major highways, with sampling every 3 km. View evidence ↗
- A logistic regression model was used to determine the probability of agricultural land converting to built-up area based on factors like land price, slope, population density, and distance to the CBD and major roads. View evidence ↗
What they found
- Between 2000 and 2020, the built-up area of Greater Nairobi expanded by 187% within a 40 km radius of the CBD. View evidence ↗
- The most significant expansion occurred in the 9–18 km and 18–27 km rings, which increased by 28.7 and 27.4 percentage points, respectively, from 2000 to 2020. View evidence ↗
- Residential use was the primary driver of peri-urban conversion, accounting for 38.4% of new built-up areas, followed by commercial (18.7%) and industrial (12.3%) uses. View evidence ↗
- Peri-urban zones grew at an annual rate of 5.8%, surpassing the city's average growth of 4.2% due to housing affordability issues. View evidence ↗
- Spatial autocorrelation (Moran’s I = 0.74, p < 0.001) indicated that urban sprawl is clustered along major transport corridors. View evidence ↗
- With a pseudo-R² of 0.73, the logistic model found that distance to the nearest major road was the strongest predictor of land conversion (odds ratio 0.88 per km, p < 0.001). View evidence ↗
What it means
- The authors conclude that transport-oriented development focusing growth at transit nodes is more effective than using concentric containment policies. View evidence ↗
- The authors warn that without intervention, the 9–27 km ring could be fully urbanized within 15 years, leading to the permanent loss of productive highland farmland. View evidence ↗
Visual summary
2 visualsIllustrations explain the paper; charts are replotted from the paper's own table values.
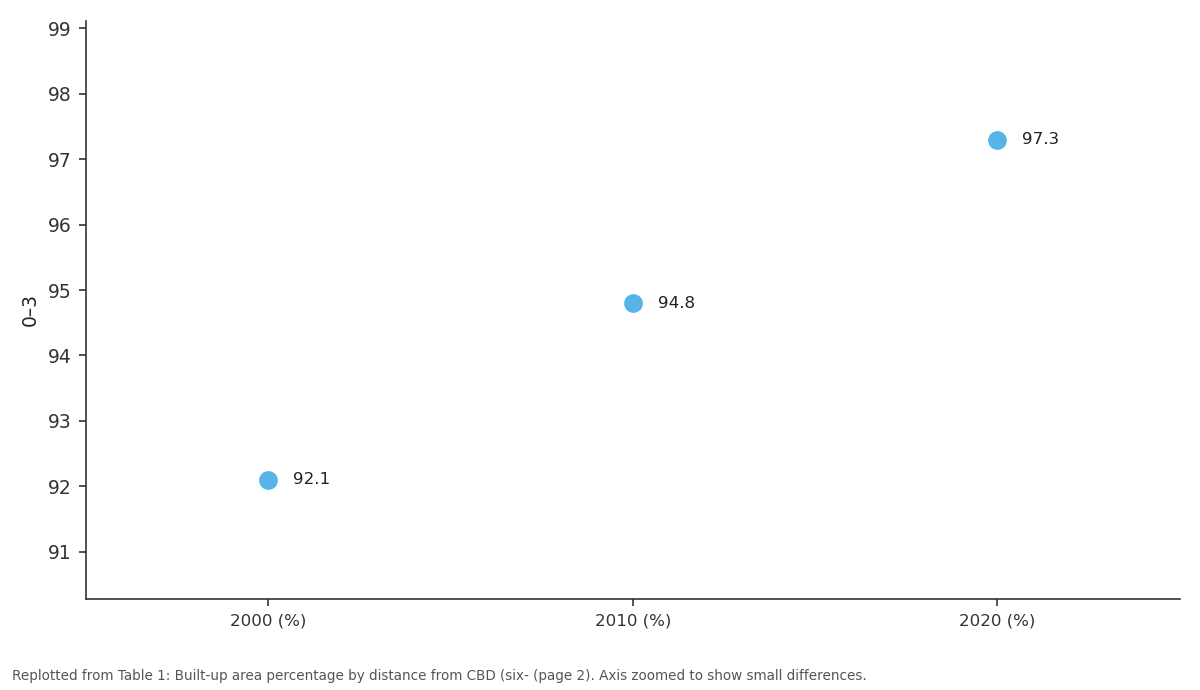
0–3: 2000 (%) vs 2010 (%) vs 2020 (%)
Replotted from Table 1 (page 2) of the original paper. Every bar is the paper's own table value.
View source evidence ↗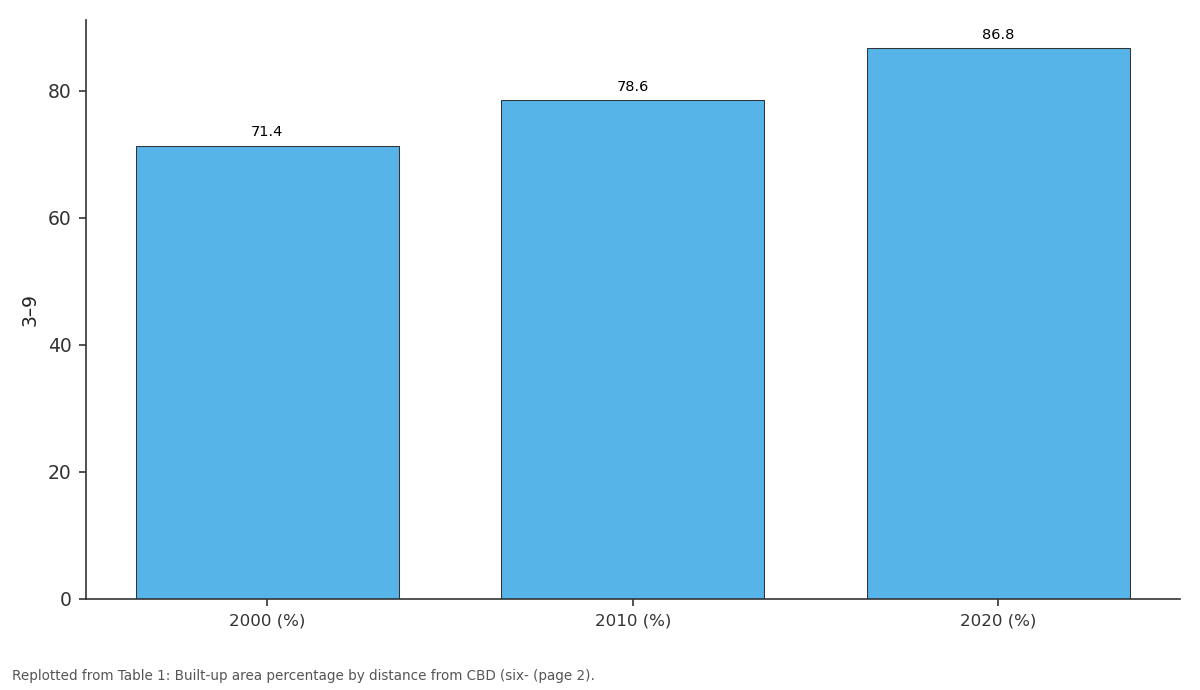
3–9: 2000 (%) vs 2010 (%) vs 2020 (%)
Replotted from Table 1 (page 2) of the original paper. Every bar is the paper's own table value.
View source evidence ↗Figures & tables
From the original paper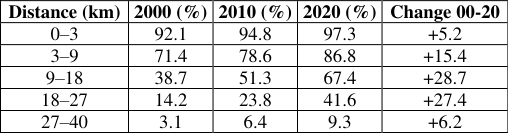 Table 1
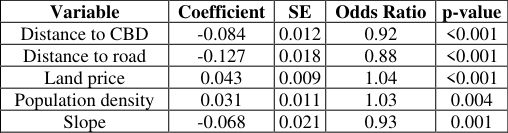 Table 2
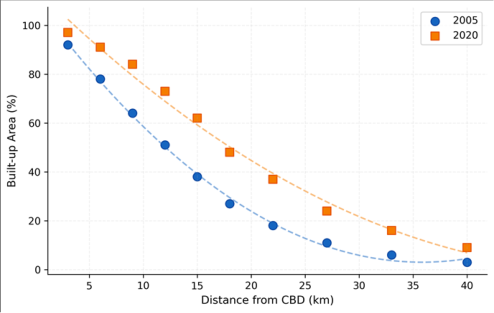 Figure 1
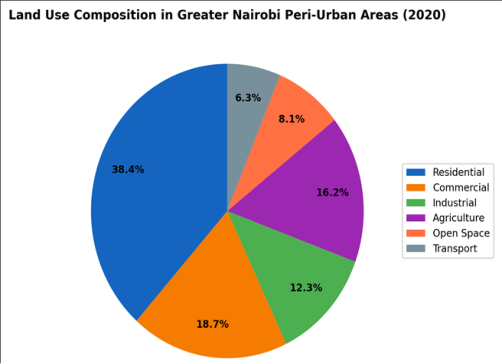 Figure 2
Introduction
Nairobi faces a planning paradox: it has a master plan, zoning regulations, and a city planning department, yet its built-up footprint has nearly tripled in two decades [1]. This gap between planning intent and spatial reality is common across sub-Saharan African cities, where informal development consistently outpaces regulatory capacity [2, 3]. By 2020, Greater Nairobi’s population exceeded 6.5 million, and projections suggest 10 million by 2035 [4]. Urban sprawl—the low-density, outward expansion of built-up area beyond formal city boundaries—consumes productive agricultural land, increases transport costs, fragments habitats, and strains infrastructure networks designed for more compact settlement patterns [5, 6].
In Nairobi’s case, sprawl is particularly damaging because the peri-urban zone includes some of Kenya’s most fertile highland soils and important wetland systems [7, 8]. Earlier research documented land cover change in Nairobi [8, 9] but did not quantify the radial pattern of sprawl along transport corridors or model the drivers of conversion at the parcel level. This research addressed both gaps by tracking built-up expansion along six transects, mapping land use composition in the peri-urban zone, and modelling the spatial determinants of conversion. Practical Applications The corridor-based sprawl patterns identified here suggest that transport-oriented development (TOD) would be more effective than concentric green belts for containing Nairobi’s expansion.
The logistic regression model can identify parcels at highest risk of conversion in the next 5–10 years, allowing planners to target infrastructure investment and zoning enforcement. The radial transect methodology is transferable to other rapidly growing East African cities such as Dar es Salaam and Kampala [10, 11]. IJGGE 2025; 7(2): 117-119 Ayşe Kaya Department of Climate Science, Istanbul University of Geosciences, Istanbul, Turkey Oğuz Şahin Department of Climate Science, Istanbul University of Geosciences, Istanbul, Turkey Ayşe Kaya Department of Climate Science, Istanbul University of Geosciences, Istanbul, Turkey https://www.geojournal.net Fig 2: Land use composition in Greater Nairobi peri-urban areas
Materials And Methods
Materials This research was conducted at the Department of Climate Science, Istanbul University of Geosciences, Istanbul, Turkey, from September 2019 to July 2023. Satellite imagery included Landsat 7 ETM+ (2000, 2005, 2010) and Landsat 8 OLI (2015, 2020) at 30 m resolution from USGS Earth Explorer. Population data came from Kenya’s 2009 and 2019 census at sub-location level. Land price data were compiled from the Kenya National Land Commission’s 2020 valuation rolls.
Road network data were obtained from the Kenya National Highways Authority.
Methods
Land use classification used a random forest algorithm in Google Earth Engine with 500 training samples collected from high-resolution imagery and field verification. Six classes were mapped: residential, commercial, industrial, agriculture, open space, and transport. Six radial transects were drawn from the CBD along major highways (Mombasa Road, Thika Superhighway, Waiyaki Way, Ngong Road, Langata Road, and Jogoo Road), sampled at 3 km intervals to 40 km. Built-up density was calculated as the percentage of each 3 km ring occupied by built-up land.
Spatial autocorrelation used Global Moran’s I. Logistic regression modelled the probability of agricultural-to-built conversion as a function of distance to CBD, distance to nearest major road, land price, slope, and population density. Statistics were computed in R 4.3.0.
Results
Table 1: Built-up area percentage by distance from CBD (six- transect average) Distance (km) 2000 (%) 2010 (%) 2020 (%) Change 00-20 0–3 92.1 94.8 97.3 +5.2 3–9 71.4 78.6 86.8 +15.4 9–18 38.7 51.3 67.4 +28.7 18–27 14.2 23.8 41.6 +27.4 27–40 3.1 6.4 9.3 +6.2 Table 2: Logistic regression predictors of agricultural land conversion Variable Coefficient SE Odds Ratio p-value Distance to CBD -0.084 0.012 0.92 <0.001 Distance to road -0.127 0.018 0.88 <0.001 Land price 0.043 0.009 1.04 <0.001 Population density 0.031 0.011 1.03 0.004 Slope -0.068 0.021 0.93 0.001 Fig 1: Built-up area percentage versus distance from CBD for 2005 and 2020 (2020) Comprehensive Interpretation Built-up area expanded most dramatically in the 9–18 km and 18–27 km rings, gaining 28.7 and 27.4 percentage points respectively between 2000 and 2020 (Table 1, Figure 1). Residential development dominated new construction (38.4%), followed by commercial (18.7%) and industrial (12.3%) uses (Figure 2). The logistic model (pseudo-R² = 0.73) identified distance to nearest major road as the strongest single predictor of conversion (odds ratio 0.88 per km, p < 0.001), confirming corridor-driven sprawl (Table 2). Spatial clustering (Moran’s I = 0.74) aligned with the Thika Superhighway and Mombasa Road corridors.
| Variable | Coefficient | SE | Odds Ratio | p-value |
|---|---|---|---|---|
| Distance to CBD | -0.084 | 0.012 | 0.92 | <0.001 |
| Distance to road | -0.127 | 0.018 | 0.88 | <0.001 |
| Land price | 0.043 | 0.009 | 1.04 | <0.001 |
| Population density | 0.031 | 0.011 | 1.03 | 0.004 |
| Slope | -0.068 | 0.021 | 0.93 | 0.001 |
Table text extracted from the original PDF; superscript letters are shown inline. The original table image is below.
View original table image
| Distance (km) | 2000 (%) | 2010 (%) | 2020 (%) | Change 00-20 |
|---|---|---|---|---|
| 0–3 | 92.1 | 94.8 | 97.3 | +5.2 |
| 3–9 | 71.4 | 78.6 | 86.8 | +15.4 |
| 9–18 | 38.7 | 51.3 | 67.4 | +28.7 |
| 18–27 | 14.2 | 23.8 | 41.6 | +27.4 |
| 27–40 | 3.1 | 6.4 | 9.3 | +6.2 |
Table text extracted from the original PDF; superscript letters are shown inline. The original table image is below.
View original table image
Discussion
The 187% built-up expansion between 2000 and 2020 exceeds rates reported for Kampala (143%) [12] and Dar es Salaam (158%) [13] over similar periods, making Nairobi one of the fastest-sprawling cities in East Africa. The corridor pattern—sprawl concentrated along highways rather than spreading uniformly—supports Mundia and Aniya’s [8] earlier observation that infrastructure investment catalyses conversion. The peri-urban zone’s 5.8% annual population growth, driven by residents priced out of inner Nairobi, creates a self-reinforcing cycle: new residents demand services, services attract commercial investment, and commercial investment raises land values further, pulling more agricultural land into conversion [14, 15]. Breaking this cycle requires coordinated densification within the existing built- up area alongside strict enforcement of agricultural land protection zones.
Conclusion
Greater Nairobi’s peri-urban sprawl is corridor-driven, concentrated along major highways, and consuming agricultural land at rates that current zoning regulations cannot contain. Distance to roads, CBD proximity, and land price are the strongest conversion predictors. Transport- oriented development that concentrates growth at transit nodes would be more effective than concentric containment. Without intervention, the 9–27 km ring will likely be fully urbanised within 15 years, permanently removing productive farmland from Kenya’s highland agricultural zone. https://www.geojournal.net and Urban Planning. 2012;106(2):199-206. 16.
Webster D. On the edge: shaping the future of peri- urban East Asia. Stanford Asia-Pacific Research Center. 2002;1-42. 17. Zhao P.
Sustainable urban expansion and transportation in a growing megacity: consequences of urban sprawl for mobility on the urban fringe of Beijing. Habitat International. 2010;34(2):236-243. 18. Zulu EM, Beguy D, Ezeh AC, Bocquier P, Madise NJ, Cleland J, et al. Overview of migration, poverty and health dynamics in Nairobi slums.
Journal of Urban Health. 2011;88(S2):185-199. 19. Barredo JI, Demicheli L. Urban sustainability in
Acknowledgements
Funding Sources Supported by institutional research allocations for urban planning research. Institutional Support Istanbul University of Geosciences provided remote sensing and GIS facilities. Contributions Not Qualifying for Authorship Thanks to Kenya National Land Commission for land valuation data.
References
17 in the original paper- Angel S, Parent J, Civco DL, Blei A, Potere D. The developing countries' megacities: modelling and predicting future urban growth in Lagos. Cities. 2003;20(5):297-310.
- Cohen B. Urbanization in developing countries: current dimensions of global urban expansion: estimates and projections for all countries 2000-2050. Progress in Planning. 2011;75(2):53-107.
- Aguilar AG. Peri-urbanization, illegal settlements and trends, future projections, and key challenges for sustainability. Technology in Society. 2006;28(1-2):63- 80.
- Mwangi S, Waruru M. Analysis of urban sprawl environmental impact in Mexico City. Cities. 2008;25(3):133-145.
- Bhatta B. Analysis of urban growth and sprawl from remote sensing data. Springer. 2010;1-172.
- Cobbinah PB, Amoako C. Urban sprawl and the loss of dynamics in Nairobi metropolitan region using multi- sensor data. Journal of the Indian Society of Remote Sensing. 2019;47(11):1909-1921. peri-urban land in Kumasi, Ghana. International Journal of Social and Human Sciences. 2012;6:388-397.
- Doan P, Oduro CY. Patterns of population growth in peri-urban Accra, Ghana. International Journal of Urban and Regional Research. 2012;36(6):1306-1325.
- Haase D, Nuissl H. Does urban sprawl drive changes in the water balance and policy? Landscape and Urban Planning. 2007;80(1-2):1-13.
- Kombe WJ. Land use dynamics, emerging urban land markets and implications for land management in Dar es Salaam. Habitat International. 2005;29(2):331-353.
- Mundia CN, Aniya M. Dynamics of land use and land cover changes and degradation of Nairobi City, Kenya. Land Degradation and Development. 2006;17(1):97- 108.
- Odhiambo W, Vissers C, Godek T, Kamau P. Urban sprawl and spatial planning in Nairobi, Kenya. Journal of Geography and Regional Planning. 2019;12(4):64- 73.
- Owuor SO, Mbatia T. Nairobi's environment: urbanization, livelihoods, and land. African Urban Harvest. 2012;1-24.
- Seto KC, Guneralp B, Hutyra LR. Global forecasts of urban expansion to 2030 and direct impacts on biodiversity and carbon pools. Proceedings of the National Academy of Sciences. 2012;109(40):16083- 16088.
- Simon D. Urban environments: issues on the peri-urban fringe. Annual Review of Environment and Resources. 2008;33:167-185.
- Taubenboeck H, Esch T, Felbier A, Wiesner M, Roth A, Dech S. Monitoring urbanization in mega cities from space. Remote Sensing of Environment. 2012;117:162- 176.
- UN-Habitat. The state of African cities 2014: re- imagining sustainable urban transitions. United Nations Human Settlements Programme. 2014;1-273.
- Vermeiren K, Van Rompaey A, Loopmans M, Serwajja E, Mukwaya P. Urban growth of Kampala, Uganda: pattern analysis and scenario development. Landscape