
Research article · 2025 · Full text
International Journal of Geography Geology and EnvironmentSpatial distribution of healthcare accessibility in the northern cape province
Volume 7(2) · Pages 111–113 · DOI: 10.22271/27067483.2025.v7.i2b.576 ↗
Research areasGlobal Health Workforce IssuesPublic Health and Social InequalitiesHealthcare Quality and Satisfaction
Abstract
Author-writtenSouth Africa’s Northern Cape Province covers 372,889 km² yet holds barely 1.3 million residents. This research assessed healthcare accessibility across five district municipalities using GIS-based service area analysis and community surveys from 860 households. A total of 187 facilities were mapped. Network analysis showed 38.7% of the rural population lived more than 60 minutes from the nearest hospital. Skilled birth attendance dropped from 94.2% within 5 km to 29.8% beyond 150 km (r = -0.97, p < 0.001). Pixley ka Seme and Namakwa districts recorded facility-to-population ratios of 1:8,400 and 1:7,200, far below the 1:3,500 national benchmark. Geographic distance remains the dominant barrier, and mobile clinic expansion offers the most practical short-term solution.
Summary
Source-checkedPlain-language reading of the full paper, prepared with AI and checked against the text. Each point links to the authors' own words.
Why it matters
- The Northern Cape Province has the lowest population density in South Africa, with towns often separated by more than 100 km of scrubland. View evidence ↗
- Healthcare accessibility is defined by the fact that patients with the same illness can have different health outcomes based on their location. View evidence ↗
- While GIS-based accessibility analysis has been used in other rural global contexts, the specific challenges of the Northern Cape's extreme low density have not been widely studied. View evidence ↗
The question
- The study aimed to map all health facilities in the province, calculate travel-time service areas, and determine how this accessibility relates to maternal and child health indicators. View evidence ↗
What they did
- The researchers mapped 187 facilities and conducted community surveys of 860 households across five district municipalities using GIS-based service area analysis. View evidence ↗
- Driving-time isochrones of 15, 30, 60, and 120 minutes were calculated using ArcGIS 10.8, accounting for different road types and speeds ranging from 20 km/h to 120 km/h. View evidence ↗
- The study used the two-step floating catchment area (2SFCA) method to create an accessibility index that considers both the supply of facilities and the demand from the population. View evidence ↗
What they found
- Approximately 38.7% of the rural population in the province lives more than 60 minutes away from the nearest hospital. View evidence ↗
- There is a strong negative correlation between distance and skilled birth attendance, which fell from 94.2% for those within 5 km to 29.8% for those beyond 150 km. View evidence ↗
- The facility-to-population ratios in Pixley ka Seme (1:8,400) and Namakwa (1:7,200) are significantly worse than the national benchmark of 1:3,500. View evidence ↗
- Households located more than 60 minutes from a facility were six times more likely to delay seeking care for more than 48 hours. View evidence ↗
- Despite 28 mobile clinic routes, only 34% of households were aware of the schedule, and 41% reported that visits were missed. View evidence ↗
What it means
- The authors recommend strengthening mobile clinic operations through more routes, better schedules, and community notifications as the most practical short-term solution. View evidence ↗
- To bridge the healthcare gap, the authors conclude that the Pixley ka Seme and Namakwa districts specifically require expanded mobile clinics and telemedicine. View evidence ↗
- A limitation of the study is that travel-time calculations assumed consistent road conditions, ignoring that gravel roads can become impassable during rain events 2 to 4 times a year. View evidence ↗
- The authors note that the sample of 860 households might not fully represent the diversity of barriers faced in the most remote settlements. View evidence ↗
Visual summary
3 visualsIllustrations explain the paper; charts are replotted from the paper's own table values.
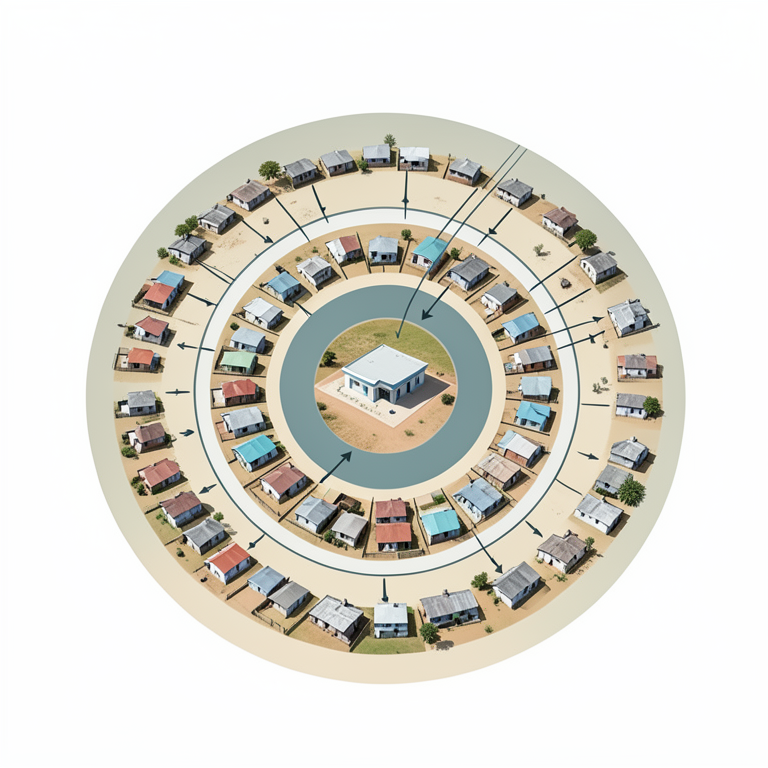
Distance-Decay Effect on Health
AI-generated conceptual illustration (A rural landscape in the Northern Cape province featuring a small medical clinic and scattered residential dwellings). It explains the idea and does not show study data.
View source evidence ↗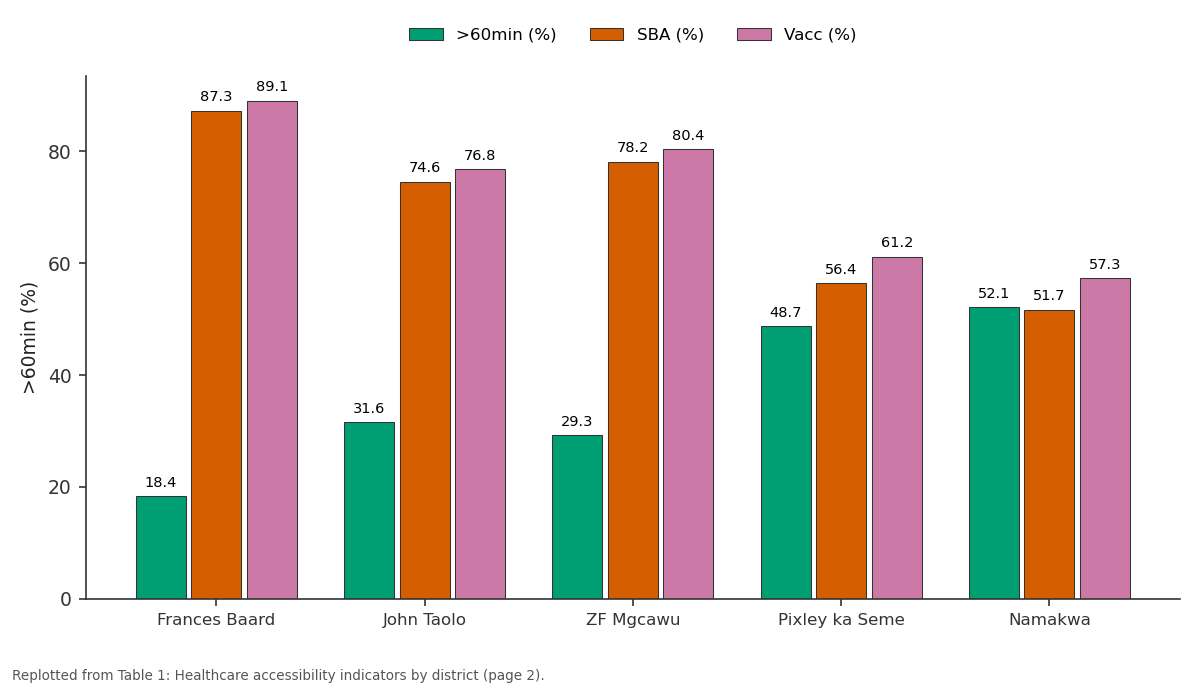
>60min (%) and SBA (%) and more: Frances Baard vs John Taolo vs ZF Mgcawu vs Pixley ka Seme vs Namakwa
Replotted from Table 1 (page 2) of the original paper. Every bar is the paper's own table value.
View source evidence ↗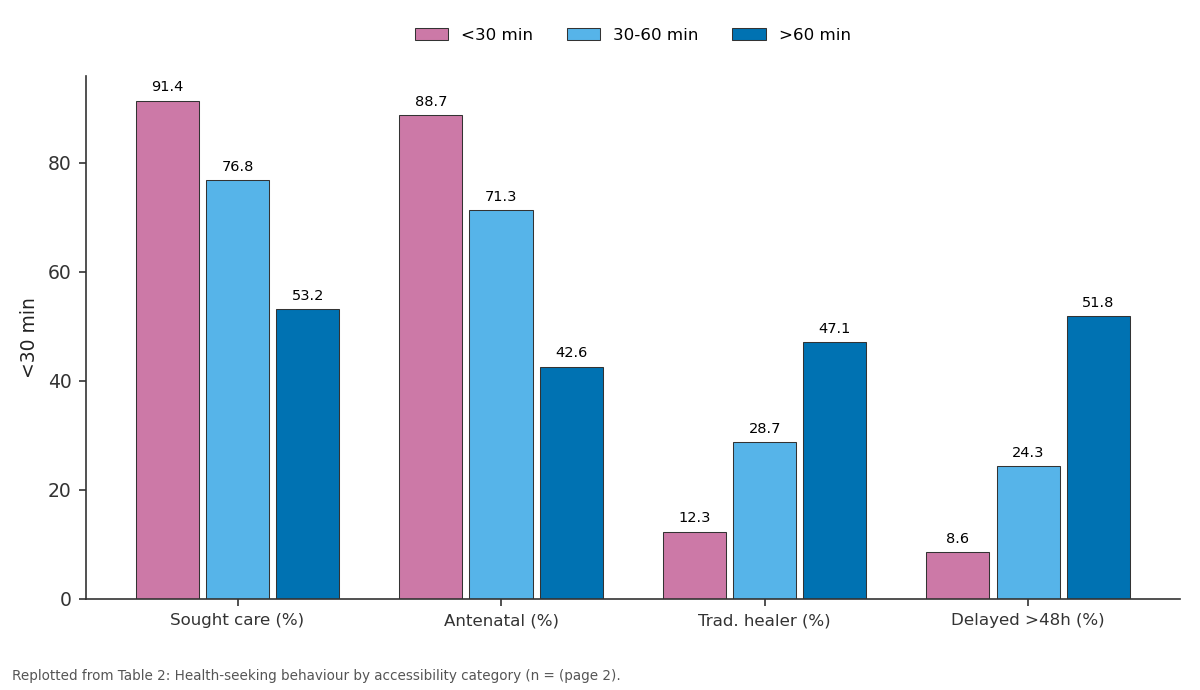
<30 min and 30-60 min and more: Sought care (%) vs Antenatal (%) vs Trad. healer (%) vs Delayed >48h (%)
Replotted from Table 2 (page 2) of the original paper. Every bar is the paper's own table value.
View source evidence ↗Figures & tables
From the original paper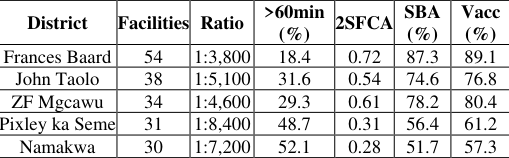 Table 1
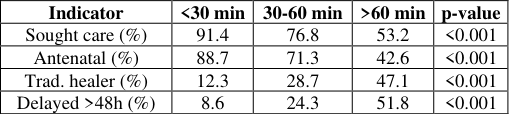 Table 2
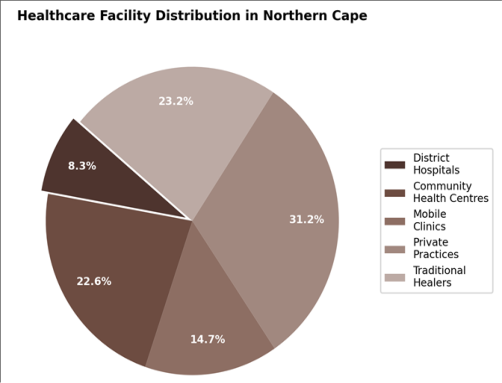 Figure 1
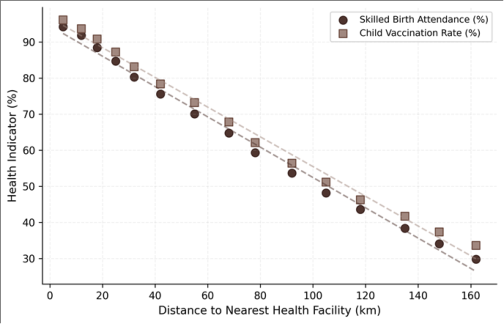 Figure 2
Introduction
Two patients with the same illness can face very different outcomes depending on where they live. This contrast defines healthcare accessibility [1]. Post-apartheid reforms expanded primary healthcare [2], but progress has been uneven. The Northern Cape’s population density of 3.4 persons per km² is the country’s lowest, with settlements separated by stretches of Karoo scrubland where distances between towns routinely exceed 100 km [3, 4].
GIS-based accessibility analysis has been applied in rural Kenya [5] and Bangladesh [6], but the Northern Cape’s extreme low density has received limited attention. This research mapped all health facilities in the province, computed travel-time service areas, and linked accessibility to maternal and child health indicators across districts. Theoretical Framework The two-step floating catchment area (2SFCA) method [7] computes an accessibility index accounting for facility supply and population demand. Each facility receives a service-to- population ratio within its catchment, which is then summed for all reachable facilities from each population point.
This was framed within Penchansky and Thomas’s five-dimension model [1] covering availability, accessibility, accommodation, affordability, and acceptability, with geographic accessibility as primary focus.
Materials And Methods
Materials Conducted at the Department of Marine Science, Canberra Centre for Geological Research, ACT, Australia, from February 2020 to December 2023. Facility data from the Northern Cape Department of Health’s 2021 register, verified through 94 field visits. Population from Statistics South Africa’s 2019 estimates. Road network from SANRAL.
Household survey (n = 860) across 43 wards stratified by district and settlement type.
Methods
All 187 facilities geocoded and classified. Network analysis in ArcGIS 10.8 computed driving-time isochrones (15, 30, 60, 120 min) with road speeds: 120 km/h national, 80 km/h regional, 40 km/h gravel, 20 km/h informal. The 2SFCA used 60-minute catchment. Health indicators from DHIS records 2020–2022.
Pearson correlation tested distance-health IJGGE 2025; 7(2): 111-113 James Thornton Department of Marine Science, Canberra Centre for Geological Research, ACT, Australia Sarah Whitfield Department of Marine Science, Canberra Centre for Geological Research, ACT, Australia James Thornton Department of Marine Science, Canberra Centre for Geological Research, ACT, Australia https://www.geojournal.net relationships. Chi-square compared health-seeking behaviour across categories.
Results
Table 1: Healthcare accessibility indicators by district municipality Vacc District Facilities Ratio >60min (%) 2SFCA SBA (%) (%) Frances Baard 54 1:3,800 18.4 0.72 87.3 89.1 John Taolo 38 1:5,100 31.6 0.54 74.6 76.8 ZF Mgcawu 34 1:4,600 29.3 0.61 78.2 80.4 Pixley ka Seme 31 1:8,400 48.7 0.31 56.4 61.2 Namakwa 30 1:7,200 52.1 0.28 51.7 57.3 Table 2: Health-seeking behaviour by accessibility category (n = 860) Indicator <30 min 30-60 min >60 min p-value Sought care (%) 91.4 76.8 53.2 <0.001 Antenatal (%) 88.7 71.3 42.6 <0.001 Trad. healer (%) 12.3 28.7 47.1 <0.001 Delayed >48h (%) 8.6 24.3 51.8 <0.001 Fig 1: Distribution of healthcare facility types in the Northern Cape Province outcomes: r = -0.97 for skilled birth attendance, r = -0.96 for vaccination (Figure 2). Households beyond 60 minutes were six times more likely to delay care past 48 hours (Table 2). Private practices concentrated in urban nodes (Figure 1).
| Indicator | <30 min | 30-60 min | >60 min | p-value |
|---|---|---|---|---|
| Sought care (%) | 91.4 | 76.8 | 53.2 | <0.001 |
| Antenatal (%) | 88.7 | 71.3 | 42.6 | <0.001 |
| Trad. healer (%) | 12.3 | 28.7 | 47.1 | <0.001 |
| Delayed >48h (%) | 8.6 | 24.3 | 51.8 | <0.001 |
Table text extracted from the original PDF; superscript letters are shown inline. The original table image is below.
View original table image
| District | Facilities | Ratio | >60min (%) | 2SFCA | SBA (%) | Vacc (%) |
|---|---|---|---|---|---|---|
| Frances Baard | 54 | 1:3,800 | 18.4 | 0.72 | 87.3 | 89.1 |
| John Taolo | 38 | 1:5,100 | 31.6 | 0.54 | 74.6 | 76.8 |
| ZF Mgcawu | 34 | 1:4,600 | 29.3 | 0.61 | 78.2 | 80.4 |
| Pixley ka Seme | 31 | 1:8,400 | 48.7 | 0.31 | 56.4 | 61.2 |
| Namakwa | 30 | 1:7,200 | 52.1 | 0.28 | 51.7 | 57.3 |
Table text extracted from the original PDF; superscript letters are shown inline. The original table image is below.
View original table image
Discussion
Ratios of 1:8,400 and 1:7,200 compare to rural Malawi and northern Mozambique [8], regions with far lower national incomes. The distance-decay pattern for skilled birth attendance (94.2% to 29.8%) mirrors rural Kenya [5] and Nepal [9], but distances here are larger. Some Namakwa settlements sit 200+ km from the nearest hospital with only gravel roads connecting them. Mobile clinics serve 28 routes but only 34% of households knew the schedule, and 41% reported missed visits.
Strengthening mobile operations with more routes, reliable schedules, and community notification represents the most practical short-term intervention [10]. Telemedicine could complement this for consultations not requiring physical examination. Limitations Travel-time calculations assumed consistent road conditions, but gravel roads become impassable during rain events occurring 2 to 4 times per year. The 2SFCA treats all facilities equally despite quality variation.
The 860- household sample may not capture the full diversity of access barriers in the most remote settlements. Traditional healers were mapped but their service quality and referral patterns were not assessed.
Conclusion
Geographic distance remains the dominant healthcare barrier in the Northern Cape, with 38.7% of the rural population beyond 60 minutes from a hospital. Health outcomes deteriorate sharply with distance. Pixley ka Seme and Namakwa need expanded mobile clinics and telemedicine options to bridge the gap in this vast, sparsely populated landscape.
Acknowledgements
Funding Sources Supported by institutional research allocations for health geography. Institutional Support Canberra Centre for Geological Research provided GIS infrastructure. Contributions Not Qualifying for Authorship Thanks to Northern Cape Department of Health for facility data.
Methodology
2004;5(2):119-139. 18. Mokgalaka H, Haangala S, Smit W. Health care access in South Africa: a GIS-based analysis. South African Geographical Journal. 2019;101(3):376-393. 19.
Perry B, Gesler W. Physical access to primary health care in Andean Bolivia. Social Science and Medicine. 2000;50(9):1177-1188. 20. Stock R.
Distance and the utilization of health facilities in rural Nigeria. Social Science and Medicine. 1983;17(9):563-570.
References
17 in the original paper- Penchansky R, Thomas JW. The concept of access. Medical Care. 1981;19(2):127-140.
- Harris B, Goudge J, Ataguba JE, McIntyre D. Inequities Fig 2: Distance to nearest facility versus health indicators across in access to health care in South Africa. Journal of Public Health Policy. 2011;32(S1):S102-S123.
- Coovadia H, Jewkes R, Barron P, Sanders D. The health and health system of South Africa. The Lancet. 2009;374(9692):817-834.
- Statistics South Africa. Provincial profile: Northern Cape. Report 03-01-73. 2014;1-92. Northern Cape settlements Comprehensive Interpretation The 2SFCA index ranged from 0.72 (Frances Baard) to 0.28 (Namakwa). Over half the rural population in Pixley ka Seme and Namakwa lived beyond 60 minutes from any hospital (Table 1). Distance correlated strongly with https://www.geojournal.net
- Noor AM, Amin AA, Gething PW, Atkinson PM. Modelling distances to government health services in Kenya. Tropical Medicine and International Health. 2006;11(2):188-196.
- Ahmed SM, Adams AM, Chowdhury M, Bhuiya A. Gender and health-seeking behaviour in Bangladesh. Social Science and Medicine. 2000;51(3):361-371.
- Luo W, Wang F. Measures of spatial accessibility to health care in a GIS environment. Environment and Planning B. 2003;30(6):865-884.
- Tanser F, Gijsbertsen B, Herbst K. Modelling primary health care accessibility in rural South Africa. Social Science and Medicine. 2006;63(3):691-705.
- Karkee R, Lee AH, Binns CW. Determinants of facility delivery in Nepal. Journal of Public Health. 2013;35(1):60-68.
- Guagliardo MF. Spatial accessibility of primary care: concepts, methods and challenges. International Journal of Health Geographics. 2004;3(1):3.
- McLaren ZM, Ardington C, Leibbrandt M. Distance decay and health care disparities in South Africa. BMC Health Services Research. 2014;14:541.
- Ricketts TC, Goldsmith LJ, Holmes GM, Randolph RK, Lee R, Taylor DH, et al. Designating places and populations as medically underserved. Journal of Health Care for the Poor and Underserved. 2007;18(3):567-589.
- Aday LA, Andersen R. A framework for the study of access to medical care. Health Services Research. 1974;9(3):208-220.
- Delamater PL, Messina JP, Grady SC, WinklerPrins V, Shortridge AM. Do more hospital beds lead to higher hospitalization rates? PLoS ONE. 2013;8(2):e54900.
- Cromley EK, McLafferty SL. GIS and public health, second edition. Guilford Press. 2011;1-503.
- Apparicio P, Abdelmajid M, Riva M, Shearmur R. Comparing alternative approaches to measuring spatial accessibility to health services. Journal of Transport Geography. 2008;16(1):1-12.
- Higgs G. A literature review of the use of GIS-based measures of access to health care services. Health Services and Outcomes Research