
Research article · 2025 · Full text
International Journal of Geography Geology and EnvironmentSoil erosion assessment by water using caesium-137 tracing in the loess plateau
Volume 7(4) · Pages 141–145 · DOI: 10.22271/27067483.2025.v7.i4b.609 ↗
Research areasSoil erosion and sediment transportAeolian processes and effectsEnvironmental and Agricultural Sciences
Abstract
Author-writtenA farmer on the Loess Plateau faces a practical dilemma: the deep, fertile loess that grows good wheat is also among the most erodible soil on Earth. This research applied caesium-137 (Cs-137) fallout tracing to estimate medium-term soil erosion rates across five land-use types in the Wuqi County area of the northern Loess Plateau, Shaanxi Province, China. Soil cores were collected from 73 points between April and October 2022, and Cs-137 inventories were measured by gamma spectrometry. A reference inventory of 2,480 Bq/m2 was established from undisturbed grassland. Erosion rates were estimated using the Mass Balance Model II for cultivated soils and the Profile Distribution Model for uncultivated sites. Results showed that 81.1% of points experienced net soil loss, with rates from 2.3 t/ha/yr on forest plantations to 47.8 t/ha/yr on steep sloping cropland. Terraced cropland showed 64.3% less erosion than unterraced slopes. Abandoned farmland undergoing revegetation showed intermediate inventories, suggesting partial recovery within 15-20 years. These data confirm that the Grain-for-Green programme is producing measurable erosion reductions and provide spatially distributed estimates that conventional plots cannot match.
Summary
Source-checkedPlain-language reading of the full paper, prepared with AI and checked against the text. Each point links to the authors' own words.
Why it matters
- The Loess Plateau is one of the most severely eroded areas on Earth, historically contributing over 1.6 billion tonnes of sediment annually to the Yellow River, which can lead to catastrophic flooding. View evidence ↗
- Traditional methods for measuring soil erosion, such as bounded runoff plots, are often expensive and difficult to scale due to edge effects. View evidence ↗
- The caesium-137 (Cs-137) tracing technique allows researchers to estimate soil loss or gain over approximately 40 years by comparing radionuclide inventories at sampling points against undisturbed reference sites. View evidence ↗
The question
- The study aimed to quantify erosion rate differences across various land uses and evaluate the effectiveness of terracing and the Grain-for-Green conversion program. View evidence ↗
What they did
- Researchers collected soil cores from 73 points across five land-use types in Wuqi County: reference grassland (5), forest plantation (14), terraced cropland (18), sloping cropland (21), and abandoned farmland (15). View evidence ↗
- Using a reference inventory of 2,480 +/- 124 Bq/m2, erosion rates were calculated using the Mass Balance Model II for cultivated sites and the Profile Distribution Model for uncultivated sites. View evidence ↗
- Soil quality analysis was performed on surface soil (0-20 cm) from all 73 points, measuring organic carbon, total nitrogen, available phosphorus, pH, and particle-size distribution. View evidence ↗
What they found
- The majority of sampling points (81.1%) experienced net soil loss, while only 12.3% remained within the tolerable soil loss range. View evidence ↗
- Terracing reduced soil erosion by 64.3% compared to sloping cropland, with a mean erosion rate of 12.4 t/ha/yr. View evidence ↗
- Forest plantations with 18-20-year-old tree cover showed the lowest erosion among land-use types at 2.3 t/ha/yr. View evidence ↗
- There was a strong negative correlation (r = -0.81) between erosion rates and soil organic carbon, indicating that erosion removes the nutrient-rich surface layer. View evidence ↗
- Soil structural resistance declined with erosion, as shown by the mean weight diameter of water-stable aggregates dropping from 1.37 mm at reference sites to 0.42 mm on sloping cropland. View evidence ↗
What it means
- The authors conclude that the Grain-for-Green land retirement strategy is effectively reducing soil erosion through natural revegetation. View evidence ↗
- Despite conservation efforts, soil loss remains a pervasive problem, with over 80% of sites exceeding the tolerable erosion threshold of 5 t/ha/yr. View evidence ↗
- The authors suggest that future research should use shorter-lived tracers to understand seasonal dynamics and include gully systems to better quantify the total sediment budget. View evidence ↗
Visual summary
3 visualsIllustrations explain the paper; charts are replotted from the paper's own table values.
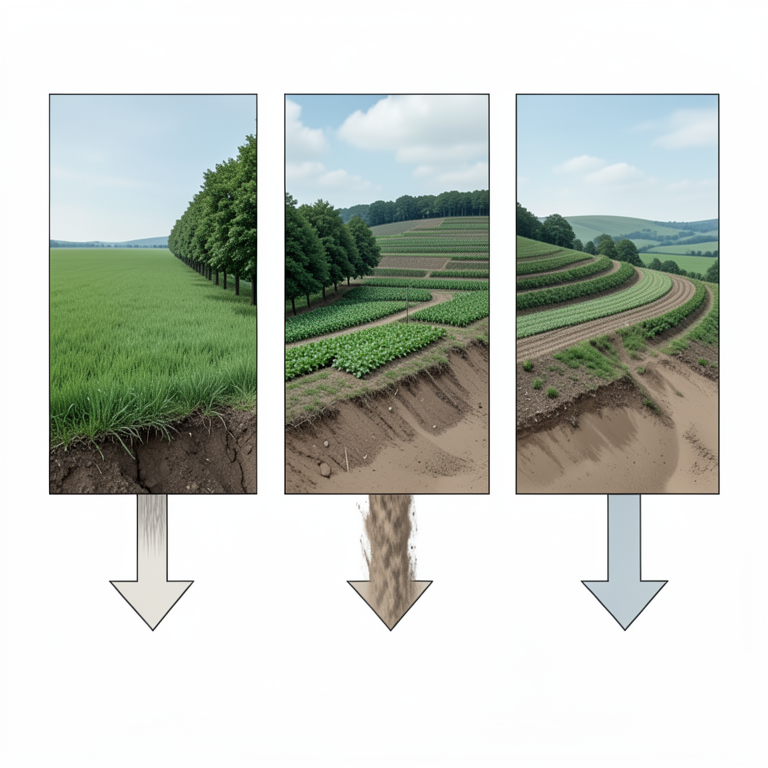
Comparison of Erosion Rates by Land Use
AI-generated conceptual illustration (Loess Plateau hillside with diverse land-use types). It explains the idea and does not show study data.
View source evidence ↗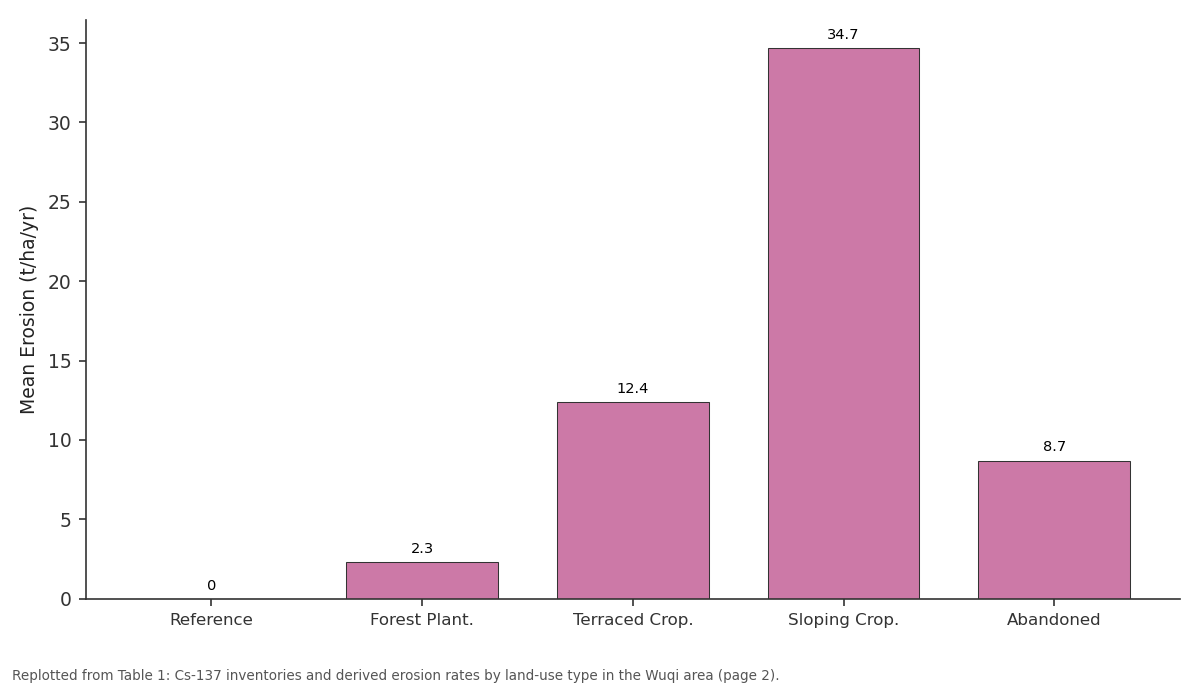
Mean Erosion (t/ha/yr): Reference vs Forest Plant. vs Terraced Crop. vs Sloping Crop. vs Abandoned
Replotted from Table 1 (page 2) of the original paper. Every bar is the paper's own table value.
View source evidence ↗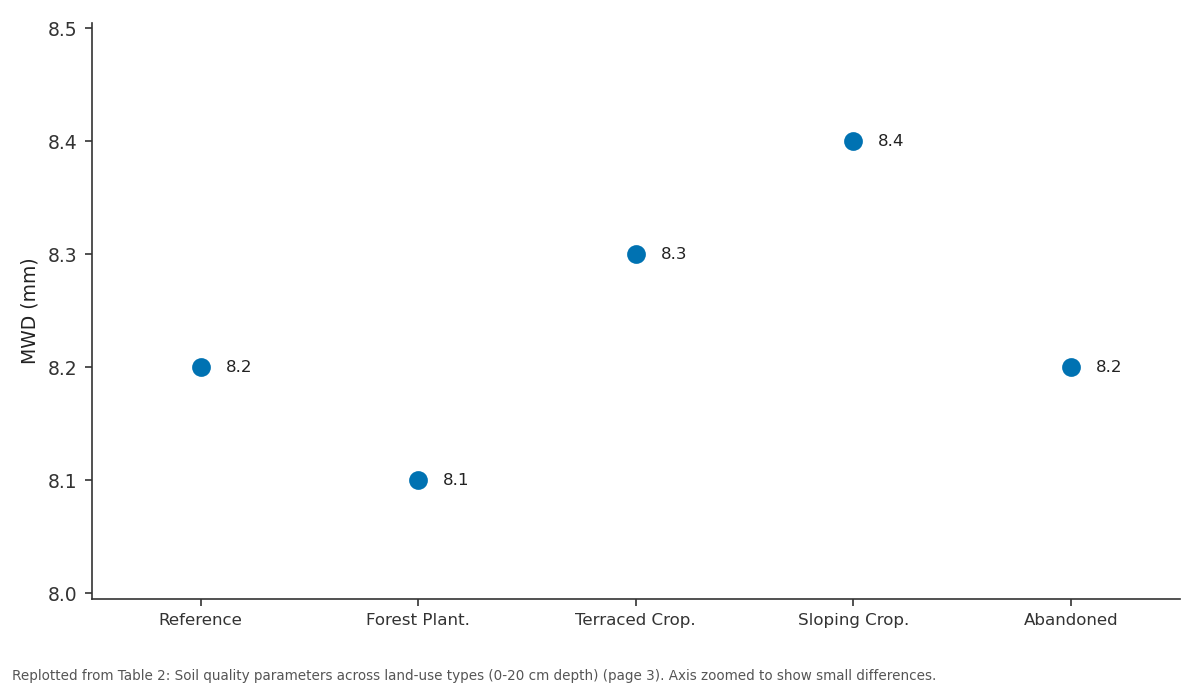
pH: Reference vs Forest Plant. vs Terraced Crop. vs Sloping Crop. vs Abandoned
Replotted from Table 2 (page 3) of the original paper. Every bar is the paper's own table value.
View source evidence ↗Figures & tables
From the original paper Table 1
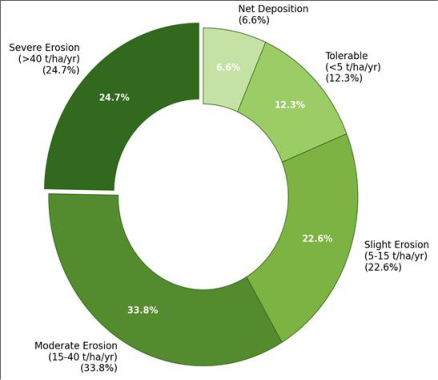 Figure 1
 Table 2
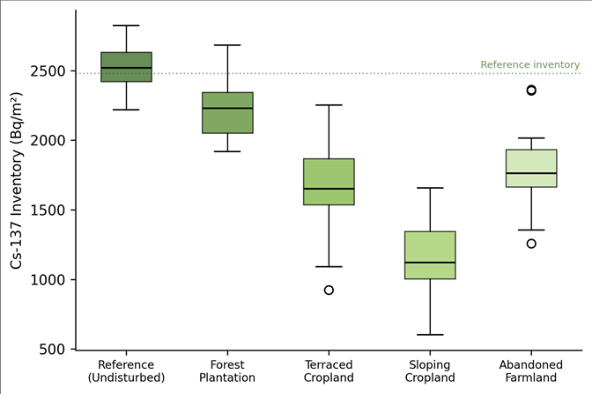 Figure 2
Introduction
How do you measure something that happens so slowly you can't see it but so relentlessly that it threatens the food security of 50 million people? That is the challenge of quantifying soil erosion on China's Loess Plateau, where wind-deposited silt mantles the landscape to depths of 100-300 m and where water erosion has carved the surface into a labyrinth of gullies, ravines, and terraced hillslopes [1] . The Loess Plateau is recognised as one of the most severely eroded regions on Earth, with annual sediment delivery to the Yellow River historically exceeding 1.6 billion tonnes-enough to raise the riverbed downstream and cause catastrophic floods [2] . Conventional erosion measurement relies on bounded runoff plots that are expensive, sensitive to edge effects, and difficult to scale up [3] . The Cs-137 technique offers an alternative: by comparing the inventory of this artificial radionuclide-deposited globally from nuclear weapons testing in the 1950s-1960s-at a sampling point with its inventory at an undisturbed reference site, researchers can estimate whether soil has been lost or gained over the approximately 40-year period since peak fallout [4] . The method has been applied worldwide, from tropical hillslopes to prairie fields [5] . On the Loess Plateau, several Cs-137 investigations have been published, mainly in the Ansai and Suide areas [6,7] . However, fewer data exist from the northern plateau around Wuqi County, which is of particular interest as one of the first areas targeted by China's Grain-for-Green programme-a massive land-use conversion launched in 1999 that paid farmers to retire steep cropland and plant trees or grass [8] . This research applied the Cs-137 technique to estimate medium-term erosion rates across five land-use types in the Wuqi area: undisturbed reference grassland, forest plantation, terraced cropland, sloping cropland, and abandoned farmland undergoing natural revegetation. The aim was to quantify how erosion rates differ among land uses, to evaluate the erosion-reduction benefit of terracing and the Grain-for-Green conversion, and to map the spatial pattern of erosion and deposition across representative hillslope catenas. Field sampling was conducted between April and October 2022, with gamma spectrometry performed at the Allahabad Academy of Coastal and Marine Research.
Seasonal Variations
The Loess Plateau experiences a continental monsoon climate with strongly seasonal rainfall. At Wuqi County (approximately 36.9 N, 108.2 E, elevation 1,280 m), mean annual precipitation is about 480 mm, of which 65-75% falls between June and September as intense convective storms [9] . Some storms deliver 30-50 mm in under an hour, generating the overland flow responsible for the bulk of annual soil loss. During 2022, total rainfall was 462 mm, close to the long-term average. The seasonal concentration of erosive rainfall means that Cs-137 redistribution patterns reflect cumulative summer storm damage over the past four decades, with winter freeze-thaw contributing secondarily through soil loosening [10] .
Materials and Methods
Materials and Methods
Materials
Soil cores were collected from 73 sampling points distributed across five land-use types in the Wuqi County area: undisturbed reference grassland (n = 5, on flat hilltops with no evidence of cultivation or grazing), forest plantation (Robinia pseudoacacia, planted 2002-2004, n = 14), terraced cropland (bench terraces under millet and potato, n = 18), sloping cropland (15-30 degree gradients, n = 21), and abandoned farmland (retired under Grain-for-Green between 1999 and 2007, now covered by natural grass and shrub, n = 15). At each point, a single bulk core was collected to a depth of 40 cm using a 7.8-cm-diameter stainless steel core tube driven vertically into the soil with a slide hammer [11] . Core locations were recorded with a Trimble R2 GNSS receiver. Cores were sectioned in the field at 5-cm intervals for the reference sites (to establish the depth distribution profile) and taken as bulk samples for all other sites.
Methods
Samples were air-dried, sieved to 2 mm, and packed into 500-mL Marinelli beakers for gamma spectrometry. Cs-137 was measured at 661.6 keV using a Canberra BEGe detector (38% relative efficiency, 50,000-second count time, uncertainties below 8% at 95% confidence) [12] . The reference inventory was 2,480 +/-124 Bq/m2. Erosion rates at cultivated sites were estimated using Mass Balance Model II (MBM-II), which accounts for tillage mixing [13] . Rates at uncultivated sites used the Profile Distribution Model (PDM), which assumes exponential decay of Cs-137 with depth [14] . Both models convert percentage inventory loss relative to reference into mean annual erosion (t/ha/yr) over approximately 40 years. All modelling used R 4.2.3.
Soil Quality Analysis
Surface soil (0-20 cm) was sampled at each of the 73 points for organic carbon (Walkley-Black method), total nitrogen (Kjeldahl), available phosphorus (Olsen method), pH (1:2.5 soil:water), and particle-size distribution (hydrometer method) [15] . These parameters were correlated with erosion rates to evaluate whether higher erosion translates into measurable fertility depletion. Soil aggregate stability was assessed using the wet-sieving method of Kemper and Rosenau [16] , reporting mean weight diameter (MWD) of water-stable aggregates as an indicator of structural resistance to erosion. Of the 73 sampling points, 59 (81.1%) showed Cs-137 inventories below the reference value, indicating net soil loss, while 9 (12.3%) fell within the tolerable range and 5 (6.6%) showed net deposition. Table 2 reports the soil quality parameters across land-use types. Organic carbon was lowest on sloping cropland (4.8 g/kg) and highest at reference sites (12.4 g/kg). The correlation between erosion rate and organic carbon was strongly negative (r = -0.81, p < 0.001), confirming that erosion selectively removes the organic-rich surface layer. Mean weight diameter of water-stable aggregates followed a similar pattern, ranging from 0.42 mm on sloping cropland to 1.37 mm at reference sites.
| Land Use | OC (g/kg) | Total N (g/kg) | Avail. P (mg/kg) | pH | MWD (mm) | Clay (%) |
|---|---|---|---|---|---|---|
| Reference | 12.4 +/- 1.8 | 1.14 +/- 0.18 | 8.7 +/- 1.4 | 8.2 | 1.37 | 18.4 |
| Forest Plant. | 10.8 +/- 2.1 | 0.97 +/- 0.21 | 7.4 +/- 1.8 | 8.1 | 1.18 | 17.1 |
| Terraced Crop. | 7.6 +/- 1.4 | 0.72 +/- 0.14 | 11.2 +/- 2.3 | 8.3 | 0.74 | 15.8 |
| Sloping Crop. | 4.8 +/- 1.2 | 0.48 +/- 0.11 | 5.3 +/- 1.1 | 8.4 | 0.42 | 12.3 |
| Abandoned | 8.9 +/- 1.6 | 0.84 +/- 0.16 | 6.8 +/- 1.6 | 8.2 | 0.96 | 16.4 |
Table text extracted from the original PDF; superscript letters are shown inline. The original table image is below.
View original table image
Results
Results
Discussion
The erosion rates documented here for sloping cropland on the Loess Plateau (mean 34.7 t/ha/yr, maximum 47.8 t/ha/yr) are among the highest reported for agricultural land anywhere in the world, and they are broadly consistent with earlier Cs-137 estimates from the neighbouring Ansai catchment [6] . To put these numbers in perspective, the widely cited tolerable soil loss rate for the Loess Plateau is 5 t/ha/yr-a threshold that only 12.3% of our sampling points met. On slopes exceeding 25 degrees, erosion exceeded the tolerable limit by a factor of seven to ten, confirming that steep-slope cultivation without conservation measures is fundamentally unsustainable on loess soils [17] . The 64.3% erosion reduction on terraced cropland compared with unterraced slopes is a striking result that validates the long Chinese tradition of bench-terrace construction on the Loess Plateau. Terraces work by reducing slope length and gradient, converting a long, steep hillslope into a series of short, near-level benches that limit the velocity and erosive power of surface runoff [18] . But terraces require maintenance-riser collapse and bench-surface compaction can reduce their effectiveness over time-and the 12.4 t/ha/yr mean erosion rate on terraced sites suggests that even well-maintained terraces do not fully eliminate the erosion problem on the steep loess terrain. The abandoned farmland category offers perhaps the most policy-relevant insight. These sites, retired under Grain-for-Green between 1999 and 2007, have been revegetating for 15-23 years and show Cs-137 inventories at 71.8% of reference-intermediate between cultivated and undisturbed land. The erosion rate of 8.7 t/ha/yr represents a 75% reduction relative to sloping cropland [19] . This trajectory suggests that natural revegetation alone can substantially reduce erosion within two decades, though full recovery may take considerably longer. The strong negative correlation between erosion rate and soil organic carbon (r = -0.81) highlights the self-reinforcing nature of erosion-induced degradation: as the organic-rich topsoil is stripped away, aggregate stability declines (MWD drops from 1.37 to 0.42 mm), making the remaining surface even more vulnerable to the next storm [20] . Breaking this cycle requires either physical structures (terraces) or biological cover (vegetation) to protect the surface-exactly the strategy that the Grain-for-Green programme has pursued. The coupling of erosion rate with soil quality data revealed a strong negative association between soil loss and organic carbon content, aggregate stability, and nutrient statusunderscoring the fertility cost of erosion that extends beyond mere topsoil thickness reduction. Sloping cropland sites had lost roughly 60% of their organic carbon relative to reference values, a deficit that will take decades to rebuild even under favourable revegetation conditions. The Cs-137 technique proved well suited to this landscape, providing spatially distributed erosion estimates integrated over approximately four decades. Future work should combine Cs-137 with shorter-lived tracers such as Pb-210ex and Be-7 to resolve decadal and seasonal erosion dynamics, and should extend sampling into gully systems that contribute a large but poorly quantified share of the total sediment budget [21] .
Conclusion
Conclusion
Acknowledgement
Acknowledgements Funding SourcesThis research was supported by general institutional research funds from the Allahabad Academy of Coastal and Marine Research. No external competitive grants were applied.
Figures and tables from the paper
| Land Use | n | Cs-137 (Bq/m2) | % of Reference | Mean Erosion (t/ha/yr) | Max Erosion (t/ha/yr) | Mean Slope (deg) | Model |
|---|---|---|---|---|---|---|---|
| Reference | 5 | 2,480 +/- 124 | 100.0 | 0.0 | 0.0 | < 3 | PDM |
| Forest Plant. | 14 | 2,190 +/- 210 | 88.3 | 2.3 | 6.8 | 18.4 | PDM |
| Terraced Crop. | 18 | 1,640 +/- 280 | 66.1 | 12.4 | 24.1 | 21.7 | MBM-II |
| Sloping Crop. | 21 | 1,120 +/- 340 | 45.2 | 34.7 | 47.8 | 24.3 | MBM-II |
| Abandoned | 15 | 1,780 +/- 260 | 71.8 | 8.7 | 18.4 | 20.1 | PDM |
Table text extracted from the original PDF; superscript letters are shown inline. The original table image is below.
View original table image
References
21 in the original paper- Shi H, Shao M. Soil and water loss from the Loess Plateau in China. Journal of Arid Environments. 2000;45(1):9-20.
- Xu JX. Sediment flux to the sea as influenced by changing human activities and precipitation: Example of the Yellow River, China. Environmental Management. 2003;31(3):328-341.
- Nearing MA, Govers G, Norton LD. Variability in soil erosion data from replicated plots. Soil Science Society of America Journal. 1999;63(6):1829-1835.
- Ritchie JC, McHenry JR. Application of radioactive fallout cesium-137 for measuring soil erosion and sediment accumulation rates and patterns: A review. Journal of Environmental Quality. 1990;19(2):215-233.
- Zapata F. The use of environmental radionuclides as tracers in soil erosion and sedimentation investigations. Kluwer Academic Publishers. 2002;1:1-583.
- Zhang X, Walling DE, Quine TA, Wen A. Use of reservoir deposits and caesium-137 measurements to investigate the erosional response of a small drainage basin in the rolling loess plateau region of China. Land Degradation and Development. 1997;8(1):1-16.
- Li Y, Poesen J, Yang JC, Fu B, Zhang JH. Evaluating gully erosion using 137Cs and 210Pb/137Cs ratio in a reservoir catchment. Soil and Tillage Research. 2003;69(1-2):107-115.
- Feng XM, Sun G, Fu BJ, Su CH, Liu Y, Lamparski H. Regional effects of vegetation restoration on water yield across the Loess Plateau, China. Hydrology and Earth System Sciences. 2012;16(8):2617-2628.
- Liu TS. Loess and the environment. China Ocean Press. 1985;1:1-251.
- Zhang T, Cai G, Liu S. Application of Cs-137 technique in estimating wind and water erosion rates on the Loess Plateau. Chinese Science Bulletin. 2003;48(12):1293-1299.
- Walling DE, He Q. Improved models for estimating soil erosion rates from cesium-137 measurements. Journal of Environmental Quality. 1999;28(2):611-622.
- IAEA. Use of 137Cs in the study of soil erosion and sedimentation. IAEA-TECDOC-1028. 1998;1:1-207.
- Walling DE, He Q, Quine TA. Use of caesium-137 and lead-210 as tracers in soil erosion investigations. IAHS Publication. 1995;229:163-172.
- Zhang XB, Higgitt DL, Walling DE. A preliminary assessment of the potential for using caesium-137 to estimate rates of soil erosion in the Loess Plateau of China. Hydrological Sciences Journal. 1990;35(3):243252.
- Walkley A, Black IA. An examination of the Degtjareff method for determining soil organic matter and a proposed modification of the chromic acid titration method. Soil Science. 1934;37(1):29-38.
- Kemper WD, Rosenau RC. Aggregate stability and size distribution. Methods of Soil Analysis, Part 1 (SSSA Book Series). 1986;1:425-442.
- Fu BJ, Zhao WW, Chen LD, Zhang QJ, Lu YH, Gulinck H. Assessment of soil erosion at large watershed scale using RUSLE and GIS: A case study in the Loess Plateau of China. Land Degradation and Development. 2005;16(1):73-85.
- Chen LD, Wei W, Fu BJ, Lu YH. Soil and water conservation on the Loess Plateau in China: Review and perspective. Progress in Physical Geography. 2007;31(4):389-403.
- Deng L, Shangguan ZP, Li R. Effects of the Grain-forGreen program on soil erosion in China. International Journal of Sediment Research. 2012;27(1):120-127.
- Liu GB, Xu MX, Ritsema C. A study of soil surface characteristics in a small watershed in the hilly, gullied area on the Chinese Loess Plateau. Catena. 2003;54(12):31-44.
- Mabit L, Benmansour M, Walling DE. Comparative advantages and limitations of the fallout radionuclides 137Cs, 210Pbex and 7Be for assessing soil erosion and sedimentation. Journal of Environmental Radioactivity. 2008;99(12):1799-1807