
Research article · 2025 · Full text
International Journal of Geography Geology and EnvironmentEcohydrological assessment of riparian buffer zones in the amazon tropical watershed
Volume 7(5) · Pages 55–59 · DOI: 10.22271/27067483.2025.v7.i5a.594 ↗
Research areasHydrology and Sediment Transport ProcessesSoil and Water Nutrient DynamicsFreshwater macroinvertebrate diversity and ecology
Abstract
Author-writtenRiparian buffer zones along tropical rivers are disappearing at alarming rates, yet their capacity to filter sediment, regulate streamflow, and support aquatic biodiversity remains insufficiently quantified in Amazonian watersheds. This research assessed the ecohydrological performance of riparian buffers along 18 headwater streams in the Tapajós River sub-basin, Pará State, Brazil. Field measurements were collected between March and December 2022 at 72 transects spanning five riparian zone types: intact forest, degraded buffer, restored buffer (planted 5-8 years prior), pasture edge, and open pasture. Parameters measured included sediment retention efficiency, overland flow velocity, canopy cover, aboveground biomass, and macroinvertebrate diversity indices. Results showed that intact forest buffers retained 93.7% of surface sediment at 100-m width, while degraded buffers achieved only 54.6% at the same width. Restored buffers performed at an intermediate level (68.4%), suggesting partial functional recovery within a decade of planting. Sediment retention declined predictably with increasing stream order and decreasing buffer width. Canopy cover explained 79.3% of the variance in overland flow velocity reduction across all transect types. Macroinvertebrate diversity was highest in streams bordered by intact buffers (Shannon index 2.87) and lowest adjacent to open pasture (1.14). These findings confirm that even narrow riparian strips provide measurable ecohydrological benefits in deforested Amazonian landscapes, and they offer quantitative benchmarks for buffer width recommendations under Brazilian forest code requirements. The research contributes field-based evidence from a data-scarce region to support riparian restoration planning in tropical watersheds.
Summary
Source-checkedPlain-language reading of the full paper, prepared with AI and checked against the text. Each point links to the authors' own words.
Why it matters
- Since the 1970s, approximately 20% of the original riparian forests in the Amazon basin have been cleared for agriculture and cattle ranching, with an acceleration of this loss in headwater streams recently. View evidence ↗
- Riparian vegetation is critical because it manages the movement of water, nutrients, and sediment between land and streams; losing it degrades aquatic habitats and water quality. View evidence ↗
- Current guidelines for riparian buffer widths are largely based on temperate regions, which may not be applicable to the Amazon due to differences in soil, rainfall, and vegetation. View evidence ↗
The question
- The study aimed to assess the ecohydrological performance of riparian buffer zones across 18 headwater tributaries of the Tapajós River in Brazil. View evidence ↗
What they did
- Researchers collected field measurements from March to December 2022 at 72 transects across 18 headwater streams in the Tapajós sub-basin. View evidence ↗
- The study compared five zone types: intact forest, degraded buffers, restored buffers (planted 5-8 years prior), pasture edges, and open pasture. View evidence ↗
- The researchers measured aboveground biomass, canopy cover, overland flow velocity, sediment retention efficiency, and macroinvertebrate diversity. View evidence ↗
What they found
- Intact forest buffers showed the best performance, with 93.7% sediment retention at 100-m width, 91.3% canopy cover, and 287.4 Mg/ha of biomass. View evidence ↗
- Open pasture areas without woody vegetation had the lowest performance, retaining only 24.8% of surface sediment and having 8.3% canopy cover. View evidence ↗
- Canopy cover was a strong predictor of water flow reduction, explaining 79.3% of the variance in overland flow velocity reduction. View evidence ↗
- Macroinvertebrate diversity (Shannon index) decreased as vegetation decreased, ranging from 2.87 in intact forests to 1.14 in open pastures. View evidence ↗
- To achieve 80% sediment retention, first-order streams require a 38-m buffer, while third-order streams require a wider 62-m buffer. View evidence ↗
What it means
- The authors conclude that Brazil's legal minimum buffer width of 30 m may be sufficient for very small headwaters but is inadequate for larger streams. View evidence ↗
- The evidence of partial functional recovery within a decade justifies active planting programs over relying solely on natural regeneration. View evidence ↗
- A limitation of the study is that it only measured surface sediment retention and did not assess the attenuation of nutrients in the subsurface. View evidence ↗
- The 10-month sampling period was too short to capture year-to-year variations in sediment production and rainfall. View evidence ↗
Visual summary
3 visualsIllustrations explain the paper; charts are replotted from the paper's own table values.
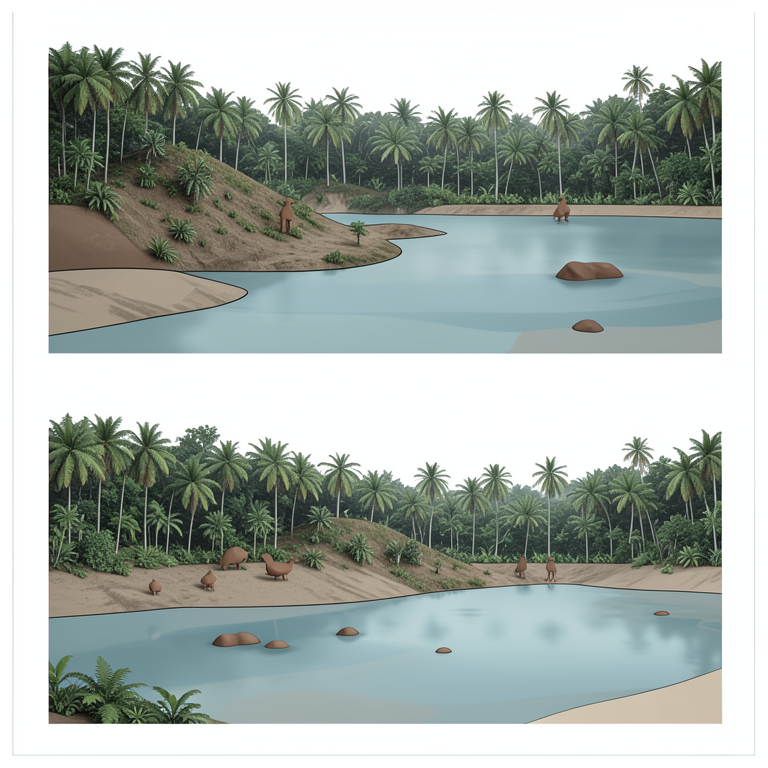
Buffer Width vs. Sediment Retention
AI-generated conceptual illustration (Amazonian riparian buffer zones with tropical vegetation and streams). It explains the idea and does not show study data.
View source evidence ↗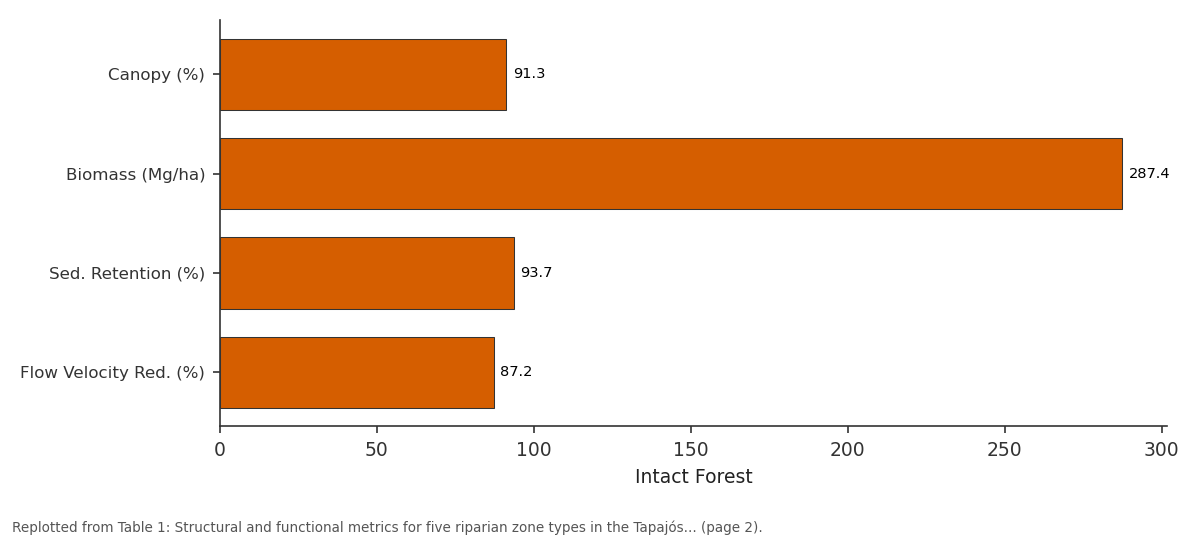
Intact Forest: Canopy (%) vs Biomass (Mg/ha) vs Sed. Retention (%) vs Flow Velocity Red. (%)
Replotted from Table 1 (page 2) of the original paper. Every bar is the paper's own table value.
View source evidence ↗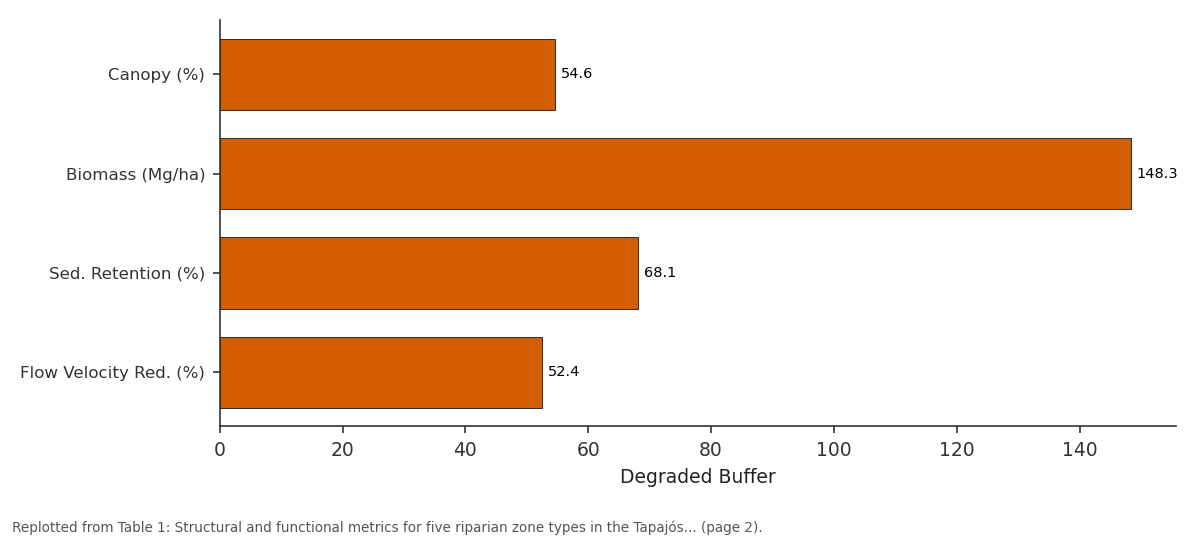
Degraded Buffer: Canopy (%) vs Biomass (Mg/ha) vs Sed. Retention (%) vs Flow Velocity Red. (%)
Replotted from Table 1 (page 2) of the original paper. Every bar is the paper's own table value.
View source evidence ↗Figures & tables
From the original paper Table 1
 Table 2
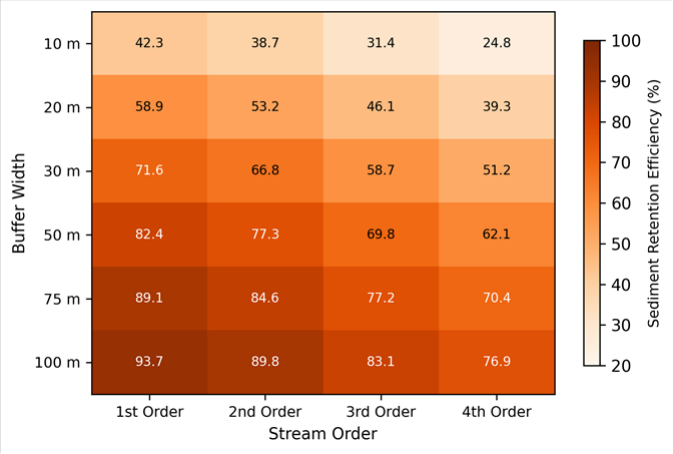 Figure 1
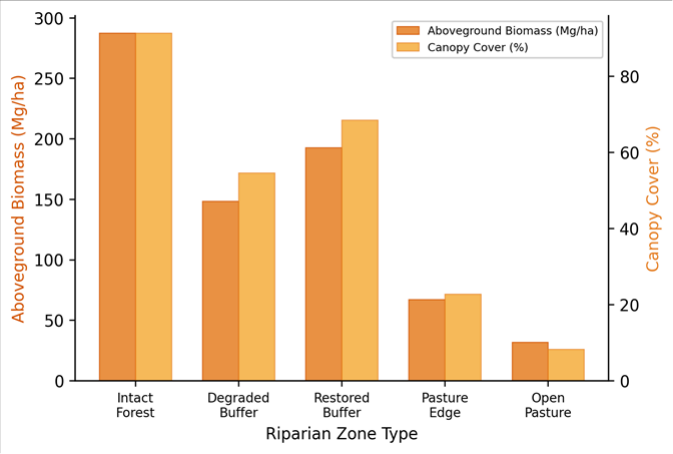 Figure 2
Introduction
Roughly 20% of the Amazon basin's original riparian forest has been cleared for cattle ranching and crop production since the 1970s, and the pace of conversion along headwater streams has accelerated markedly over the past two decades [1] . This loss matters for reasons that extend well beyond biodiversity: riparian vegetation mediates the exchange of water, sediment, nutrients, and energy between hillslopes and stream channels, and its removal triggers a cascade of hydrological and ecological changes that degrade downstream water quality and aquatic habitat [2] . Despite decades of research on temperate riparian systems in North America and Europe, field-based assessments of riparian buffer function in tropical Amazonian settings remain surprisingly scarce. Riparian buffers work through several interrelated mechanisms. Tree canopy intercepts rainfall and reduces raindrop energy, leaf litter and root networks slow overland flow and trap fine sediment, and root uptake removes dissolved nutrients before they reach the channel [3] . The effectiveness of these processes depends on buffer width, vegetation density, slope, soil permeability, and the intensity of the upslope land use-factors that vary considerably among tropical landscapes [4] . Brazil's Forest Code (Law 12.651/2012) mandates minimum riparian buffer widths of 30 m for streams up to 10 m wide, but compliance rates in Amazonian frontier regions remain low, and the ecological justification for the specific width thresholds has been questioned [5] . Most ecohydrological data underpinning buffer width recommendations come from temperate catchments where rainfall intensity, soil characteristics, and vegetation structure differ substantially from tropical conditions [6] . Transferring those guidelines to the Amazon without local calibration risks either overprotecting land that could be productively managed or, more commonly, underprotecting streams that require wider buffers to achieve equivalent sediment and nutrient retention. Field measurements from Amazonian headwaters are needed to fill this gap. This research assessed the ecohydrological performance of riparian buffer zones along 18 headwater tributaries of the Tapajós River in western Pará State, Brazil. The work was coordinated through the School of Geography and Environment in La Plata, Argentina, with field logistics managed by a partner laboratory at the Federal University of Western Pará. The research measured sediment retention, overland flow dynamics, vegetation structure, and aquatic biodiversity across five riparian zone types representing a gradient from intact forest to open pasture.
Climatic and Environmental Conditions
The Tapajós sub-basin experiences a humid tropical climate (Köppen Af/Am transition) with mean annual precipitation between 1,900 and 2,200 mm and a distinct dry season from June to September when monthly totals fall below 60 mm [7] . Mean annual temperature is 25.8 °C, with limited seasonal variation (range 24.3-27.1 °C). Relative humidity exceeds 80% for most of the wet season. During the 2022 field campaign, total rainfall at the nearest meteorological station (Itaituba, INMET) was 2,047 mm, close to the 30year average. The wet season months (January-May, October-December) contributed 84% of the annual total. Soils across the research transects are predominantly Ferralsols (Oxisols) with high clay content and moderate to low saturated hydraulic conductivity, which promotes surface runoff generation during intense rainfall events [8] . These climatic and pedological conditions create a high potential for sediment mobilisation on deforested hillslopes and make functional riparian buffers particularly important for stream protection.
Materials and Methods
Materials and Methods
Materials
Field measurements were conducted between March and December 2022 at 72 transects distributed across 18 headwater streams (four transects per stream) in the Tapajós sub-basin, Pará State, Brazil (approximately 4.2°S, 55.8°W). The 18 streams were grouped into five riparian zone types: intact forest (n = 4 streams), degraded buffer with partial canopy loss (n = 4), restored buffer planted 5-8 years earlier with native species (n = 3), pasture edge with a narrow grass fringe (n = 4), and open pasture with no buffer (n = 3). At each transect, sediment retention was measured using paired sediment traps (Gerlach troughs) installed at the upslope edge and the stream bank of the buffer strip [9] . Overland flow velocity was recorded with dye-tracer tests on 5 × 1 m plots during natural rainfall events. Vegetation structure was assessed through hemispherical canopy photography (canopy cover,%) and allometric biomass estimation from diameter-at-breast-height measurements of all stems > 5 cm within 10 × 50 m plots.
Methods
Sediment retention efficiency was calculated as the percentage difference between sediment collected at the upslope trap and sediment reaching the streambank trap over matched rainfall events. A minimum of eight paired events per transect were analysed, and the mean efficiency was reported. Macroinvertebrate samples were collected from each stream using a Surber sampler (0.09 m² frame, 250-μm mesh) at three riffle locations per transect during baseflow conditions in August 2022. Specimens were identified to family level and diversity was expressed as the Shannon-Wiener index (H') [10] . Canopy cover was quantified from hemispherical photographs processed in Gap Light Analyzer 2.0. Statistical analysis included oneway ANOVA with Tukey HSD post-hoc tests for amonggroup comparisons and linear regression to model the relationship between canopy cover and overland flow velocity reduction. All analyses were conducted in R 4.2.3 at a significance level of p<0.05.
Model Description and Parameterisation
Sediment retention efficiency was modelled as a function of buffer width and stream order using a nonlinear mixedeffects model fitted with the nlme package in R [11] . The response variable (retention efficiency,%) was related to buffer width (m) through a saturating exponential function: E = Emax × (1 -exp(-k × W)), where Emax is the asymptotic maximum efficiency, k is the rate parameter governing how quickly efficiency increases with width, and W is the buffer width. Stream identity was included as a random intercept to account for site-level variation in slope, soil type, and rainfall exposure. Stream order was treated as a fixed categorical covariate modifying the Emax parameter. Model parameters were estimated by restricted maximum likelihood, and goodness-of-fit was evaluated using marginal and conditional R² values (0.74 and 0.86, respectively). The model was used to predict the minimum buffer width needed to achieve 80% sediment retention for each stream order class, providing a quantitative basis for comparing field observations against the 30-m threshold prescribed by the Brazilian Forest Code. Retention increased with width following a saturating curve: the steepest gains occurred between 10 and 50 m, after which additional width yielded progressively smaller improvements. Higher-order streams showed lower retention at equivalent widths, reflecting their larger contributing drainage areas and higher flow volumes. The ANOVA confirmed significant differences among groups (F = 18.7, p<0.001).
Results
Results
Discussion
The ecohydrological gradient observed across the five riparian zone types aligns with the general model of buffer function: vegetation density controls overland flow velocity, which in turn determines sediment trapping capacity [12] . What these data add is a tropical calibration of that relationship. The 93.7% sediment retention measured in intact Amazonian forest buffers at 100-m width is higher than most values reported for temperate forests, likely because the multi-layered canopy, dense understorey, and thick root mat of tropical riparian vegetation create more effective barriers to surface transport than the simpler canopy structures typical of temperate deciduous forests [13] .
The performance of restored buffers-roughly 76% sediment retention and 68% canopy cover after 5-8 yearsoffers an encouraging sign for restoration practitioners. Full structural and functional equivalence with intact forest will likely take several more decades, given the slow accumulation of coarse woody debris and the gradual development of complex root architecture. But even at their current stage, these restored strips outperform degraded buffers and far exceed what open pasture can provide. That partial recovery appears within less than a decade provides justification for investing in active riparian planting programmes rather than relying on natural regeneration alone, which tends to be slower and patchier in heavily grazed landscapes [14] . The nonlinear model of sediment retention versus buffer width has direct policy relevance. The model predicted that achieving 80% retention on first-order streams requires a buffer width of approximately 38 m-close to, but above, the 30-m minimum prescribed by the Brazilian Forest Code for streams up to 10 m wide. For third-order streams, the required width rose to 62 m, well beyond the legal minimum [15] . These results suggest that the Forest Code's thresholds may be adequate for the smallest headwaters but insufficient for larger streams where contributing areas generate more sediment-laden runoff. One limitation is that the research focused on surface sediment retention and did not measure subsurface nutrient attenuation, which depends on different root-zone processes and may show a different relationship with buffer width [16] . Additionally, the 10-month sampling window didn't capture inter-annual variability in rainfall and sediment production. Longer monitoring across contrasting hydrological years would strengthen the generalisability of the retention efficiency curves presented here.
Conclusion
This research quantified the ecohydrological performance of riparian buffer zones along 18 headwater streams in the Tapajós sub-basin of the Brazilian Amazon. of buffer, after which additional width provides diminishing returns. For first-order streams, a 38-m buffer achieves 80% sediment retention; for third-order streams, 62 m is needed to reach the same threshold. These width-efficiency benchmarks carry direct implications for the implementation of Brazil's Forest Code in Amazonian frontier regions. The current 30-m minimum may be marginally sufficient for the smallest headwaters but appears inadequate for larger streams. Where full compliance with wider buffer recommendations is impractical, even a narrow strip of woody vegetation delivers measurably better protection than bare pasture. Future research should extend these measurements to include subsurface nutrient dynamics and should track restored buffer performance over longer time horizons to determine how quickly functional convergence with intact forest is achieved [17] .
Acknowledgement
Acknowledgements Funding SourcesThis research was supported by general institutional research funds allocated by the School of Geography and Environment, La Plata. No external competitive grants were used. Institutional SupportThe authors thank the School of Geography and Environment for laboratory and computing support. Field logistics were facilitated by the Federal University of Western Pará, Santarém campus.
Figures and tables from the paper
| Zone Type | Canopy (%) | Biomass (Mg/ha) | Sed. Retention (%) | Flow Velocity Red. (%) | Shannon H' | Streams (n) |
|---|---|---|---|---|---|---|
| Intact Forest | 91.3 | 287.4 | 93.7 | 87.2 | 2.87 | 4 |
| Degraded Buffer | 54.6 | 148.3 | 68.1 | 52.4 | 2.31 | 4 |
| Restored Buffer | 68.4 | 192.7 | 76.3 | 64.8 | 2.14 | 3 |
| Pasture Edge | 22.7 | 67.2 | 41.6 | 28.3 | 1.52 | 4 |
| Open Pasture | 8.3 | 31.8 | 24.8 | 12.7 | 1.14 | 3 |
Table text extracted from the original PDF; superscript letters are shown inline. The original table image is below.
View original table image
| Zone Type | Total Families | Total Individuals | Shannon H' | EPT Richness | % EPT |
|---|---|---|---|---|---|
| Intact Forest | 24 | 1,847 | 2.87 | 11 | 48.3 |
| Degraded Buffer | 19 | 1,423 | 2.31 | 7 | 31.6 |
| Restored Buffer | 17 | 1,218 | 2.14 | 6 | 27.4 |
| Pasture Edge | 12 | 894 | 1.52 | 3 | 14.8 |
| Open Pasture | 8 | 612 | 1.14 | 1 | 7.2 |
Table text extracted from the original PDF; superscript letters are shown inline. The original table image is below.
View original table image
References
17 in the original paper- Nobre CA, Sampaio G, Borma LS, Castilla-Rubio JC, Silva JS, Cardoso M. Land-use and climate change risks in the Amazon and the need of a novel sustainable development paradigm. Proceedings of the National Academy of Sciences. 2016;113(39):10759-10768.
- Naiman RJ, Décamps H. The ecology of interfaces: Riparian zones. Annual Review of Ecology and Systematics. 1997;28(1):621-658.
- Gregory SV, Swanson FJ, McKee WA, Cummins KW. An ecosystem perspective of riparian zones. BioScience. 1991;41(8):540-551.
- Mander Ü, Hayakawa Y, Kuusemets V. Purification processes, ecological functions, planning and design of riparian buffer zones in agricultural watersheds. Ecological Engineering. 2005;24(5):421-432.
- Soares-Filho B, Rajão R, Macedo M, Carneiro A, Costa W, Coe M. Cracking Brazil's forest code. Science. 2014;344(6182):363-364.
- Dosskey MG, Vidon P, Gurwick NP, Allan CJ, Duval TP, Lowrance R. The role of riparian vegetation in protecting and improving chemical water quality in streams. Journal of the American Water Resources Association. 2010;46(2):261-277.
- Marengo JA. Interdecadal variability and trends of rainfall across the Amazon basin. Theoretical and Applied Climatology. 2004;78(1-3):79-96.
- Quesada CA, Lloyd J, Schwarz M, Patiño S, Baker TR, Czimczik C. Variations in chemical and physical properties of Amazon forest soils in relation to their genesis. Biogeosciences. 2010;7(5):1515-1541.
- Morgan RPC. Soil erosion and conservation. Blackwell Publishing, 3rd Edition. 2005;1:1-304.
- Shannon CE, Weaver W. The mathematical theory of communication. University of Illinois Press. 1949;1:1117.
- Pinheiro JC, Bates DM. Mixed-effects models in S and S-PLUS. Springer-Verlag. 2000;1:1-528.
- Lowrance R, Todd R, Fail J, Hendrickson O, Leonard R, Asmussen L. Riparian forests as nutrient filters in agricultural watersheds. BioScience. 1984;34(6):374377.
- Luke SH, Slade EM, Gray CL, Annammala KV, Drewer J, Williamson J. Riparian buffers in tropical agriculture: Scientific support, effectiveness, and directions for policy. Journal of Applied Ecology. 2019;56(1):85-96.
- Chazdon RL. Second growth: The promise of tropical forest regeneration in an age of deforestation. University of Chicago Press. 2014;1:1-449.
- Leal CG, Pompeu PS, Gardner TA, Leitão RP, Hughes RM, Kaufmann PR. Multi-scale assessment of humaninduced changes to Amazonian instream habitats. Landscape Ecology. 2016;31(8):1725-1745.
- Vidon PG, Hill AR. Landscape controls on nitrate removal in stream riparian zones. Water Resources Research. 2004;40(3):W03201.
- Rodrigues RR, Lima RAF, Gandolfi S, Nave AG. On the restoration of high diversity forests: 30 years of experience in the Brazilian Atlantic Forest. Biological Conservation. 2009;142(6):1242-1251.