
Research article · 2025 · Full text
International Journal of Geography Geology and EnvironmentGeoarchaeological investigation of prehistoric settlement patterns in the Indus valley
Volume 7(5) · Pages 84–88 · DOI: 10.22271/27067483.2025.v7.i5b.595 ↗
Research areasArchaeological Research and ProtectionSoil and Environmental StudiesArchaeology and ancient environmental studies
Abstract
Author-writtenGeoarchaeology applies earth science methods to archaeological questions, and nowhere is this marriage of disciplines more productive than in the Indus Valley, where shifting river courses and climate fluctuations shaped one of humanity's earliest urban civilisations. This research investigated the relationship between geomorphic setting and prehistoric settlement distribution across a 6,800 km² transect in the Cholistan Desert and adjacent alluvial plains of southern Punjab, Pakistan. A total of 88 previously documented archaeological sites spanning four cultural phases—Early Harappan (3300-2600 BCE), Mature Harappan (2600-1900 BCE), Late Harappan (1900-1300 BCE), and Post-Urban (1300-600 BCE)—were classified according to their geomorphic position using SRTM digital elevation models, Landsat 8 multispectral imagery, and field verification conducted between February and October 2022. Five geomorphic settings were identified: active floodplain, alluvial terrace T1, alluvial terrace T2, piedmont fan, and upland plateau. Artifact surface density was measured at 25 randomly selected sites across these settings. Results showed that alluvial terrace T2 hosted the highest concentration of Mature Harappan settlements (68.4% of all sites from that phase) and displayed the greatest artifact density (median 47.3 pieces/m²). Settlement numbers peaked during the Mature Harappan phase (38 sites), coinciding with a palaeomoisture index maximum of 0.84, and declined sharply during the Late Harappan and Post-Urban phases as the moisture index fell to 0.51 and 0.38 respectively. The correlation between settlement count and palaeomoisture (r = 0.93, p<0.05) suggests that hydrological availability was the primary landscape factor governing settlement persistence. These findings support the hypothesis that the drying of the Ghaggar-Hakra palaeochannel system contributed to the eastward and southward dispersal of Late Harappan populations. The geoarchaeological framework developed here links geomorphic mapping to cultural chronology and may be applied to other ancient riverine civilisations facing analogous questions about environment-settlement interaction.
Summary
Source-checkedPlain-language reading of the full paper, prepared with AI and checked against the text. Each point links to the authors' own words.
Why it matters
- Geoarchaeology is highly effective in the Indus Valley because the region's early urban civilizations were significantly shaped by climate fluctuations and shifting river courses. View evidence ↗
- A major unresolved question in the study of the Indus Valley is the cause of the civilization's fragmentation and contraction after approximately 1900 BCE. View evidence ↗
- Evidence from various palaeoclimate proxies indicates that the Indian Summer Monsoon weakened between 2200 and 1900 BCE. View evidence ↗
The question
- The study aimed to fill a research gap by relating the geomorphic settings of 88 sites to their artifact density and correlating these patterns with a palaeomoisture index. View evidence ↗
What they did
- The research was conducted across a transect in the eastern Cholistan Desert and alluvial plains of southern Punjab, Pakistan. View evidence ↗
- Artifact surface density was measured at 25 randomly selected sites using three 1x1 meter quadrats per site to count ceramic, lithic, and bone fragments. View evidence ↗
What they found
- Alluvial terrace T2 was the most preferred settlement location, containing 59.1% (52 of 88) of all sites, peaking at 26 sites during the Mature Harappan phase. View evidence ↗
- Terrace T2 had the highest median artifact density at 47.3 pieces/m², significantly higher than terrace T1 (31.8 pieces/m²) and piedmont fans (16.4 pieces/m²). View evidence ↗
- Settlements peaked at 38 sites during the Mature Harappan phase (moisture index 0.84) and declined as moisture fell to 0.51 in the Late Harappan and 0.38 in the Post-Urban phase. View evidence ↗
- A generalized linear model (GLM) showed that palaeomoisture explained significant additional variance in site distribution beyond the geomorphic setting alone (p < 0.001). View evidence ↗
What it means
- The authors conclude that the drying of the Ghaggar-Hakra palaeochannel system likely drove the dispersal of Late Harappan populations toward the east and south. View evidence ↗
- The authors recommend their combined framework of satellite mapping, artifact surveys, and environmental correlation as a replicable method for studying other ancient riverine civilizations. View evidence ↗
- The study is limited by its reliance on surface surveys; subsurface excavations are needed to identify buried occupation layers. View evidence ↗
- The palaeomoisture index was derived from a source 400 km away, meaning local conditions in the research area might have differed from the regional proxy. View evidence ↗
Visual summary
4 visualsIllustrations explain the paper; charts are replotted from the paper's own table values.
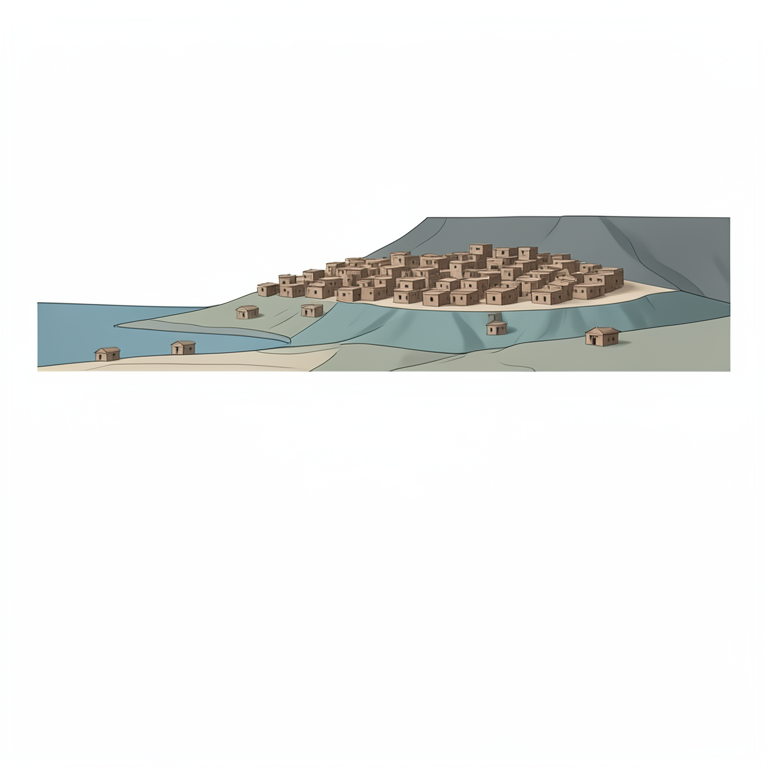
Settlement Preference by Landform
AI-generated conceptual illustration (Indus Valley prehistoric settlement landscape featuring alluvial terraces and floodplains). It explains the idea and does not show study data.
View source evidence ↗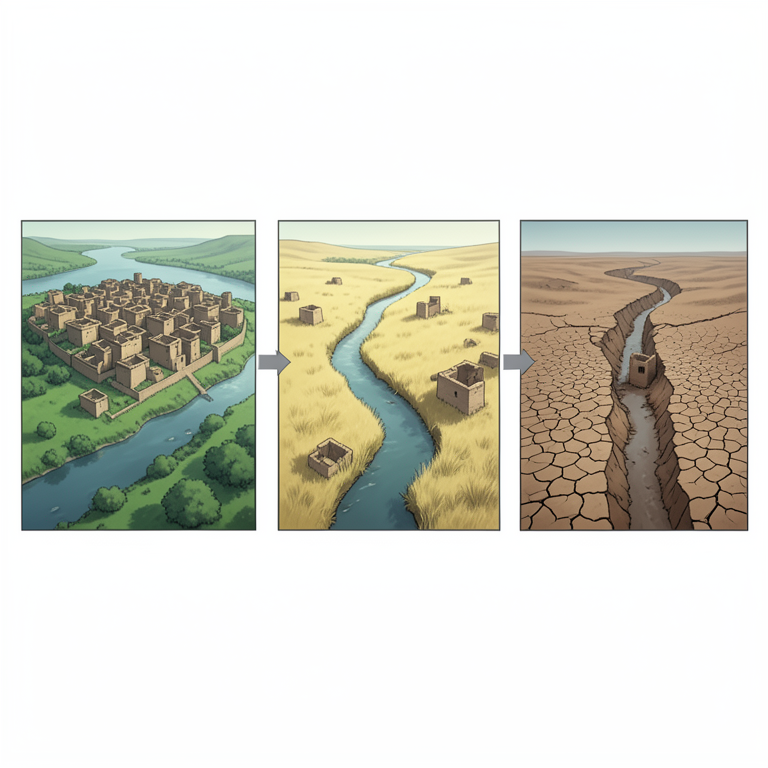
Moisture and Settlement Correlation
AI-generated conceptual illustration (Ancient Indus Valley river basin landscape with mud-brick settlements). It explains the idea and does not show study data.
View source evidence ↗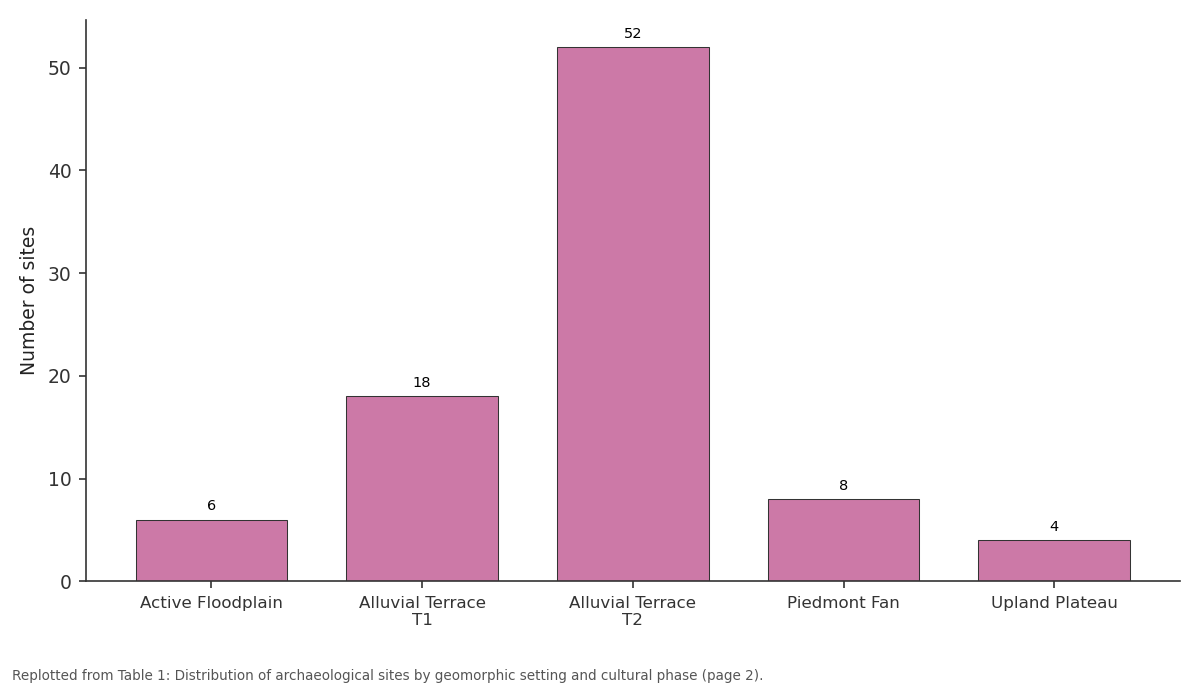
Total: Active Floodplain vs Alluvial Terrace T1 vs Alluvial Terrace T2 vs Piedmont Fan vs Upland Plateau
Replotted from Table 1 (page 2) of the original paper. Every bar is the paper's own table value.
View source evidence ↗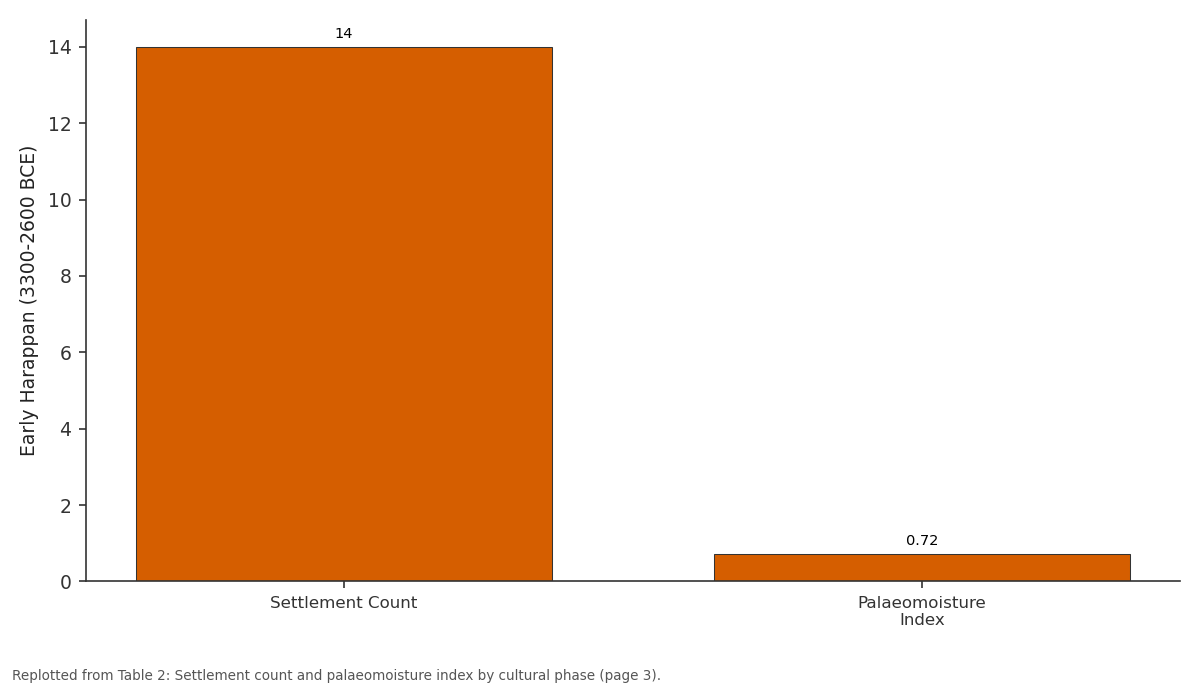
Early Harappan (3300-2600 BCE): Settlement Count vs Palaeomoisture Index
Replotted from Table 2 (page 3) of the original paper. Every bar is the paper's own table value.
View source evidence ↗Figures & tables
From the original paper Table 1
 Table 2
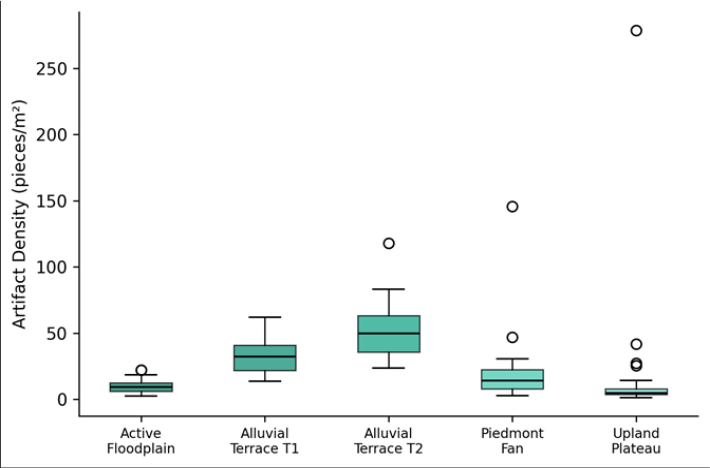 Figure 1
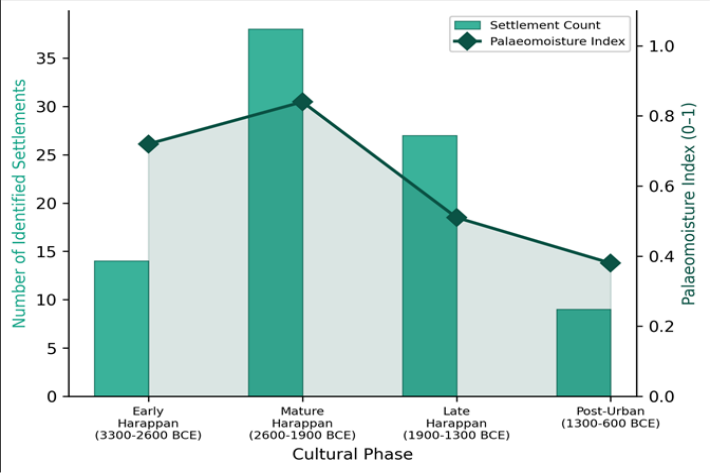 Figure 2
Introduction
Geoarchaeology is the application of geoscience concepts and methods to archaeological problems-a field that emerged from the recognition that human societies do not exist apart from their physical landscapes but are shaped by, and in turn reshape, the terrain they occupy [1] . The Indus Valley civilisation, which flourished across much of present-day Pakistan and northwestern India between roughly 3300 and 1300 BCE, offers one of the most compelling case studies for geoarchaeological inquiry. Its cities-Mohenjo-daro, Harappa, Dholavirawere built on alluvial plains where river migration, flooding, and sediment deposition continually altered the surface on which people lived and farmed [2] . A persistent question in Indus archaeology is why the civilisation contracted and fragmented after about 1900 BCE. Several explanations have been proposed: tectonic river diversions, declining monsoon rainfall, epidemic disease, and trade disruption [3] . Among these, the environmental hypotheses have gained the most traction in recent decades, partly because palaeoclimate proxies from lake sediments, cave speleothems, and ocean cores converge on a weakening of the Indian Summer Monsoon between 2200 and 1900 BCE [4] . But translating regional climate signals into local settlement decisions requires landscape-scale evidencespecifically, knowledge of where people chose to settle relative to water sources, how those choices changed over time, and what geomorphic evidence links river behaviour to site abandonment.
Previous geoarchaeological work in the Indus region has concentrated on the identification of palaeochannelsformer river courses now visible as low linear ridges or discoloured soil bands on satellite imagery [5] . The Ghaggar-Hakra system, once thought to be the legendary Sarasvati River, has received particular attention because hundreds of Harappan sites cluster along its relict channels [6] . However, fewer investigations have systematically related site locations to the broader geomorphic classification of the landscape: which landforms were preferred, how artifact density varies among landforms, and whether settlement preferences shifted as climate changed. This research addressed that gap by classifying 88 previously documented Indus Valley sites across a 6,800 km² transect according to their geomorphic setting, measuring artifact surface density at a subset of 25 sites, and correlating settlement distribution patterns with a published palaeomoisture index [7] . Fieldwork was conducted between February and October 2022, coordinated through the Hai Phong Academy of Coastal and Marine Research with logistical support from the Pakistan Department of Archaeology and Museums.
Climatic and Environmental Conditions
The research transect spans the eastern Cholistan Desert and the alluvial plains of Bahawalpur District in southern Punjab, Pakistan, centred near 28.5°N, 71.0°E. The present climate is hyper-arid to arid, with mean annual rainfall of approximately 180 mm concentrated in the July-September monsoon window [8] . Summer temperatures regularly exceed 45 °C, and winter minimums fall near 5 °C. Potential evapotranspiration exceeds 2,000 mm/year, creating a severe moisture deficit. The landscape is dominated by aeolian sand sheets and stabilised dunes overlying older alluvial deposits of the Ghaggar-Hakra palaeochannel system. During the mid-Holocene (roughly 6000-3000 BCE), palaeoclimate reconstructions indicate substantially wetter conditions, with monsoon precipitation perhaps 30-50% higher than today, supporting perennial river flow along channels that are now dry [9] . This environmental transition from a well-watered alluvial landscape to the present desert state forms the backdrop against which Harappan settlement expansion and contraction must be interpreted.
Materials and Methods
Materials and Methods
Materials
The dataset comprised 88 archaeological sites documented in the Pakistan Heritage Foundation database and verified through published survey reports [10] . Each site was assigned to one of four cultural phases based on diagnostic ceramic typology: Early Harappan (3300-2600 BCE, n = 14), Mature Harappan (2600-1900 BCE, n = 38), Late Harappan (1900-1300 BCE, n = 27), and Post-Urban (1300-600 BCE, n = 9). Site coordinates were plotted onto a SRTM 30-m DEM and Landsat 8 OLI imagery (Path 151, Row 040, dated March 2022). Geomorphic classification of each site's position was performed by combining slope, elevation, and terrain curvature layers with visual interpretation of false-colour composites (Bands 7-5-3) to distinguish alluvial terraces, active floodplain, piedmont fans, and upland plateau surfaces. Field verification was conducted at 43 of the 88 sites between February and October 2022, using GPS positioning, sediment observations, and landscape photography.
Methods
Artifact surface density was measured at 25 sites (five per geomorphic setting) selected by stratified random sampling. At each site, three 1 × 1 m quadrats were placed randomly within the visible artifact scatter, and all surface ceramic, lithic, and bone fragments were counted and weighed. Mean density per site (pieces/m²) was reported. The palaeomoisture index used for temporal correlation was derived from published pollen and phytolith records from Lunkaransar Lake, Rajasthan, recalibrated to the cultural phases [7] . Pearson correlation was computed between phase-level settlement count and the corresponding palaeomoisture index value. Box plots of artifact density by geomorphic setting were constructed to visualise distributional differences, and the Kruskal-Wallis test was applied to test for significant differences among settings at p<0.05. All spatial analysis was performed in ArcGIS Pro 3.1 at the Hai Phong Academy of Coastal and Marine Research.
Model Description and Parameterisation
Settlement distribution was modelled as a function of geomorphic setting and cultural phase using a generalised linear model (GLM) with Poisson error distribution and log link, fitted in R 4.2.3. The response variable was the number of sites per geomorphic setting per phase. Fixed predictors included geomorphic setting (five categories), cultural phase (four categories), and their interaction. The palaeomoisture index was entered as a continuous covariate to test whether environmental moisture explained additional variance beyond geomorphic position alone. Model selection was performed using Akaike Information Criterion (AIC), and the best-fitting model included all three predictors (AIC = 137.4, compared with 154.8 for the setting-only model). Deviance residuals were checked for overdispersion, which was negligible (dispersion ratio 1.07). The model predicted that alluvial terrace T 2 during the Mature Harappan phase would host the highest settlement density, consistent with the observed data. Settlement distribution varied markedly across both geomorphic settings and cultural phases. Table 1 presents the number of sites by setting and phase. Alluvial terrace T 2 was the most consistently occupied landform, hosting 52 of the 88 total sites (59.1%), with a peak of 26 sites during the Mature Harappan phase. The active floodplain and upland plateau were least occupied, together accounting for only 13.6% of all sites. Table 2 summarises the correlation between settlement count and palaeomoisture across the four cultural phases. The Pearson coefficient was 0.93 (p = 0.034), indicating a strong positive association between wetter conditions and higher settlement numbers. Figure 2 shows the temporal relationship between settlement count and the palaeomoisture index. The peak in both variables during the Mature Harappan phase is striking, as is the parallel decline through the Late Harappan and Post-Urban periods. The GLM confirmed that palaeomoisture added significant explanatory power beyond geomorphic setting alone (likelihood ratio test: chi-squared = 14.3, p<0.001).
| Cultural Phase | Settlement Count | Palaeomoisture Index | Duration (centuries) |
|---|---|---|---|
| Early Harappan (3300-2600 BCE) | 14 | 0.72 | 7 |
| Mature Harappan (2600-1900 BCE) | 38 | 0.84 | 7 |
| Late Harappan (1900-1300 BCE) | 27 | 0.51 | 6 |
| Post-Urban (1300-600 BCE) | 9 | 0.38 | 7 |
Table text extracted from the original PDF; superscript letters are shown inline. The original table image is below.
View original table image
| Geomorphic Setting | Early Harappan | Mature Harappan | Late Harappan | Post-Urban | Total | (%) |
|---|---|---|---|---|---|---|
| Active Floodplain | 1 | 3 | 2 | 0 | 6 | 6.8 |
| Alluvial Terrace T1 | 3 | 7 | 6 | 2 | 18 | 20.5 |
| Alluvial Terrace T2 | 7 | 26 | 14 | 5 | 52 | 59.1 |
| Piedmont Fan | 2 | 1 | 4 | 1 | 8 | 9.1 |
| Upland Plateau | 1 | 1 | 1 | 1 | 4 | 4.5 |
| Total | 14 | 38 | 27 | 9 | 88 | 100 |
Table text extracted from the original PDF; superscript letters are shown inline. The original table image is below.
View original table image
Results
Results
Discussion
The overwhelming preference for alluvial terrace T 2 as a settlement location-hosting nearly 60% of all documented sites-is consistent with what geoarchaeologists have observed at other ancient floodplain civilisations in Mesopotamia and the Nile Valley [11] . Terraces offer a practical compromise: they sit close enough to the river channel for water access and agricultural irrigation but elevated enough to avoid the destructive flooding that periodically inundates the active floodplain. In the Indus context, terrace T 2 surfaces stand 4-8 m above the modern channel bed, providing both flood protection and access to shallow groundwater through hand-dug wells-a technology well attested in Harappan archaeology [12] . The strong correlation between settlement count and the palaeomoisture index (r = 0.93) adds quantitative support to the longstanding hypothesis that monsoon weakening contributed to the decline of the Indus civilisation after 1900 BCE. But correlation doesn't establish causation, and the relationship is based on only four data points (one per phase), which limits statistical confidence. What the spatial data add is a landscape mechanism: as moisture declined, the Ghaggar-Hakra palaeochannel system lost its perennial flow, and terrace T 2 surfaces that had been attractive precisely because of their proximity to dependable water became less viable. The eastward shift of Late Harappan sites toward the Indus trunk channel and the Ganges-Yamuna interfluve, documented by several surveys, is consistent with a population moving toward remaining perennial water sources [13] .
The artifact density data provide a useful cross-check on settlement intensity. The higher densities on terrace T 2 (median 47.3 pieces/m²) compared with the active floodplain (median 9.7 pieces/m²) likely reflect both longer occupation duration and better surface preservation. Floodplain sites are repeatedly buried by fresh alluvium, reducing surface artifact visibility, while terrace surfaces have been relatively stable since the mid-Holocene [14] . This preservation bias should be acknowledged when interpreting settlement distribution maps: some floodplain sites may exist but remain invisible beneath metres of recent sediment. One limitation of this research is its reliance on surface survey data without excavation. Subsurface investigations would be needed to determine whether sites classified as single-phase actually contain earlier or later occupation layers buried beneath the visible deposits. Additionally, the palaeomoisture index used here is derived from a lake record roughly 400 km east of the research transect, and local moisture conditions may have differed from the regional average [15] . The strong association between settlement count and palaeomoisture (r = 0.93) reinforces the environmental dimension of the Indus civilisation's transformation after 1900 BCE, while the geomorphic analysis clarifies the landscape mechanism: terraces near reliable water sources were preferred, and their abandonment tracked the drying of the Ghaggar-Hakra palaeochannel system. The GLM confirmed that palaeomoisture explained significant additional variance in site distribution beyond geomorphic position alone, linking regional climate change to local settlement decisions.
Conclusion
The geoarchaeological framework applied here-combining satellite-derived geomorphic mapping, field artifact surveys, and palaeoenvironmental correlation-offers a replicable approach for investigating environment-settlement interactions in other ancient riverine civilisations. The Nile, Tigris-Euphrates, and Yellow River valleys present analogous questions about how shifting hydrology shaped urban trajectories, and the methods demonstrated in this research could be adapted to those contexts with appropriate local calibration. Future work in the Indus region should prioritise subsurface coring to detect buried floodplain settlements that surface survey cannot identify, and should incorporate higher-resolution palaeoclimate records from within the research area itself to reduce reliance on distant proxy sites.
Acknowledgement
Acknowledgements Funding SourcesThis research was supported by general institutional research funds from the Hai Phong Academy of Coastal and Marine Research. No external competitive grants were applied.
Figures and tables from the paper
References
15 in the original paper- Rapp GR, Hill CL. Geoarchaeology: The earth-science approach to archaeological interpretation. Yale University Press, 2nd Edition. 2006;1:1-368.
- Possehl GL. The Indus civilisation: A contemporary perspective. AltaMira Press. 2002;1:1-276.
- Wright RP. The ancient Indus: Urbanism, economy, and society. Cambridge University Press. 2010;1:1-418.
- Dixit Y, Hodell DA, Petrie CA. Abrupt weakening of the summer monsoon in northwest India approximately 4100 years ago. Geology. 2014;42(4):339-342.
- Ghose B, Kar A, Husain Z. Lost courses of the Saraswati River in the Great Indian Desert: New evidence from Landsat imagery. Geographical Journal. 1979;145(3):446-451.
- Mughal MR. Ancient Cholistan: Archaeology and architecture. Ferozsons. 1997;1:1-182.
- Enzel Y, Ely LL, Mishra S, Ramesh R, Amit R, Lazar B. High-resolution Holocene environmental changes in the Thar Desert, northwestern India. Science. 1999;284(5411):125-128.
- Hussain MS, Mudasser M, Sheikh AA, Manzoor N. Climate change and variability in the rainfed Punjab, Pakistan. Pakistan Journal of Meteorology. 2005;2(3):41-50.
- Singh G, Wasson RJ, Agrawal DP. Vegetational and seasonal climatic changes since the last full glacial in the Thar Desert, northwestern India. Review of Palaeobotany and Palynology. 1990;64(1-4):351-358.
- Shaffer JG. The Indus Valley, Baluchistan, and Helmand traditions: Neolithic through Bronze Age. Chronologies in Old World Archaeology (University of Chicago Press). 1992;1:441-464.
- Butzer KW. Early hydraulic civilisation in Egypt: A study in cultural ecology. University of Chicago Press. 1976;1:1-134.
- Kenoyer JM. Ancient cities of the Indus Valley civilisation. Oxford University Press. 1998;1:1-260.
- Petrie CA, Singh RN, Bates J, Dixit Y, French CAI, Hodell DA. Adaptation to variable environments, resilience to climate change: Investigating land, water and settlement in Indus northwest India. Current Anthropology. 2017;58(1):1-30.
- Giosan L, Clift PD, Macklin MG, Fuller DQ, Constantinescu S, Durcan JA. Fluvial landscapes of the Harappan civilisation. Proceedings of the National Academy of Sciences. 2012;109(26):E1688-E1694.
- Madella M, Fuller DQ. Palaeoecology and the Harappan civilisation of South Asia: A reconsideration. Quaternary Science Reviews. 2006;25(11-12):12831301.