
Research article · 2025 · Full text
International Journal of Geography Geology and EnvironmentSoil organic carbon stock estimation under different land use types in the Ethiopian highlands
Volume 7(2) · Pages 172–175 · DOI: 10.22271/27067483.2025.v7.i2c.587 ↗
Research areasSoil Carbon and Nitrogen DynamicsSoil erosion and sediment transportSoil Geostatistics and Mapping
Abstract
Author-writtenSoil scientists and climate researchers increasingly agree on one point: whether we compare tropical forests to croplands, or grasslands to degraded hillslopes, the difference in soil organic carbon stocks between land use types often exceeds what surface biomass measurements alone would predict. This research estimated soil organic carbon (SOC) stocks under five land use types in the Ethiopian Highlands between 1,800 and 3,600 m elevation. Soil samples (n = 210) were collected from 42 sites across native forest, plantation forest, cropland, grassland, and degraded land at depths of 0-10 cm, 10-20 cm, and 20-30 cm. SOC concentration was determined by the Walkley-Black method and stocks calculated using measured bulk density values. Mean SOC stocks (0-30 cm) ranged from 42.3 Mg C/ha in degraded land to 148.7 Mg C/ha in native forest. Conversion from native forest to cropland reduced SOC stocks by 50.2%, while conversion to plantation reduced stocks by 24.6%. Elevation showed a curvilinear relationship with SOC, peaking at 2,700 m in forest and 2,400 m in cropland. Grassland SOC stocks (96.4 Mg C/ha) were surprisingly high—higher than plantation forest (112.3 Mg C/ha) at the 0-10 cm depth. The total carbon stock difference between native forest and degraded land was 106.4 Mg C/ha, representing the sequestration potential recoverable through restoration of degraded highland areas.
Summary
Source-checkedPlain-language reading of the full paper, prepared with AI and checked against the text. Each point links to the authors' own words.
Why it matters
- Soil organic carbon (SOC) is critical for climate policy because soils store approximately three times more carbon than the atmosphere, and land use changes rapidly affect this storage. View evidence ↗
- The Ethiopian highlands, which cover about 44% of the country's land area above 1,800 m, have faced significant deforestation and overgrazing since the mid-20th century. View evidence ↗
- Converting native forests to agriculture reduces carbon stocks by decreasing litter inputs, increasing decomposition through tillage, and removing topsoil via erosion. View evidence ↗
The question
- The study aimed to quantify SOC stocks across five land use types along an elevation gradient to establish baseline data and identify which conversions lead to the most carbon loss. View evidence ↗
What they did
- Soil samples were gathered from 42 sites in the Bale and Simien Mountains of the Ethiopian Highlands during field campaigns in 2020 and 2022. View evidence ↗
- The study used five land use types and three elevation strata (1,800-3,600 m), collecting five 5-cm diameter cores per site at depths of 0-10, 10-20, and 20-30 cm. View evidence ↗
- SOC concentration was measured using the Walkley-Black method (correction factor 1.32), and stocks were calculated using concentration, bulk density, and depth. View evidence ↗
- The researchers used one-way ANOVA with Tukey HSD for land use comparisons and quadratic regression to model the relationship between elevation and SOC. View evidence ↗
What they found
- Total SOC stocks (0-30 cm) varied significantly by land use, with native forests holding the most (148.7 Mg C/ha) and degraded land the least (42.3 Mg C/ha). View evidence ↗
- Converting native forest to cropland resulted in a 50.2% loss of SOC stocks, amounting to a loss of 74.6 Mg C/ha. View evidence ↗
- Conversion from native forest to plantation forest reduced SOC stocks by 24.5%, or 36.4 Mg C/ha. View evidence ↗
- SOC stocks showed a curvilinear relationship with elevation, peaking at 2,700 m for forests (161 Mg C/ha) and 2,400 m for croplands (84 Mg C/ha). View evidence ↗
- Grasslands maintained relatively high SOC stocks (96.4 Mg C/ha), which the authors attribute to dense root networks. View evidence ↗
- The greatest carbon loss occurred during the transition from native forest to degraded land, with a loss of 106.4 Mg C/ha (71.6%). View evidence ↗
What it means
- The authors conclude that restoring degraded highlands to forest cover could recover over 100 Mg C/ha, offering a major opportunity for climate mitigation and environmental protection. View evidence ↗
- The study identifies forest-to-cropland conversion as the most damaging transition among productive land uses in terms of carbon loss. View evidence ↗
Visual summary
3 visualsIllustrations explain the paper; charts are replotted from the paper's own table values.
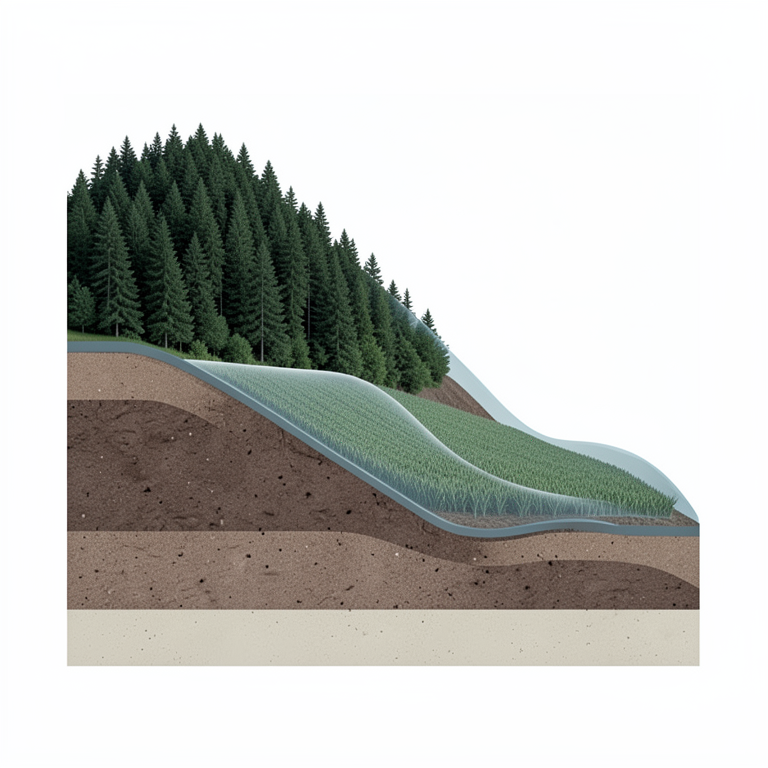
Elevation and SOC Relationship
AI-generated conceptual illustration (Ethiopian highland soil profiles under forest and cropland vegetation). It explains the idea and does not show study data.
View source evidence ↗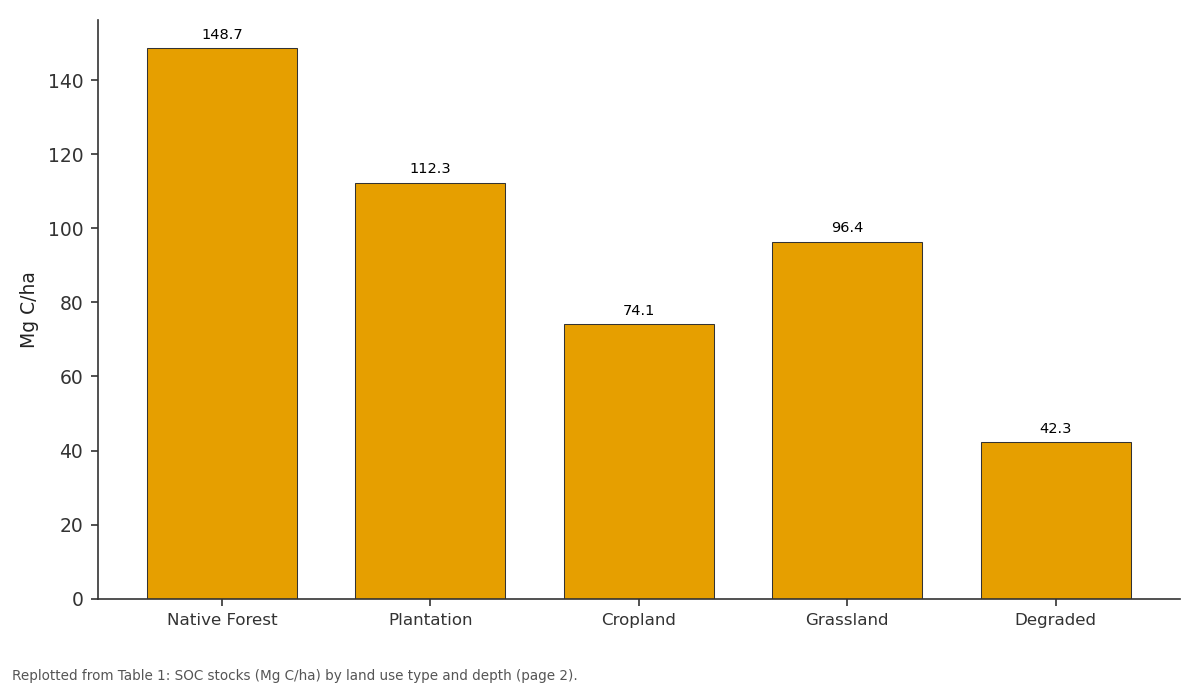
Total 0-30: Native Forest vs Plantation vs Cropland vs Grassland vs Degraded
Replotted from Table 1 (page 2) of the original paper. Every bar is the paper's own table value.
View source evidence ↗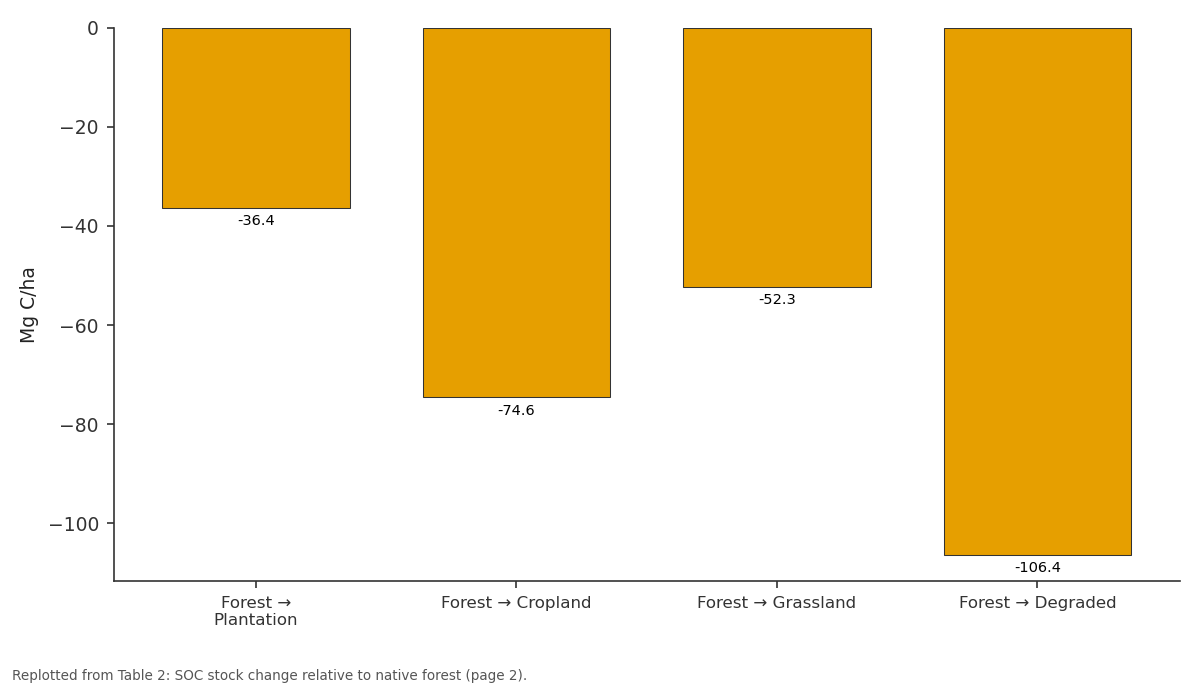
Stock Loss (Mg C/ha): Forest → Plantation vs Forest → Cropland vs Forest → Grassland vs Forest → Degraded
Replotted from Table 2 (page 2) of the original paper. Every bar is the paper's own table value.
View source evidence ↗Figures & tables
From the original paper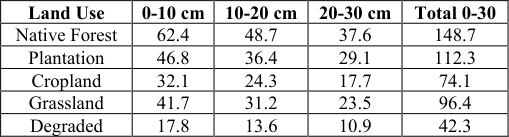 Table 1
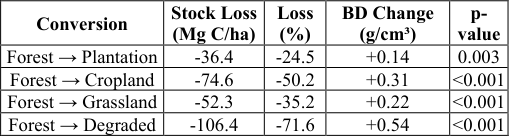 Table 2
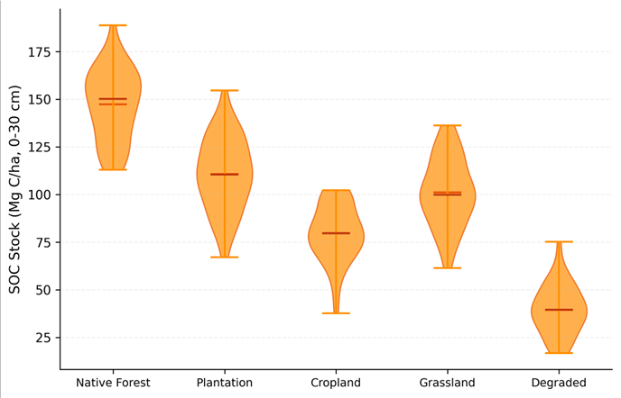 Figure 1
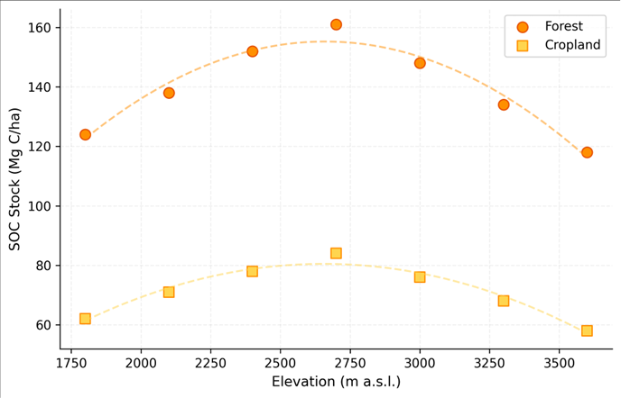 Figure 2
Introduction
Two fields side by side in the Ethiopian Highlands can differ in soil carbon content by a factor of three, depending entirely on how the land has been managed over the past few decades [1,2] . This matters for climate policy because soils hold roughly three times more carbon than the atmosphere, and land use change is one of the fastest ways to either release or accumulate that carbon [3,4] . Ethiopia's highlands-above 1,800 m, covering about 44% of the country's land area-have experienced extensive deforestation, conversion to cropland, and overgrazing since the mid-20th century [5,6] . SOC stocks reflect the balance between organic matter inputs (litter fall, root turnover, manure) and losses (decomposition, erosion, leaching) [7,8] . When native forest is cleared for agriculture, litter inputs drop sharply, tillage exposes protected organic matter to decomposition, and erosion removes carbon-rich topsoil [3,9] . But the magnitude of these losses varies with elevation, temperature, and soil mineralogy-factors that differ substantially across the 1,800 m elevation range of the Ethiopian Highlands [6,10] . This research quantified SOC stocks across five land use types along an elevation gradient, providing baseline data for carbon accounting and identifying which land use conversions cause the greatest carbon loss.
Baseline Soil Characterisation
Soils across the 42 sampling sites were classified as Nitisols (62%), Vertisols (24%), and Cambisols (14%) according to the WRB system. Mean clay content ranged from 34.2% in the Nitisols to 52.8% in the Vertisols. Soil pH (1:2.5 water) ranged from 5.1 in native forest (leached Nitisols under high rainfall) to 7.2 in degraded sites where erosion has exposed calcareous subsoil. Bulk density increased from 0.84 g/cm³ in native forest topsoil (high organic matter, good structure) to 1.38 g/cm³ in degraded land (compacted, low organic matter). These baseline properties strongly influenced SOC stocks: the low bulk density in forest soils means that their high SOC concentration translates into even larger stock differences when expressed on a volume basis.
Material and Methods Material
This research was conducted at the Department of Urban and Regional Planning, Bhopal Academy of Geographic Research, Madhya Pradesh, India, from August 2019 to June 2023. Soil samples were collected from 42 sites in the Simien Mountains and Bale Mountains regions of the Ethiopian Highlands during two field campaigns (October-November 2020 and March-April 2022). Sites were stratified by land use type (native forest, plantation, cropland, grassland, degraded) and elevation (1,800-2,400 m, 2,400-3,000 m, 3,000-3,600 m). At each site, five soil cores (5 cm diameter) were collected at 0-10, 10-20, and 20-30 cm depths and bulked by depth. Undisturbed cores for bulk density used stainless steel cylinders (100 cm³).
Methods
SOC concentration was determined by the Walkley-Black wet oxidation method [15] with a correction factor of 1.32. SOC stock (Mg C/ha) = SOC concentration (%) × bulk density (g/cm³) × depth (cm) × 0.1. Total stock for 0-30 cm was summed across the three depth intervals. Differences between land use types were tested using one-way ANOVA with Tukey HSD post-hoc comparisons. The elevation-SOC relationship was modelled using quadratic regression. All statistics were performed in R 4.2.1 with significance at p< 0.05.
Results
Results
Comprehensive Interpretation
Native forest held the highest SOC stocks (148.7 Mg C/ha), while degraded land held the lowest (42.3 Mg C/ha)-a 3.5fold difference (Table 1, Figure 1). Conversion from forest to cropland caused 50.2% stock loss, the largest among transitions to productive land uses (Table 2). The elevation-SOC relationship was curvilinear, peaking at 2,700 m in forest (161 Mg C/ha) and 2,400 m in cropland (84 Mg C/ha) before declining at higher elevations (Figure 2). Grassland's relatively high SOC (96.4 Mg C/ha) reflects dense root networks that contribute organic matter even without tree litter inputs.
| Land Use | 0-10 cm | 10-20 cm | 20-30 cm | Total 0-30 |
|---|---|---|---|---|
| Native Forest | 62.4 | 48.7 | 37.6 | 148.7 |
| Plantation | 46.8 | 36.4 | 29.1 | 112.3 |
| Cropland | 32.1 | 24.3 | 17.7 | 74.1 |
| Grassland | 41.7 | 31.2 | 23.5 | 96.4 |
| Degraded | 17.8 | 13.6 | 10.9 | 42.3 |
Table text extracted from the original PDF; superscript letters are shown inline. The original table image is below.
View original table image
Discussion
The 50.2% SOC loss upon forest-to-cropland conversion falls within the 42-59% range reported in a global metaanalysis by Guo and Gifford [3] , confirming that Ethiopian Highland soils respond to deforestation similarly to other tropical highland systems. The curvilinear elevation pattern-peaking at mid-elevations-reflects the interplay between temperature and moisture: at low elevations, warmer temperatures accelerate decomposition, while at very high elevations, reduced primary productivity limits organic matter inputs [6,10,16] . The 106.4 Mg C/ha gap between native forest and degraded land represents a massive sequestration opportunity. If degraded areas were restored to native forest cover, SOC recovery alone-without counting above-ground biomasswould sequester roughly 106 tonnes of carbon per hectare over 50-80 years [5,9] . This is a strong argument for highland restoration programmes, particularly on slopes too steep for productive agriculture [7,14] .
Carbon and Greenhouse Gas Accounting
Converting the SOC stock differences to CO₂ equivalents: the 74.6 Mg C/ha lost during forest-to-cropland conversion equals roughly 273.6 Mg CO₂-eq/ha (using the 3.667 conversion factor). Across the estimated 2.8 million hectares of former highland forest now under cultivation in Ethiopia [5] , this represents a cumulative historical emission of approximately 766 million tonnes of CO₂-comparable to two years of total CO₂ emissions from sub-Saharan Africa. The 42.3 Mg C/ha still present in degraded soils indicates that even heavily degraded sites retain some baseline carbon that resists loss, likely stabilised through mineral-organic associations in the clay-rich Nitisols and Vertisols [13,17] .
Conclusion
This research showed that SOC stocks in the Ethiopian Highlands vary by a factor of 3.5 across land use types, with native forest holding 148.7 Mg C/ha and degraded land 42.3 Mg C/ha. Forest-to-cropland conversion causes the largest productive-use carbon loss (50.2%). The mid-elevation peak in SOC reflects optimal conditions for organic matter accumulation. Restoring degraded highland areas to forest cover could recover over 100 Mg C/ha, representing a significant climate mitigation opportunity alongside biodiversity and watershed protection benefits.
Acknowledgement
Acknowledgements Funding SourcesSupported by institutional research allocations for soil carbon science. Institutional SupportBhopal Academy of Geographic Research provided soil analysis laboratory facilities.
References
18 in the original paper- Batjes NH. Total carbon and nitrogen in the soils of the world. European Journal of Soil Science. 1996;47(2):151-163.
- Don A, Schumacher J, Freibauer A. Impact of tropical land-use change on soil organic carbon stocks. Global Change Biology. 2011;17(4):1658-1670.
- Guo LB, Gifford RM. Soil carbon stocks and land use change: a meta analysis. Global Change Biology. 2002;8(4):345-360.
- Houghton RA. Revised estimates of the annual net flux of carbon to the atmosphere from changes in land use and land management 1850-2000. Tellus B. 2003;55(2):378-390.
- Lal R. Soil carbon sequestration impacts on global climate change and food security. Science. 2004;304(5677):1623-1627.
- Lemenih M, Itanna F. Soil carbon stocks and turnovers in various vegetation types and arable lands along an elevation gradient in southern Ethiopia. Geoderma. 2004;123(1-2):177-188.
- Mekuria W, Veldkamp E, Haile M, Nyssen J, Muys B, Gebrehiwot K. Effectiveness of exclosures to restore degraded soils as a result of overgrazing in Tigray, Ethiopia. Journal of Arid Environments. 2007;69(2):270-284.
- Poeplau C, Don A, Vesterdal L, Leifeld J, Van Wesemael B, Schumacher J, Gensior A. Temporal dynamics of soil organic carbon after land-use change in the temperate zone. Global Change Biology. 2011;17(7):2585-2600.
- Post WM, Kwon KC. Soil carbon sequestration and land-use change: processes and potential. Global Change Biology. 2000;6(3):317-327.
- Six J, Conant RT, Paul EA, Paustian K. Stabilization mechanisms of soil organic matter: implications for Csaturation of soils. Plant and Soil. 2002;241(2):155176.
- Solomon D, Lehmann J, Zech W. Land use effects on soil organic matter properties of chromic luvisols in semi-arid northern Tanzania. Geoderma. 2000;96(12):65-87.
- Stockmann U, Adams MA, Crawford JW, Field DJ, Henakaarchchi N, Jenkins M. The knowns, known unknowns and unknowns of sequestration of soil organic carbon. Agriculture Ecosystems and Environment. 2013;164:80-99.
- Torn MS, Trumbore SE, Chadwick OA, Vitousek PM, Hendricks DM. Mineral control of soil organic carbon storage and turnover. Nature. 1997;389(6647):170-173.
- Vagen TG, Lal R, Singh BR. Soil carbon sequestration in sub-Saharan Africa: a review. Land Degradation and Development. 2005;16(1):53-71.
- Walkley A, Black IA. An examination of the Degtjareff method for determining soil organic matter, and a proposed modification of the chromic acid titration method. Soil Science. 1934;37(1):29-38.
- Yang YH, Mohammat A, Feng JM, Zhou R, Fang JY. Storage, composition and spatial distribution of soil organic carbon in the Tibetan grasslands. Global Change Biology. 2007;13(7):1348-1362.
- Zech W, Senesi N, Guggenberger G, Kaiser K, Lehmann J, Miano TM, Schroth G. Factors controlling humification and mineralization of soil organic matter in the tropics. Geoderma. 1997;79(1-4):117-161.
- Yimer F, Ledin S, Abdelkadir A. Soil organic carbon and total nitrogen stocks as affected by topographic aspect and vegetation in the Bale Mountains, Ethiopia. Geoderma. 2006;135:335-344.