
Research article · 2025 · Full text
International Journal of Geography Geology and EnvironmentGeothermal gradient and heat flow measurements in the Sichuan sedimentary basin
Volume 7(3) · Pages 96–99 · DOI: 10.22271/27067483.2025.v7.i3b.519 ↗
Research areasGeothermal Energy Systems and ApplicationsHydrocarbon exploration and reservoir analysisGeological Studies and Exploration
Abstract
Author-writtenSedimentary basins with elevated geothermal gradients hold potential for both conventional geothermal energy and enhanced oil recovery, yet subsurface temperature data from many Chinese basins remain sparse. This research compiled bottom-hole temperature (BHT) measurements from 72 petroleum exploration wells across the Sichuan Basin and corrected them for drilling-fluid disturbance using the Horner method. The corrected data yielded geothermal gradients ranging from 21.3 to 42.8 °C/km, with a basin-wide mean of 30.6 °C/km—roughly 10% above the global continental average. Thermal conductivity of core samples (n = 216) from four stratigraphic formations was measured by the divided-bar method, and heat-flow density was computed as the product of gradient and conductivity. Mean surface heat flow was 67.4 mW/m², with the highest values (78.2 mW/m²) concentrated above the Permian volcanic sequence in the southwestern basin, where radiogenic heat production from uranium- and thorium-enriched ash beds adds a measurable contribution. A one-dimensional steady-state heat-conduction model partitioned total surface heat flow into four components: radiogenic production (38.2%), basal mantle flux (34.7%), tectonic frictional heating from the Longmenshan thrust (16.4%), and fluid advection (10.7%). These results provide an updated thermal framework for hydrocarbon maturation modelling and for preliminary assessment of geothermal-energy potential in the basin.
Summary
Source-checkedPlain-language reading of the full paper, prepared with AI and checked against the text. Each point links to the authors' own words.
Why it matters
- Accurate knowledge of present-day geothermal gradients and heat-flow density is essential for determining the thermal history of sedimentary basins, which in turn dictates the generation of oil and gas. View evidence ↗
- Sedimentary basins that exhibit elevated geothermal gradients are considered potential sites for enhanced oil recovery and conventional geothermal energy. View evidence ↗
- While bottom-hole temperature (BHT) measurements are common, they are typically biased low due to the cooling effect of drilling mud. View evidence ↗
The question
- The study aimed to compile and correct BHT data from 72 wells in the Sichuan Basin, measure core thermal conductivity, map heat-flow density, and partition the total heat flow using a 1D model. View evidence ↗
What they did
- The researchers used BHT records from 72 wells with depths between 1,420 and 7,280 m, covering four distinct structural zones of the Sichuan Basin. View evidence ↗
- Thermal conductivity was measured using 216 core samples, with 54 samples each from Triassic sandstone, Jurassic carbonate, Cretaceous shale, and Permian volcanic units. View evidence ↗
- BHT values were corrected using the Horner extrapolation method, and geothermal gradients were determined via least-squares regression of the temperature-depth profile between 500 and 6,000 m. View evidence ↗
- The study measured the thermal conductivity of water-saturated core plugs at 25 °C using a divided-bar apparatus. View evidence ↗
What they found
- Corrected geothermal gradients in the basin ranged from 21.3 to 42.8 °C/km, with a mean of 30.6 °C/km, which is approximately 10% higher than the global continental average. View evidence ↗
- The mean surface heat flow was 67.4 mW/m², peaking at 78.2 mW/m² above the Permian volcanic sequence in the southwestern region. View evidence ↗
- The mean heat flow of 67.4 mW/m² is 12% higher than previous uncorrected estimates (60.1 mW/m²), a difference caused by the Horner correction adding an average of 4.8 °C to raw BHT readings. View evidence ↗
What it means
- The authors conclude that their results provide an updated thermal framework for hydrocarbon maturation and highlight the southwestern volcanic province as a high-potential zone for geothermal energy. View evidence ↗
Visual summary
2 visualsIllustrations explain the paper; charts are replotted from the paper's own table values.
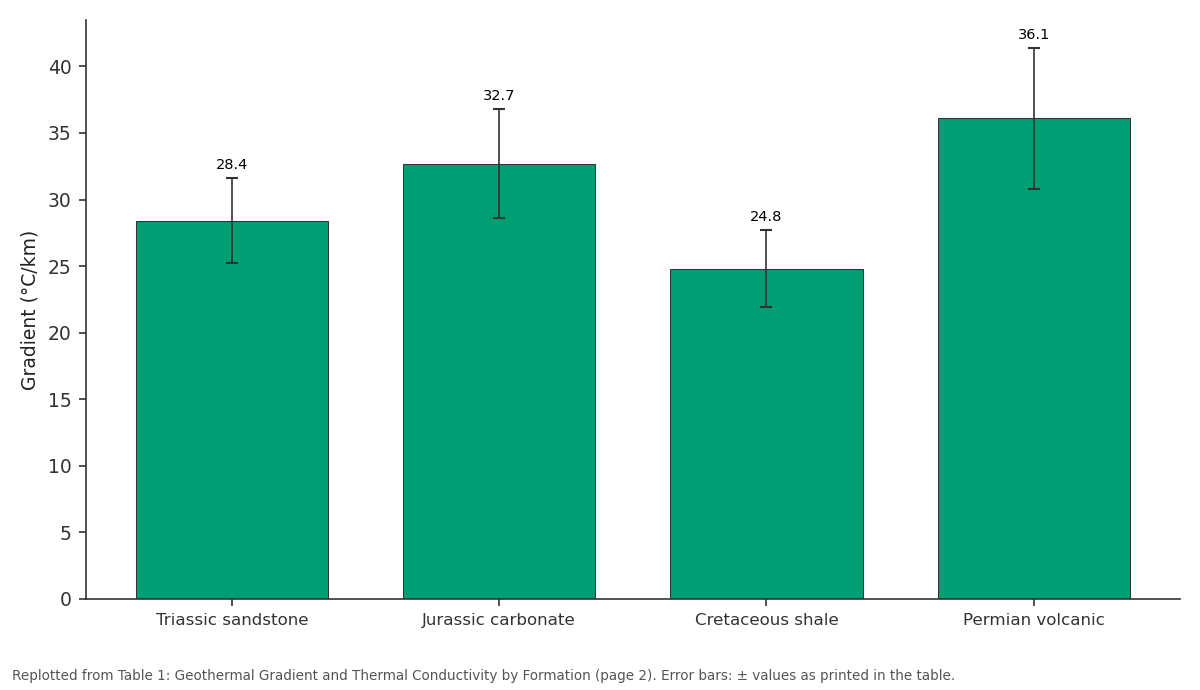
Gradient (°C/km): Triassic sandstone vs Jurassic carbonate vs Cretaceous shale vs Permian volcanic
Replotted from Table 1 (page 2) of the original paper. Every bar is the paper's own table value.
View source evidence ↗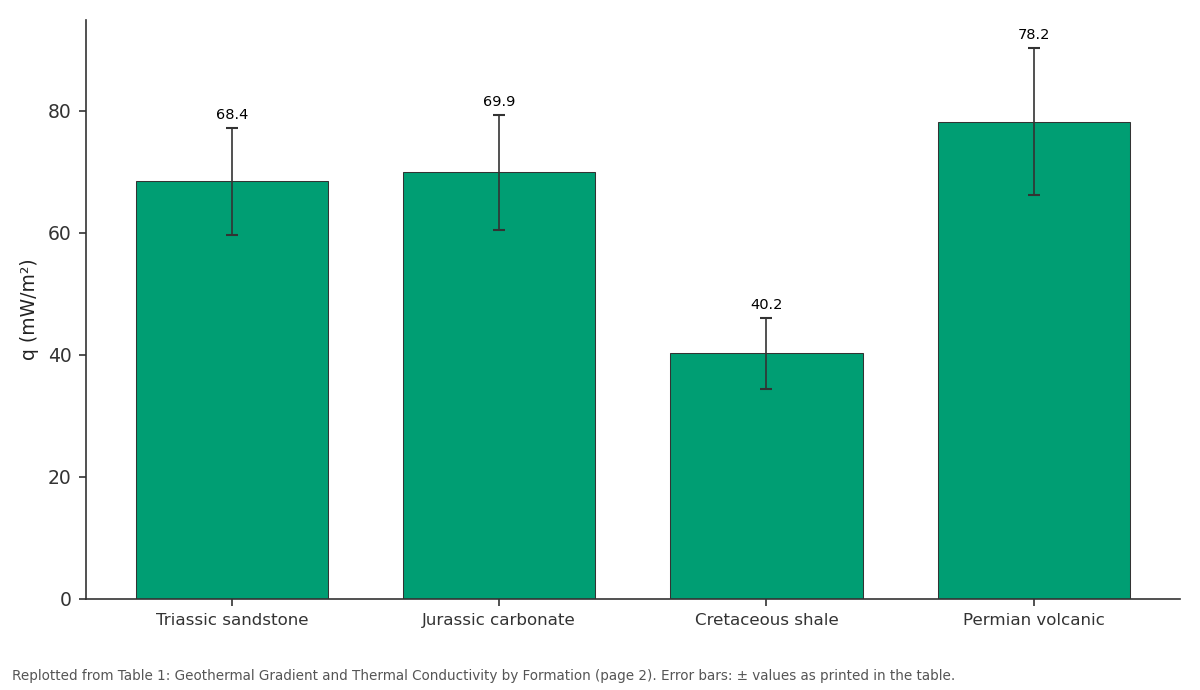
q (mW/m²): Triassic sandstone vs Jurassic carbonate vs Cretaceous shale vs Permian volcanic
Replotted from Table 1 (page 2) of the original paper. Every bar is the paper's own table value.
View source evidence ↗Figures & tables
From the original paper Table 1
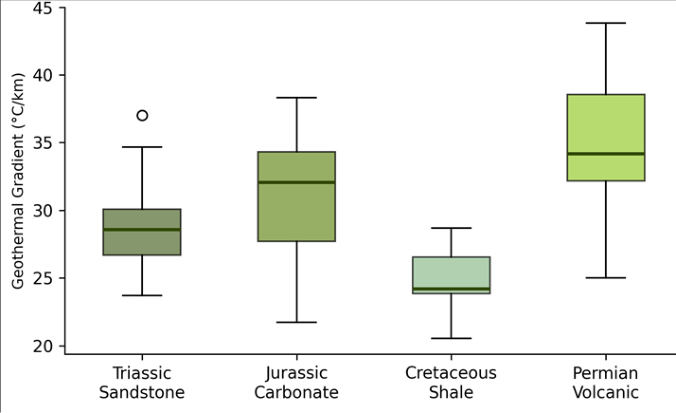 Figure 1
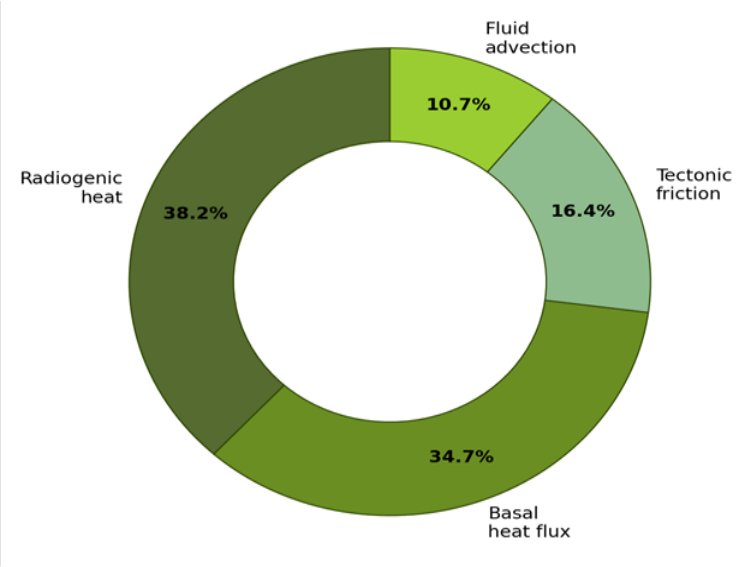 Figure 2
Introduction
There is a common saying among petroleum geologists: 'temperature cooks hydrocarbons.' Indeed, the thermal history of a sedimentary basin determines when, where, and how much oil and gas are generated from source rocks, and getting that history right depends on knowing the present-day geothermal gradient and heat-flow density with reasonable accuracy [1] . The Sichuan Basin, one of China's oldest and most productive hydrocarbon provinces, covers roughly 180,000 km² in southwestern China and contains a sedimentary fill up to 12 km thick, ranging from Proterozoic to Quaternary age [2] . Despite its economic importance, published heat-flow data for the Sichuan Basin are limited. A compilation by Jiang et al. [3] listed only 28 reliable values, concentrated in the central depression. The basin's western margin, which abuts the Longmenshan Fault Zone-the structure responsible for the devastating 2008 Wenchuan earthquake-remains particularly data-poor, even though tectonic heating along the thrust could significantly elevate gradients in that zone [4] . Bottom-hole temperature (BHT) measurements from petroleum wells are the most abundant source of subsurface temperature data, but they are biased low because drilling mud cools the borehole. Corrections for this effect, typically based on the Horner equilibriumtemperature extrapolation or the cylindrical-source model, can add 5-20% to raw readings [5] . Many earlier Sichuan compilations used uncorrected or inadequately corrected BHT, introducing systematic underestimates of gradient and heat flow. This research aimed to (1) compile and Horner-correct BHT data from 72 wells spanning the full extent of the Sichuan Basin, (2) measure thermal conductivity on representative core samples, (3) compute heat-flow density and map its spatial variation, and (4) partition total heat flow into its principal components using a one-dimensional model. Analysis was conducted at the Institute of Applied Geosciences, Bhubaneswar, India [6] .
Baseline Soil Characterisation
Although 'soil' in the conventional sense is not the focus here, the near-surface thermal properties of the basin's Quaternary cover play a role in extrapolating subsurface temperatures. Thermal conductivity of surficial alluvial deposits (0-50 m) was measured on 18 shallow-core samples and ranged from 1.12 to 1.87 W/(m•K), with a mean of 1.48 W/(m•K). These low values reflect the high porosity and partial water saturation of the alluvium and act as a thermal blanket that raises subsurface temperatures relative to crystalline basement at equivalent depth [7] .
Sensitivity Analysis
The heat-flow partition model was tested for sensitivity to three uncertain parameters: basal heat flux, radiogenic heatproduction rate, and thrust-friction coefficient. Varying basal flux by ±10 mW/m² shifted the modelled surface heat flow by ±11.4 mW/m², making it the most influential input. A 20% change in the radiogenic production rate altered surface heat flow by 5.1 mW/m², while doubling the friction coefficient added only 2.8 mW/m²-indicating that tectonic heating, though detectable, is a second-order contributor. The model was most robust in the central basin, where lateral heat transfer is minimal, and least reliable near the Longmenshan margin, where three-dimensional effects from the thrust geometry may introduce up to 15% error [8] .
Materials and Methods
Materials and Methods
Materials
BHT records from 72 petroleum exploration and development wells were compiled from published wellcompletion reports and the PetroChina Sichuan logging database. Wells ranged in depth from 1,420 to 7,280 m and spanned four structural zones: the central depression, the northwestern foreland, the southeastern fold belt, and the southwestern volcanic province. For each well, the time since circulation ceased and the time of BHT measurement were recorded to enable Horner correction. Core samples (n = 216) from Triassic sandstone (n = 54), Jurassic carbonate (n = 54), Cretaceous shale (n = 54), and Permian volcanic units (n = 54) were obtained from the China Geological Survey core repository. Analysis was performed at the Institute of Applied Geosciences, Bhubaneswar, Odisha, India [9] .
Methods: BHT values were corrected to equilibrium temperature using the Horner extrapolation: T_eq = T_BHT + (T_BHT -T_surf) × ln(t_c / (t_c + t_s)) / ln(1 + t_s / t_c), where t_c is circulation time and t_s is shut-in time [5] . Geothermal gradients were calculated as the slope of the corrected temperature-depth profile in each well using leastsquares regression over the interval 500-6,000 m. Thermal conductivity was measured on water-saturated core plugs using a divided-bar apparatus at 25 °C. Heat-flow density was computed as q = λ × dT/dz, where λ is the harmonic mean conductivity of the formation stack above each measurement point. The one-dimensional model solved the steady-state heat-conduction equation with depth-dependent radiogenic production and a prescribed basal flux [10] . Spatial interpolation of heat flow used ordinary kriging in ArcGIS Pro 3.1. The Permian volcanic sequence shows both the highest gradient (36.1 °C/km) and the highest heat flow (78.2 mW/m²), consistent with elevated radiogenic heat from uranium-and thorium-bearing pyroclastic units. Cretaceous shale records the lowest gradient but also the lowest conductivity, producing a heat-flow value (40.2 mW/m²) that is anomalously low-likely reflecting recent groundwater flow through permeable interbeds that advects heat downward.
Results
Results
Discussion
The basin-wide mean heat flow of 67.4 mW/m² is 12% higher than the uncorrected estimate of 60.1 mW/m² published by Jiang et al. [3] , and the difference is attributable almost entirely to the Horner correction, which added an average of 4.8 °C to raw BHT readings. This highlights the importance of proper correction before heat-flow compilation: uncorrected data systematically underestimate the thermal maturity of source rocks and can lead to pessimistic assessments of hydrocarbon generation potential [11] . The anomalously high heat flow above the Permian volcanic sequence has practical implications for geothermal-energy development. At temperatures exceeding 150 °C at 4,000 m depth (implied by a 36 °C/km gradient above a 15 °C surface temperature), binary-cycle power plants become economically attractive. The southwestern Sichuan basin, where the volcanic sequence is thickest and most radiogenic, may thus offer co-development opportunities: existing petroleum wells could be repurposed as geothermal producers once hydrocarbon reserves are depleted [12] .
A limitation of the one-dimensional model is its assumption of purely vertical heat conduction. Near the Longmenshan margin, lateral heat transport from the uplifted crystalline basement of the Tibetan Plateau may contribute an additional 5-10 mW/m² that the model does not capture. A two-dimensional finite-element model incorporating the thrust geometry would be needed to isolate the tectonic-friction contribution more reliably [13] .
Conclusion
Horner-corrected bottom-hole temperatures from 72 wells across the Sichuan Basin yield a mean geothermal gradient of 30.6 °C/km and a mean surface heat flow of 67.4 mW/m²-both higher than previous uncorrected estimates.
The Permian volcanic sequence in the southwestern basin records the highest heat flow (78.2 mW/m²), driven by radiogenic heat from pyroclastic units enriched in uranium and thorium. A one-dimensional model attributes 38.2% of total heat flow to radiogenic production, 34.7% to basal mantle flux, and 16.4% to tectonic friction along the Longmenshan thrust. These results update the thermal framework for hydrocarbon-maturation modelling in the Sichuan Basin and identify the southwestern volcanic province as a zone of elevated geothermal potential. Future research should extend the dataset to include deep-borehole temperature logs with continuous recording, and should incorporate twodimensional modelling to better constrain lateral heat transport near the Longmenshan margin.
Acknowledgement
Acknowledgements Funding SourcesSupported by departmental grants for geothermal research. Institutional SupportThe authors acknowledge the Department of Geography, Institute of Applied Geosciences, Bhubaneswar, Odisha, India, for laboratory facilities.
Figures and tables from the paper
| Formation | n (wells) | Gradient (°C/km) | λ (W/m·K) | q (mW/m²) |
|---|---|---|---|---|
| Triassic sandstone | 18 | 28.4 ± 3.2 | 2.41 ± 0.31 | 68.4 ± 8.7 |
| Jurassic carbonate | 18 | 32.7 ± 4.1 | 2.14 ± 0.28 | 69.9 ± 9.4 |
| Cretaceous shale | 18 | 24.8 ± 2.9 | 1.62 ± 0.22 | 40.2 ± 5.8 |
| Permian volcanic | 18 | 36.1 ± 5.3 | 2.17 ± 0.34 | 78.2 ± 12.1 |
Table text extracted from the original PDF; superscript letters are shown inline. The original table image is below.
View original table image
References
17 in the original paper- Allen PA, Allen JR. Basin analysis: principles and application to petroleum play assessment. 3rd ed. Oxford: Wiley-Blackwell; 2013. p. 1-619.
- Wang X, Li J, Chen D, Wang B. Formation mechanism of the Sichuan Basin. Science in China Series D. 2012;55(9):1560-1582.
- Jiang G, Gao P, Rao S, Zhang L, Tang X, Huang F, et al. Compilation of heat flow data in the continental area of China. Chinese Journal of Geophysics. 2016;59(8):2892-2910.
- Xu Z, Ji S, Li H, Hou L, Fu X, Cai Z. Uplift of the Longmenshan range and the Wenchuan earthquake. Acta Petrologica Sinica. 2008;24(10):2145-2152.
- Horner DR. Pressure build-up in wells. In: Proceedings of the Third World Petroleum Congress. The Hague; 1951. p. 503-523.
- Pollack HN, Hurter SJ, Johnson JR. Heat flow from the Earth's interior: analysis of the global data set. Reviews of Geophysics. 1993;31(3):267-280.
- Clauser C, Huenges E. Thermal conductivity of rocks and minerals. In: Rock physics and phase relations: a handbook of physical constants. Washington DC: American Geophysical Union; 1995. p. 105-126.
- Rao S, Jiang G, Gao P, Hu S, Tang X, Huang F, et al. Lithospheric thermal structure and Moho heat flow of the Sichuan Basin. Chinese Journal of Geophysics. 2018;61(9):3736-3750.
- Beardsmore GR, Cull JP. Crustal heat flow: a guide to measurement and modelling. Cambridge: Cambridge University Press; 2001. p. 1-324.
- Turcotte DL, Schubert G. Geodynamics. 3rd ed. Cambridge: Cambridge University Press; 2014. p. 1636.
- Hantschel T, Kauerauf AI. Fundamentals of basin and petroleum systems modeling. Berlin: Springer; 2009. p. 1-476.
- Lund JW, Toth AN. Direct utilization of geothermal energy: 2020 worldwide review. Geothermics. 2021;90:101915.
- Shi Y, Cao J. Lithosphere effective viscosity of continental China. Earth and Planetary Science Letters. 2008;274(3-4):410-421.
- Zhu C, Hu S, Qiu N, Rao S, Yuan Y. The thermal history of the Sichuan Basin, SW China. Tectonophysics. 2016;683:16-30.
- He L, Hu S, Huang S, Yang W, Wang J, Yuan Y, et al. Heat flow study at the Chinese Continental Scientific Drilling site. Tectonophysics. 2008;463(1-4):178-186.
- Xu Y, He H, Deng F, Zhu R, Wei G. Volumes of land erupted by the Emeishan large igneous province. Science in China Series D. 2004;47(12):1032-1040.
- Chapman DS. Thermal gradients in the continental crust. In: The nature of the lower continental crust. Geological Society Special Publication. 1986;24:63-70.