
Research article · 2026 · Full text
International Journal of Geography Geology and EnvironmentAQI fluctuations in Bihar: Reasons, effects and remedies
Volume 8(4) · Pages 89–92 · DOI: 10.22271/27067483.2026.v8.i4a.514 ↗
Research areasEnvironmental and Air Quality ManagementAir Quality and Health ImpactsAtmospheric chemistry and aerosols
Abstract
Author-writtenAir pollution is one of the most serious environmental challenges faced by developing countries today. In India, the problem is particularly severe in the Indo-Gangetic Plain, where meteorological and geographical conditions contribute to high pollution levels. Bihar, located in this region, frequently experiences significant fluctuations in the Air Quality Index (AQI). Cities such as Patna, Begusarai, and Muzaffarpur have recorded high AQI values during winter months, often falling into the “poor” and “very poor” categories. These fluctuations are influenced by meteorological conditions, vehicular emissions, construction activities, industrial pollution, biomass burning, and rapid urbanization. Poor air quality has severe consequences for public health, environmental sustainability, and economic productivity. This research article examines the causes of AQI fluctuations in Bihar, analyzes seasonal trends, and discusses the impacts on health and ecosystems. The study also evaluates existing government policies and proposes possible solutions for improving air quality in the state. The findings suggest that effective air pollution control requires coordinated efforts involving policy reforms, technological innovations, and public awareness. Sustainable transportation, stricter industrial regulation, and improved waste management can significantly reduce pollution levels in Bihar.
Summary
Source-checkedPlain-language reading of the full paper, prepared with AI and checked against the text. Each point links to the authors' own words.
Why it matters
- Air pollution represents a critical environmental challenge for developing nations. View evidence ↗
- The Indo-Gangetic Plain in India is especially affected by high pollution due to its specific geography and weather. View evidence ↗
- Bihar, situated within the Indo-Gangetic Plain, sees frequent changes in its Air Quality Index (AQI). View evidence ↗
The question
- The study aims to identify the causes of AQI fluctuations in Bihar, their societal and environmental impacts, and potential solutions. View evidence ↗
What they did
- The research utilizes secondary data from government reports, academic papers, news, and environmental databases. View evidence ↗
What they found
- Among the cities analyzed, Motihari had the highest AQI at 218, while Patna had the lowest at 130. View evidence ↗
- Seasonal average AQI peaks in winter at 250 and is lowest during the monsoon at 90. View evidence ↗
- Vehicular emissions are the largest contributor to pollution in urban Bihar at 30%, followed by construction dust at 20%. View evidence ↗
- The majority of cities in Bihar fall into the 'Moderate' AQI category (12 cities), while only one city is categorized as 'Good'. View evidence ↗
- Winter pollution is intensified by fog and temperature inversion, whereas monsoon rains help clear pollutants from the air. View evidence ↗
- Air pollution in the region is linked to severe health issues, including cardiovascular diseases, lung cancer, and respiratory conditions like asthma. View evidence ↗
What it means
- The authors conclude that pollution can be reduced by improving waste management, increasing green cover, promoting sustainable transport, and strengthening regulations. View evidence ↗
- The authors recommend an integrated approach combining public participation, technological innovation, and government regulation. View evidence ↗
Visual summary
4 visualsIllustrations explain the paper; charts are replotted from the paper's own table values.
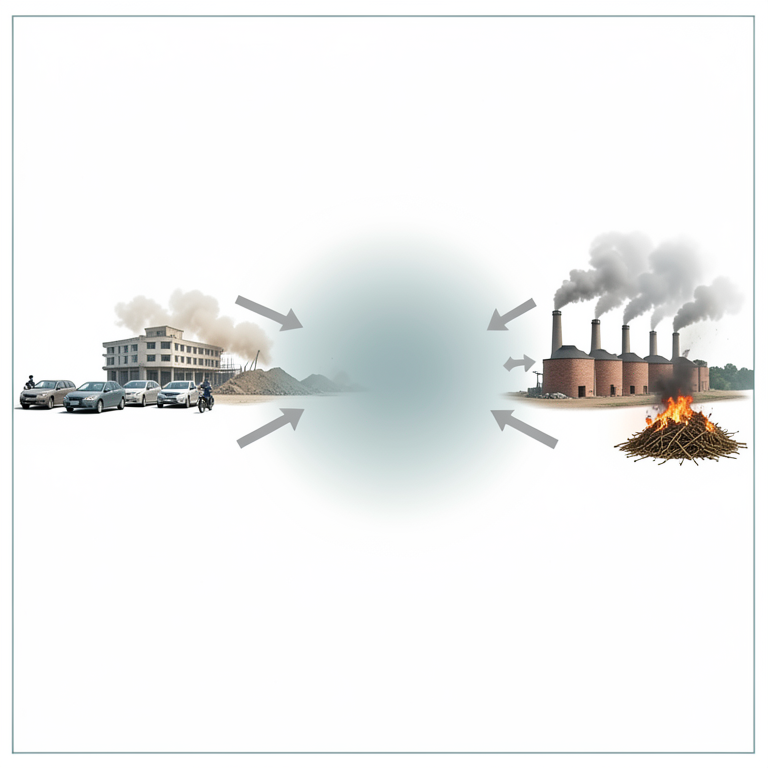
Pollution Source Distribution
AI-generated conceptual illustration (Urban landscape of Bihar, India, featuring vehicles, construction sites, brick kilns, and biomass fires). It explains the idea and does not show study data.
View source evidence ↗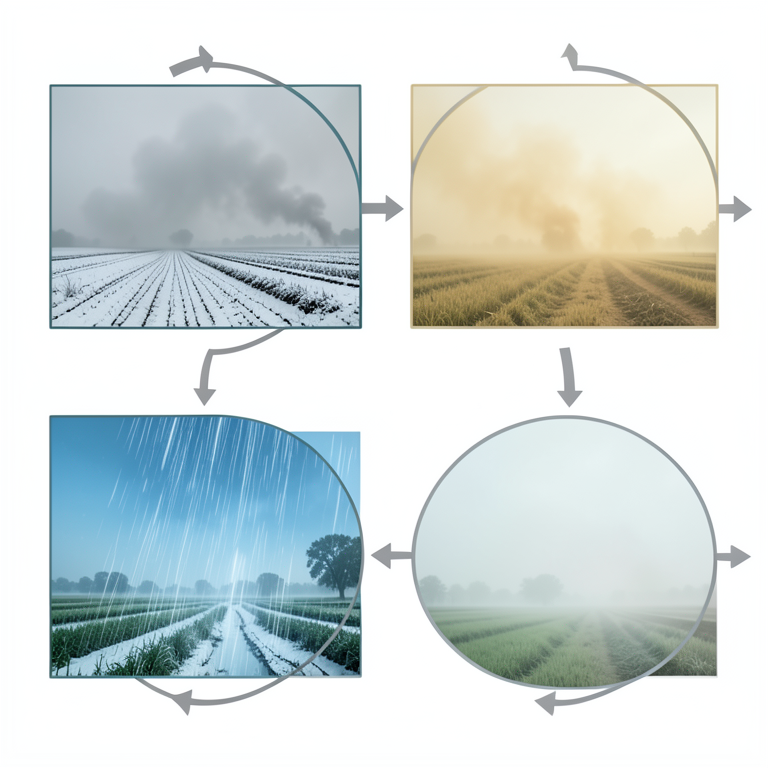
Seasonal AQI Cycle
AI-generated conceptual illustration (The atmosphere and landscape of Bihar, India). It explains the idea and does not show study data.
View source evidence ↗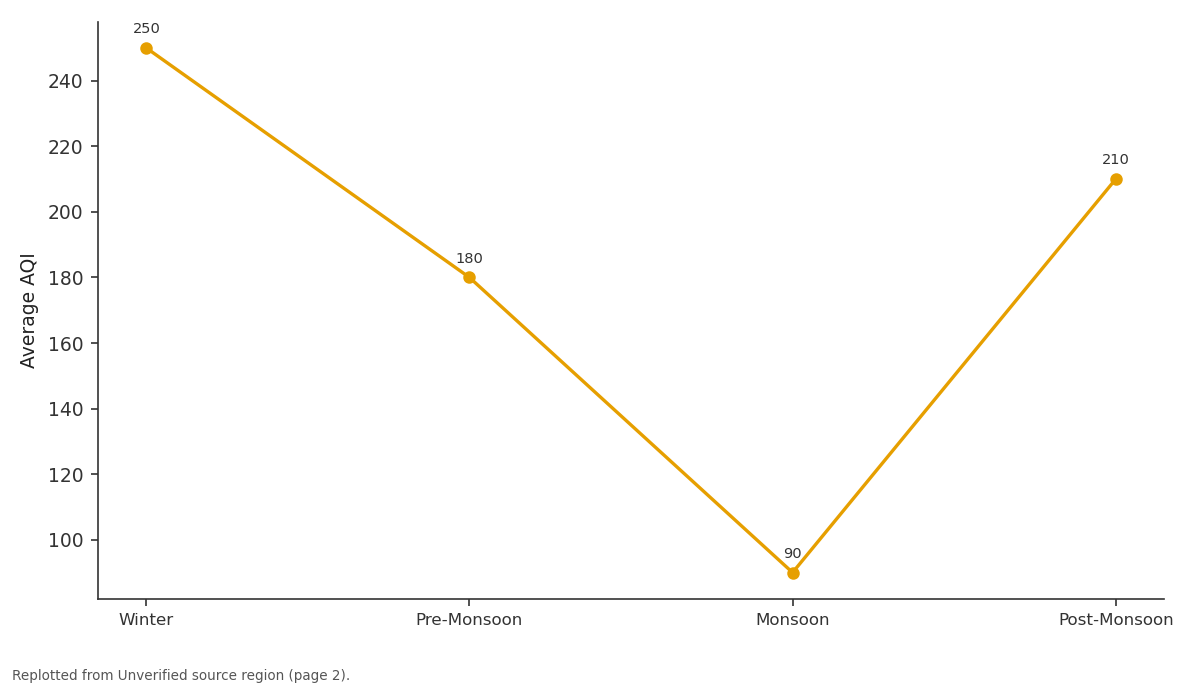
Average AQI: Winter vs Pre-Monsoon vs Monsoon vs Post-Monsoon
Replotted from a table (page 2) of the original paper. Every bar is the paper's own table value.
View source evidence ↗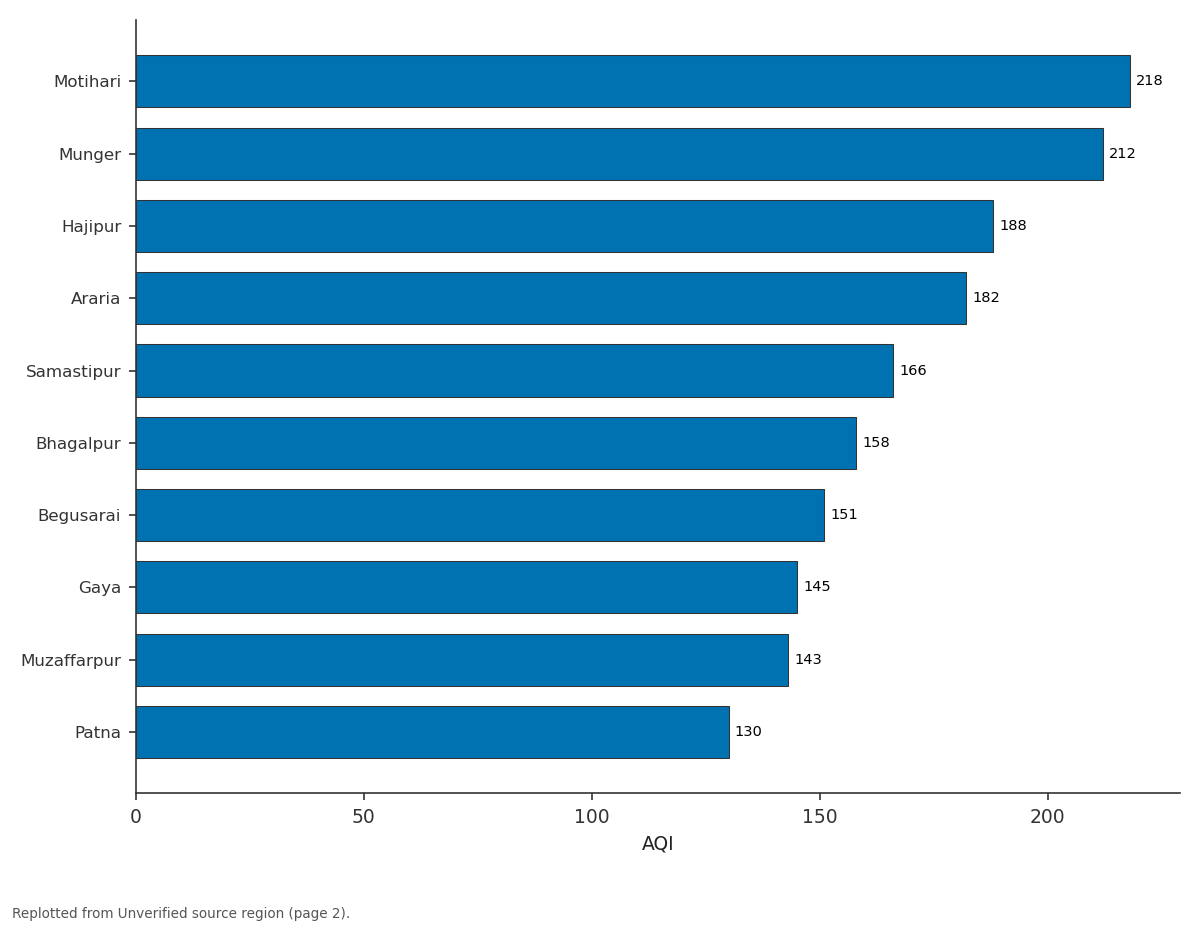
AQI: Motihari vs Munger vs Hajipur vs Araria vs Samastipur
Replotted from a table (page 2) of the original paper. Every bar is the paper's own table value.
View source evidence ↗Introduction
Air pollution is a major environmental issue that threatens human health and ecological balance. According to the World Health Organization (WHO), millions of premature deaths worldwide are associated with exposure to polluted air each year. The situation is particularly alarming in rapidly developing countries like India, where industrialization, urbanization, and population growth contribute significantly to air pollution. To assess and communicate the level of air pollution, environmental agencies use the Air Quality Index (AQI).
The AQI converts complex air pollution data into a single numerical value representing the level of health risk associated with air quality. The index is based on pollutants such as particulate matter (PM2.5 and PM10), nitrogen dioxide, sulfur dioxide, ozone, and carbon monoxide. Bihar, one of the most populous states in India, has been experiencing increasing levels of air pollution in recent years. Several cities in the state have reported AQI levels exceeding 300, indicating “very poor” air quality.
Such levels can cause severe respiratory and cardiovascular problems, particularly among vulnerable groups such as children, elderly individuals, and people with pre-existing health conditions. Air pollution in Bihar does not remain constant throughout the year; instead, it fluctuates due to seasonal variations, weather patterns, and human activities. For example, pollution levels tend to increase during winter months due to temperature inversion and stagnant atmospheric conditions that trap pollutants near the surface. This research article aims to analyze the reasons for AQI fluctuations in Bihar, examine their impacts on society and the environment, and suggest possible remedies to mitigate the problem.
Objectives of the Study The main objectives of this study are: 1. To analyze the causes of AQI fluctuations in Bihar. https://www.geojournal.net The Chart AQI Level 220 | █ Motihari 210 | █ Munger 190 | █ Hajipur 180 | █ Araria 170 | █ Samastipur 160 | █ Bhagalpur 150 | █ Begusarai 140 | █ Gaya 130 | █ Muzaffarpur 120 | █ Patna (Data compiled from Bihar pollution monitoring reports) Interpretation: Cities like Motihari and Munger fall in the poor AQI category. Most cities remain in moderate pollution range (100–200 AQI). Data Analysis The collected data were analyzed to identify Seasonal patterns in AQI levels Major sources of air pollution Health and environmental impacts Effectiveness of existing pollution control measure Seasonal AQI Fluctuation in Bihar Example average AQI pattern: 2.
To examine seasonal variations in air pollution levels. 3. To study the health and environmental impacts of poor air quality. 4. To evaluate government policies and pollution control measures. 5. To propose effective solutions for improving air quality in Bihar.
Literature review Several studies have examined the problem of air pollution in the Indo-Gangetic Plain region. According to the Central Pollution Control Board (CPCB), particulate matter (PM2.5 and PM10) is the dominant pollutant in northern Indian cities. High concentrations of particulate matter are associated with respiratory diseases, reduced lung function, and premature mortality. Research conducted by environmental scientists has shown that brick kilns and industrial emissions contribute significantly to air pollution in the Indo-Gangetic Plain.
Brick manufacturing alone accounts for approximately 8–14 percent of particulate pollution in the region. Another study conducted by the Asian Development Research Institute (ADRI) and Mahavir Cancer Sansthan highlighted the role of indoor air pollution in Bihar. The study found that prolonged exposure to smoke from biomass fuels increases the risk of lung cancer among non-smoking women in rural areas. Meteorological studies have also emphasized the role of temperature inversion and low wind speeds in trapping pollutants during winter months.
These atmospheric conditions prevent pollutants from dispersing into the upper layers of the atmosphere, resulting in smog formation. Overall, previous research indicates that air pollution in Bihar is caused by a combination of natural and human- induced factors. Research methodology This study is based on secondary data collected from various sources, including government reports, research papers, news articles, and environmental databases. Data Sources The data used in this study were obtained from: Central Pollution Control Board (CPCB) reports Bihar State Pollution Control Board (BSPCB) data Research publications on air pollution in the Indo- Gangetic Plain Reports from international organizations such as WHO News reports and environmental monitoring websites AQI of Major Cities in Bihar City AQI Motihari 218 Munger 212 Hajipur 188 Araria 182 Samastipur 166 Bhagalpur 158 Begusarai 151 Gaya 145 Muzaffarpur 143 Patna 130 Season Average AQI Winter 250 Pre-Monsoon 180 Monsoon 90 Post-Monsoon 210 Graph representation AQI 300 | * 250 | * Winter 200 | * Post-monsoon 150 | * 100 | * Monsoon 50 | Winter Pre-Monsoon Monsoon Post-Monsoon Interpretation: Winter shows highest AQI due to temperature inversion and fog.
Monsoon shows lowest AQI because rainfall removes pollutants from the air. The analysis focused primarily on urban areas in Bihar, particularly cities with high pollution levels such as Patna and Begusarai. Causes of AQI fluctuations in Bihar Meteorological Conditions: Weather conditions play a major role in determining air pollution levels.During winter months, temperature inversion occurs when a layer of warm air traps cooler air near the surface. This prevents pollutants from rising into the upper atmosphere and results in the accumulation of smog.
Low wind speeds and high humidity further worsen the situation by reducing the dispersion of pollutants. Vehicular Emissions: The rapid increase in the number of vehicles in Bihar has significantly contributed to air pollution. https://www.geojournal.net Emissions from vehicles release pollutants such as nitrogen oxides, carbon monoxide, and particulate matter. Traffic congestion in urban areas increases fuel consumption and emissions, further worsening air quality. Industrial Pollution and Brick Kilns: Industrial activities and brick kilns are major sources of pollution in the Indo- Gangetic Plain.
Brick kilns burn coal and other fuels, releasing large quantities of smoke and particulate matter into the atmosphere. Many of these kilns operate with outdated technology and lack proper pollution control mechanisms. Construction Activities and Road Dust: Rapid urbanization has led to increased construction activities across Bihar. Dust from construction sites, unpaved roads, and transportation of building materials contributes significantly to particulate pollution.
Biomass Burning: In rural areas of Bihar, many households rely on biomass fuels such as firewood, crop residues, and cow dung for cooking. Burning these fuels releases harmful pollutants that contribute to both indoor and outdoor air pollution. Seasonal variation in AQI Winter Season: Winter months record the highest pollution levels due to temperature inversion, fog, and low wind speeds. Summer Season: Higher temperatures and stronger winds help disperse pollutants, resulting in relatively better air quality.
Monsoon Season: Rainfall during the monsoon washes pollutants out of the atmosphere, significantly improving air quality. Sources of air pollution in Bihar Approximate contribution of pollution sources: Source Percentage Vehicular Emissions 30% Construction Dust 20% Brick Kilns & Industry 18% Biomass Burning 17% Road Dust 10% Other Sources 5% Interpretation: Transport emissions are the largest pollution source in urban Bihar. Brick kilns and biomass burning are also major contributors. Cities of Bihar showing AQI hotspots Most AQI Hotspot Cities: Patna, Begusarai, Samastipur, Muzaffarpur, Munger, Motihari, Bhagalpur Explanation of the Hotspots: The spatial distribution of air pollution in Bihar indicates that most urban centers located along the Ganga basin and major transport corridors experience higher AQI levels.
Cities such as Begusarai, Patna, and Samastipur frequently record AQI levels above 200, indicating poor air quality and increased health risks. AQI Category Distribution in Bihar Cities AQI CategoryNumber of Cities Visualization Moderate████████████ Poor ████ Satisfactory ██ Very Poor █ Good █ Interpretation: Most cities in Bihar fall under moderate to poor AQI categories, showing persistent pollution levels. Effects of AQI Fluctuations Health Impacts: Exposure to polluted air can cause numerous health problems, including: Asthma and bronchitis, Lung cancer, cardiovascular diseases, reduced lung function etc Children and elderly individuals are particularly vulnerable to air pollution. Environmental Impacts:Air pollution affects ecosystems in several ways,like damage to crops and vegetation, reduced visibility due to smog, soil contamination, contribution to climate change.
Economic Impacts:Poor air quality can also affect economic productivity by increasing healthcare costs and reducing workforce efficiency. Environmental degradation may also affect agriculture, which is the primary livelihood for many people in Bihar. Government policies and initiatives National Clean Air Programme (NCAP): The NCAP aims to reduce particulate pollution in major cities by improving air quality monitoring and enforcing stricter emission standards. Pollution Monitoring: The Bihar State Pollution Control Board monitors AQI levels across multiple districts and identifies pollution hotspots.
Urban Pollution Control Measures: Authorities have implemented several measures including: water sprinkling on roads, regulation of construction activities, monitoring of industrial emissions Remedies and solutions Sustainable Transportation: Promoting public transportation, electric vehicles, and cycling can significantly reduce vehicular emissions. Cleaner Industrial Technologies: Industries and brick kilns should adopt cleaner technologies and comply with emission standards. Waste Management: Proper waste management systems should be implemented to prevent open burning of garbage. Increasing Green Cover: Planting trees and developing urban forests can help absorb pollutants and improve air quality.
Public Awareness: Public awareness campaigns can encourage people to adopt environmentally friendly practices such as using clean cooking fuels and reducing vehicle usage.
Discussion
The analysis indicates that AQI fluctuations in Bihar are influenced by both natural and human-induced factors. Meteorological conditions such as temperature inversion amplify the effects of pollution generated by human activities. Urbanization and population growth have increased the demand for transportation, housing, and energy, leading to higher pollution levels. At the same time, traditional practices such as biomass burning continue to contribute to Good 1 Satisfactory 2 Moderate 12 Poor 4 Very Poor 1 https://www.geojournal.net air pollution in rural areas.
Effective pollution control requires an integrated approach that combines government regulation, technological innovation, and public participation.
Conclusion
Air pollution is a serious environmental and public health challenge in Bihar. AQI fluctuations in the state are influenced by meteorological conditions, vehicular emissions, industrial activities, construction dust, and biomass burning. Seasonal variations, particularly during winter months, intensify pollution levels due to temperature inversion and stagnant atmospheric conditions. Addressing this issue requires coordinated efforts from government agencies, industries, and citizens.
Strengthening environmental regulations, promoting sustainable transportation, improving waste management, and increasing green cover can significantly reduce pollution levels. With effective implementation of these measures, Bihar can improve its air quality and ensure a healthier environment for future generations.
References
7 in the original paper- Central Pollution Control Board. National air quality index report. New Delhi: Government of India; 2023.
- World Health Organization. Air pollution and health. Geneva: WHO; 2022.
- Asian Development Research Institute. Study on indoor air pollution in Bihar. 2023.
- Mondal A, et al. Brick kiln emissions and air pollution in the Indo-Gangetic Plain. Environ Res. 2024.
- Bihar State Pollution Control Board. Air quality monitoring report. 2024.
- The Economic Times. Many Bihar cities record AQI above 300. 2023.
- The Times of India. Geographical barriers and local factors add to rising pollution in Bihar. 2024.