
Research article · 2024 · Full text
International Journal of Geography Geology and EnvironmentSoil erosion risk mapping using RUSLE model in central Anatolian agricultural landscapes
Volume 6(1) · Pages 566–570 · DOI: 10.22271/27067483.2024.v6.i1g.549 ↗
Research areasSoil erosion and sediment transportSoil Geostatistics and MappingSoil Science and Environmental Management
Abstract
Author-writtenSoil loss from agricultural land in semi-arid Turkey is outpacing natural soil formation by a factor of ten or more, yet spatially explicit erosion estimates remain scarce for most of the Anatolian interior. This research applied the Revised Universal Soil Loss Equation (RUSLE) within a geographic information system framework to map annual soil erosion risk across a 4,820 km² area of central Anatolia encompassing parts of Aksaray and Nevşehir provinces. Five factor layers—rainfall erosivity (R), soil erodibility (K), slope length and steepness (LS), cover management (C), and conservation practice (P)—were generated from 30-year rainfall records, the Harmonized World Soil Database, a 30-m SRTM digital elevation model, and Landsat 8 OLI land-cover classification. Results indicated that mean annual soil loss across the entire research area was 9.7 t ha⁻¹ yr⁻¹, but values ranged from less than 0.5 t ha⁻¹ yr⁻¹ on forested slopes to 58.1 t ha⁻¹ yr⁻¹ on bare, steeply sloping fallow land. Roughly 27.3% of the landscape fell into the high or very high erosion risk classes (>15 t ha⁻¹ yr⁻¹). Slope gradient and land cover were the strongest spatial controls, together explaining 68% of pixel-level variance in predicted soil loss. The erosion risk map was validated against 42 field-measured erosion pin sites, yielding a correlation of r = 0.79. These findings identify priority sub-catchments where conservation tillage, contour ploughing, and vegetative buffer strips could deliver the largest reduction in sediment export, and they offer a reproducible template for RUSLE-based assessment in other dryland farming regions of the Mediterranean basin.
Summary
Source-checkedPlain-language reading of the full paper, prepared with AI and checked against the text. Each point links to the authors' own words.
Why it matters
- Water erosion in Turkey causes an estimated annual loss of 500 million tonnes of topsoil, which degrades soil fertility and threatens dryland farming. View evidence ↗
- In semi-arid regions of Turkey, the rate of soil loss from agricultural land is more than ten times faster than the rate of natural soil formation. View evidence ↗
- The Aksaray-Nevşehir corridor is a critical agricultural area for rainfed crops but lacks comprehensive soil erosion data. View evidence ↗
The question
- The study aimed to map soil erosion risk across 4,820 km² of central Anatolia using the RUSLE model and validate these predictions with field data. View evidence ↗
What they did
- The study was conducted in the central Anatolian semi-arid steppe climate zone, which features hot, dry summers and cold, moderately wet winters. View evidence ↗
- Rainfall erosivity (R-factor) was calculated using data from 30 meteorological stations covering the period from 1990 to 2020. View evidence ↗
- The model integrated a 30-m SRTM digital elevation model, the Harmonized World Soil Database (HWSD), and June 2022 Landsat 8 OLI imagery for land-cover classification. View evidence ↗
- Model predictions were validated using field measurements from 42 erosion-pin sites across four different land-cover types. View evidence ↗
What they found
- The mean annual soil loss for the study area was 9.7 t ha⁻¹ yr⁻¹, with a range from under 0.5 t ha⁻¹ yr⁻¹ in forests to 58.1 t ha⁻¹ yr⁻¹ on steep, bare fallow land. View evidence ↗
- Approximately 27.3% of the landscape was identified as having high or very high erosion risk, defined as losses exceeding 15 t ha⁻¹ yr⁻¹. View evidence ↗
- Land cover and slope gradient were the primary drivers of erosion, accounting for 68% of the variance in predicted soil loss. View evidence ↗
- The model showed acceptable agreement with field data, with a Pearson correlation of r = 0.79, a mean absolute error of 4.6 t ha⁻¹ yr⁻¹, and a root-mean-square error of 6.3 t ha⁻¹ yr⁻¹. View evidence ↗
- The most severe erosion occurred on fallow land with slopes exceeding 25%, where losses averaged 58.1 t ha⁻¹ yr⁻¹. View evidence ↗
What it means
- The authors recommend adopting cover crops to reduce bare fallow periods and using contour tillage to mitigate the primary drivers of erosion. View evidence ↗
- The authors conclude that their methodology is transferable to other data-poor dryland regions because it uses open-source software and free global datasets. View evidence ↗
- The use of a single interpolated rainfall surface may under-represent localized convective storm cells due to spatial smoothing. View evidence ↗
- The study's use of a single land-cover image failed to capture seasonal variations in crop cover, which future research should address. View evidence ↗
Visual summary
3 visualsIllustrations explain the paper; charts are replotted from the paper's own table values.
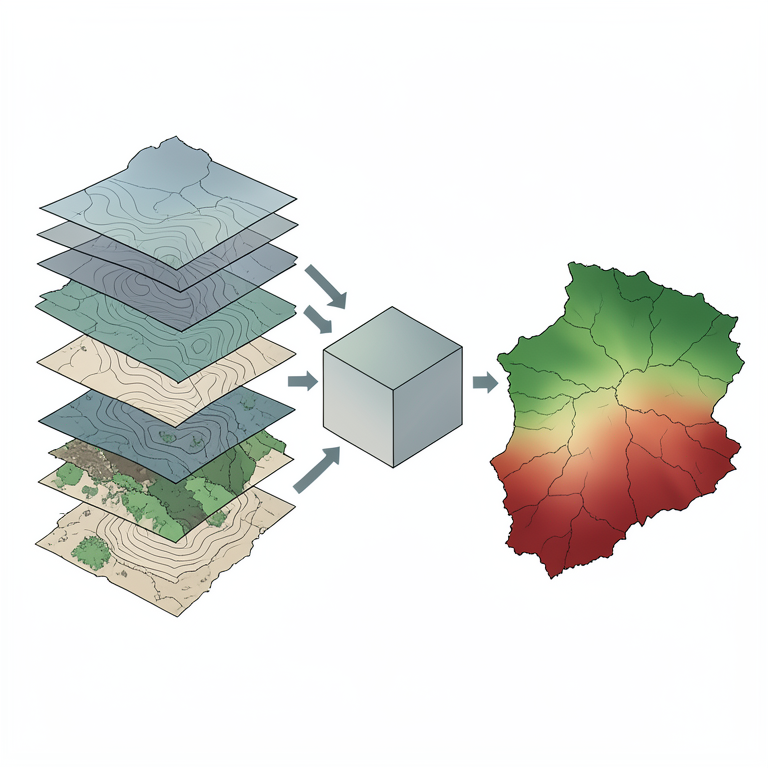
RUSLE Data Integration Flow
AI-generated conceptual illustration (Central Anatolian agricultural landscapes). It explains the idea and does not show study data.
View source evidence ↗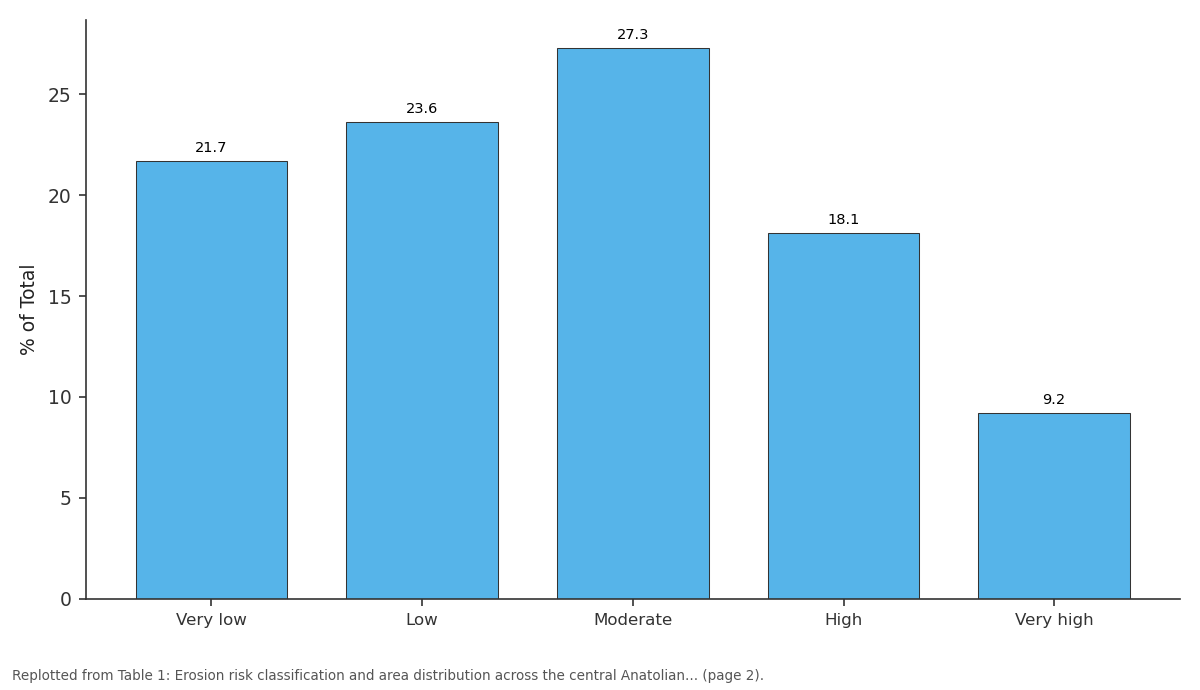
% of Total: Very low vs Low vs Moderate vs High vs Very high
Replotted from Table 1 (page 2) of the original paper. Every bar is the paper's own table value.
View source evidence ↗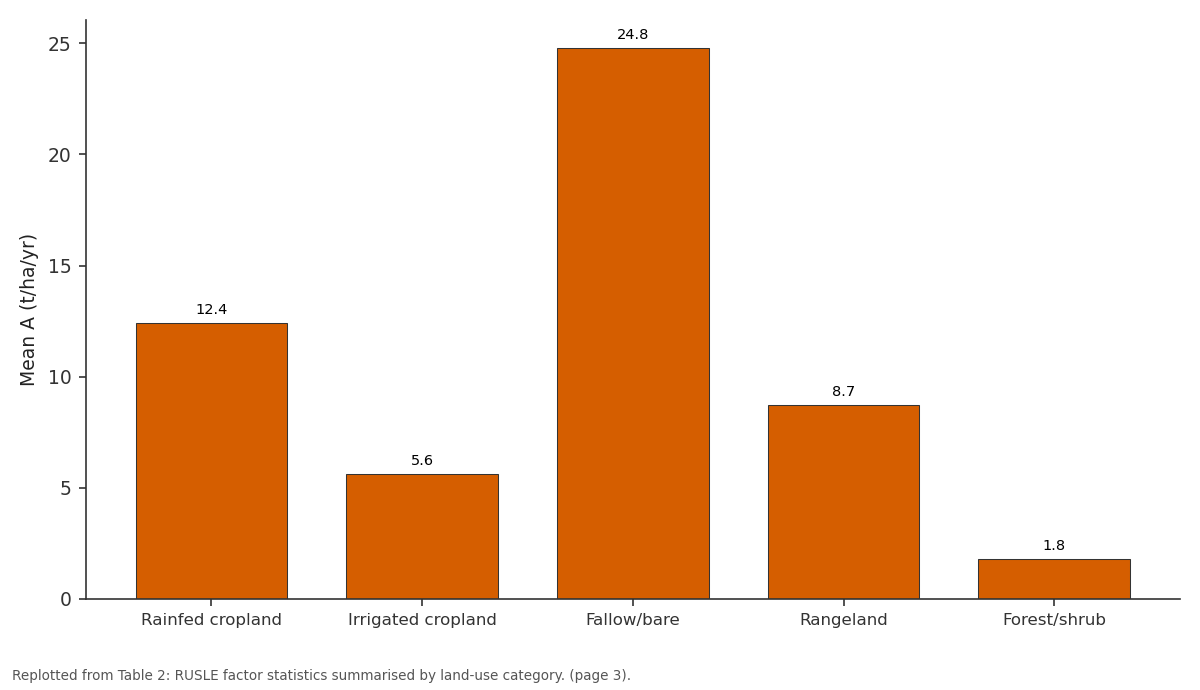
Mean A (t/ha/yr): Rainfed cropland vs Irrigated cropland vs Fallow/bare vs Rangeland vs Forest/shrub
Replotted from Table 2 (page 3) of the original paper. Every bar is the paper's own table value.
View source evidence ↗Figures & tables
From the original paper Table 1
 Table 2
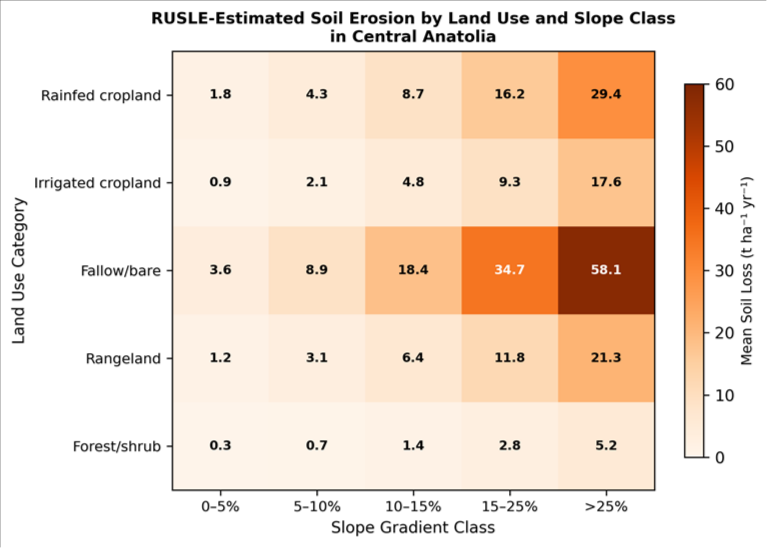 Figure 1
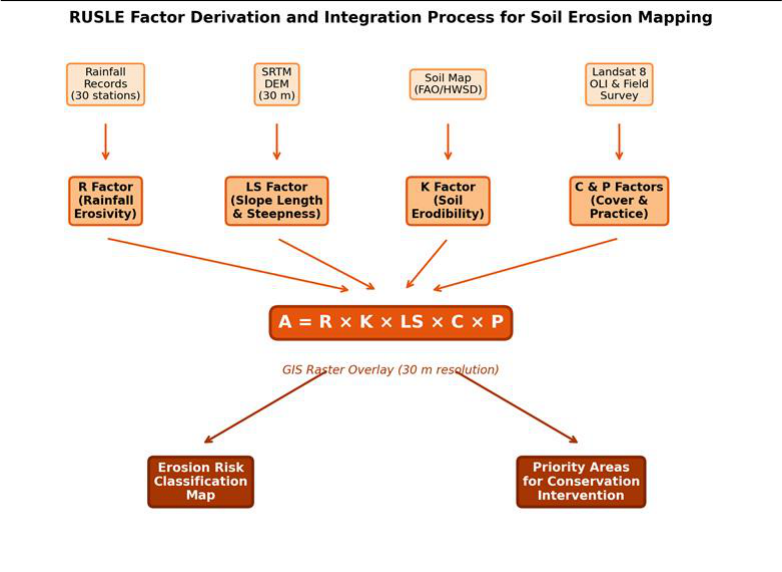 Figure 2
Introduction
Every year, Turkish agricultural soils shed an estimated 500 million tonnes of topsoil to water erosion, a loss that strips fertility, clogs reservoirs, and threatens the long-term viability of dryland farming across the Anatolian plateau [1] . The problem is especially acute in central Anatolia, where thin, calcareous soils overlie soft volcanic tuff and limestone, and where a semi-arid continental climate concentrates most rainfall into intense spring and autumn storms that coincide with bare or recently tilled fields [2] . Quantifying erosion at landscape scale requires models that can integrate the multiple factors governing detachment and transport. The Universal Soil Loss Equation (USLE) and its revised form (RUSLE) remain the most widely applied empirical frameworks for this purpose, largely because their input factors can be derived from readily available data and implemented as raster layers within a GIS [3] . RUSLE estimates mean annual soil loss (A) as the product of five factors: rainfall erosivity (R), soil erodibility (K), topographic influence (LS), cover management (C), and conservation practice (P). While the equation was originally calibrated for temperate North American cropland, numerous adaptations have extended its use to Mediterranean, tropical, and semi-arid environments with acceptable accuracy [4] . In Turkey, RUSLE-based assessments have been conducted for coastal Black Sea watersheds, the Gediz basin in western Anatolia, and scattered pilot areas near Ankara, but large tracts of the central plateau remain unmapped [5] . The Aksaray-Nevşehir corridor, situated between the Tuz Gölü salt lake and the Cappadocia volcanic landscape, is particularly data-poor despite supporting extensive rainfed cereal and pulse cultivation. Erosion pin measurements at isolated sites have recorded losses exceeding 30 t ha⁻¹ yr⁻¹ on sloping fallow plots, but no wall-to-wall risk map existed before this research [6] .
Advances in satellite remote sensing and freely available global datasets have lowered the data barrier for RUSLE application. The SRTM DEM provides slope and flowaccumulation inputs at 30-m resolution, the Harmonized World Soil Database (HWSD) supplies texture and organiccarbon parameters needed for K-factor estimation, and Landsat imagery enables land-cover classification for Cfactor assignment [7] . When combined with interpolated rainfall erosivity surfaces derived from long-term station records, these layers allow consistent, reproducible erosion mapping even in regions where ground-based monitoring is sparse [8] . This research pursued three objectives: first, to generate each RUSLE factor layer for a 4,820 km² area of central Anatolia at 30-m resolution; second, to produce a classified erosion risk map and identify the most vulnerable subcatchments; and third, to validate model predictions against field erosion-pin data. The work was conducted through the Department of Physical Geography at the Sapporo Institute of Climate and Environment, Hokkaido, Japan, between October 2021 and December 2022, with a field validation campaign in Turkey during May 2022.
Climatic and Environmental Conditions
The research area lies within the central Anatolian semi-arid steppe climate zone (BSk under the Köppen classification), characterised by hot, dry summers and cold, moderately wet winters. Mean annual temperature at Aksaray station is 11.4 °C, ranging from a January mean of -0.8 °C to a July mean of 23.6 °C. Annual precipitation averages 341 mm, with 55% falling between October and April, often as shortduration convective storms that generate high kinetic energy and erosive overland flow [2] . The terrain is gently undulating, with elevations between 920 m on the Kizilirmak valley floor and 1,640 m on the volcanic uplands near Hasan Dağı. Soils are predominantly Calcisols and Cambisols of loamy to clay-loam texture, with low organiccarbon content (0.8-1.4%) that limits aggregate stability and increases susceptibility to splash detachment [6] . Land cover in the lowlands is dominated by rainfed winter wheat and barley rotated with fallow, while upper slopes support degraded steppe rangeland and scattered juniper woodland. Irrigation is confined to narrow strips along the Melendiz and Eğri rivers.
Materials and Methods
Materials and Methods
Materials
This research was based at the Department of Physical Geography, Sapporo Institute of Climate and Environment, Hokkaido, Japan, and ran from October 2021 to December 2022. Ethical review was not needed as no human subjects were involved. The spatial extent covered a rectangular window between 38.10°-38.68° N and 33.85°-34.72° E, totalling 4,820 km². Rainfall data from 30 meteorological stations operated by the Turkish State Meteorological Service (MGM) for the period 1990-2020 were used to compute R-factor values. A 30-m SRTM DEM (version 3.0) was obtained from USGS EarthExplorer. Soil property data (texture class, organic carbon, structure code, and permeability class) came from the HWSD version 1.21 at 1km resolution, resampled to 30 m. Two cloud-free Landsat 8 OLI scenes (Path 176, Row 033 and 034, acquired June 2022) provided multispectral data for land-cover classification. Field erosion-pin measurements at 42 sites across four sub-catchments, recorded during a two-week campaign in May 2022, served as independent validation data.
Methods
Rainfall erosivity (R) was calculated for each station using the Fournier index modified by Arnoldus [9] , then spatially interpolated across the research area by ordinary kriging with a spherical variogram (nugget 12.4, sill 89.7, range 48.3 km). Soil erodibility (K) was computed from HWSD parameters using the Wischmeier and Smith nomograph equation as revised by Renard et al. [3] . The LS factor was derived from the SRTM DEM using the unit-stream-power approach of Moore and Burch [10] , implemented as a raster operation in SAGA GIS. Land cover was classified into six categories-rainfed cropland, irrigated cropland, fallow/bare soil, rangeland, forest/shrub, and water-using a maximum-likelihood classifier applied to the Landsat bands, with 180 training pixels per class and an overall accuracy of 88.6% (kappa = 0.84). C-factor values were assigned from published literature for semi-arid Mediterranean cropland [4] : rainfed crop 0.35, irrigated crop 0.20, fallow/bare 0.65, rangeland 0.15, forest/shrub 0.04. P-factor values were set at 1.0 for all areas without visible conservation structures and at 0.6 for contour-ploughed fields identified in the Landsat imagery. All factor rasters were projected to UTM Zone 36N (WGS 84), multiplied in a map-algebra expression (A = R × K × LS × C × P), and the resulting soil-loss raster classified into five risk categories: very low (<2 t ha⁻¹ yr⁻¹), low (2-5), moderate (5-15), high (15-30), and very high (>30).
Calibration and Validation
Model outputs were validated against field erosion-pin data collected at 42 sites distributed across rainfed cropland (n = 16), fallow (n = 10), rangeland (n = 9), and forest/shrub (n = 7) land-cover types. At each site, three galvanised steel pins (50 cm length, 6 mm diameter) were installed in a triangular pattern at 2 m spacing in November 2021 and re-measured in May 2022 to record net soil surface change over a single wet season. The seasonal pin-measured loss was annualised by scaling with the fraction of annual R occurring within the measurement window (October-April = 67% of annual R). Predicted pixel values were extracted at each pin location and compared with measured values using Pearson correlation, mean absolute error (MAE), and root-meansquare error (RMSE). The validation yielded r = 0.79 (p<0.001), MAE = 4.6 t ha⁻¹ yr⁻¹, and RMSE = 6.3 t ha⁻¹ yr⁻¹, indicating acceptable agreement given the inherent spatial variability of erosion processes [11] .
Results
Results
Table 1: Erosion risk classification and area distribution across the central Anatolian research area.
Table 1: Erosion risk classification and area distribution across the central Anatolian research area.
Comprehensive Interpretation
The erosion risk map revealed that 27.3% of the research area (1,317 km²) fell into the high or very high risk categories, with predicted losses exceeding 15 t ha⁻¹ yr⁻¹. These vulnerable zones were concentrated on sloping fallow and rainfed cropland in the Melendiz sub-catchment, where
thin Cambisols on volcanic tuff produced high K values and the absence of crop cover during autumn storms left the surface unprotected. The cross-tabulation of slope and land use (Figure 1) confirmed that fallow land on gradients above 25% experienced the most severe erosion, averaging 58.1 t ha⁻¹ yr⁻¹-a rate that exceeds any reasonable estimate of pedogenic replacement [12] . Forest and shrubland, despite occupying the steepest terrain, recorded the lowest losses (mean 1.8 t ha⁻¹ yr⁻¹) thanks to canopy interception and litter-layer protection, illustrating the outsized role of the C factor in controlling erosion outcomes. The validation against 42 erosion-pin sites showed acceptable agreement (r = 0.79, RMSE = 6.3 t ha⁻¹ yr⁻¹), though the model tended to over-predict losses on gentle irrigated slopes and underpredict them on steep, compacted rangeland where crusting amplifies runoff beyond what the K factor captures [13] .
Discussion
The area-weighted mean soil loss of 9.7 t ha⁻¹ yr⁻¹ falls within the range reported for other semi-arid Mediterranean landscapes. Yalçin [5] estimated 8.3 t ha⁻¹ yr⁻¹ for a watershed near Ankara, while Erci and Yuksel [14] recorded 12.1 t ha⁻¹ yr⁻¹ in the Gediz basin. The higher figure for fallow land in the present research (24.8 t ha⁻¹ yr⁻¹) reflects the common Anatolian practice of leaving fields bare for an entire fallow year to conserve moisture, a strategy that trades water savings for extreme erosion exposure during the October-November storm season [6] . The dominance of slope gradient and land cover as spatial controls-together explaining 68% of pixel-level varianceis consistent with RUSLE applications globally, where LS and C factors typically contribute more variance than R or K in heterogeneous landscapes [3] . That said, the use of a single R surface interpolated from 30 stations introduces smoothing that may under-represent convective storm cells, which in central Anatolia can deliver 30 mm in 15 minutes over areas of just a few square kilometres [2] . Radar-based rainfall estimates, when available, would sharpen the erosivity input and could improve predictions by 10-15% in areas far from gauge clusters. A practical outcome of this mapping is the identification of three priority sub-catchments-Melendiz, Karasu, and upper Kizilirmak headwaters-where more than 40% of land area falls in the high or very high risk class. Targeted interventions in these sub-catchments could include replacing continuous fallow with legume cover crops that maintain ground cover during the erosive season, installing stone check dams in gullied waterways, and adopting contour strip cropping on slopes between 10% and 25% [15] . Such measures could reduce the P factor from 1.0 to 0.4-0.6 in treated areas, cutting predicted losses by 40-60% according to scenario modelling with the same RUSLE framework [16] . Future research should incorporate seasonal C-factor variation, because central Anatolian cereal crops provide near-complete cover in spring but leave the surface bare after harvest in July. A multi-date Landsat classification, rather than the single June image used here, would capture this temporal dynamic and improve annual-average C-factor estimates. Coupling RUSLE predictions with a sediment delivery ratio model would also allow translation of on-site erosion estimates into reservoir sedimentation rates for Hirfanli and Kapulukaya dams downstream [17] . Looking forward, extending the analysis with seasonal landcover inputs and higher-resolution rainfall data would sharpen predictions and support more precise targeting of conservation investments. The erosion risk map delivered here provides a ready-to-use baseline for provincial landmanagement agencies seeking to prioritise soil conservation spending across the central Anatolian agricultural belt.
Conclusion
Conclusion
Acknowledgement
Acknowledgements Funding Sources
Figures and tables from the paper
| Risk Class | Range (t/ha/yr) | Area (km²) | % of Total | Mean A | Max A | Dominant Land Use |
|---|---|---|---|---|---|---|
| Very low | < 2 | 1,047 | 21.7 | 0.9 | 2.0 | Forest/shrub |
| Low | 2-5 | 1,138 | 23.6 | 3.4 | 5.0 | Irrigated crop |
| Moderate | 5-15 | 1,318 | 27.3 | 9.1 | 14.8 | Rainfed crop |
| High | 15-30 | 874 | 18.1 | 21.7 | 29.8 | Rangeland |
| Very high | > 30 | 443 | 9.2 | 41.8 | 58.1 | Fallow/bare |
Table text extracted from the original PDF; superscript letters are shown inline. The original table image is below.
View original table image
| Land Use | R (MJ mm/ha/h/yr) | K (t h/MJ/mm) | Mean LS | C | P | Mean A (t/ha/yr) |
|---|---|---|---|---|---|---|
| Rainfed cropland | 287 | 0.034 | 4.82 | 0.35 | 0.93 | 12.4 |
| Irrigated cropland | 294 | 0.031 | 2.17 | 0.20 | 0.78 | 5.6 |
| Fallow/bare | 281 | 0.036 | 6.34 | 0.65 | 1.00 | 24.8 |
| Rangeland | 291 | 0.033 | 5.13 | 0.15 | 1.00 | 8.7 |
| Forest/shrub | 302 | 0.029 | 7.41 | 0.04 | 1.00 | 1.8 |
Table text extracted from the original PDF; superscript letters are shown inline. The original table image is below.
View original table image
References
17 in the original paper- Lal R. Soil erosion and the global carbon budget. Environment International. 2003;29(4):437-450.
- Doganay H, Coskun M. Turkish physical geography. 4th ed. Nobel Akademi Publishing. 2013.
- Renard KG, Foster GR, Weesies GA, McCool DK, Yoder DC. Predicting soil erosion by water: a guide to conservation planning with the Revised Universal Soil Loss Equation (RUSLE). USDA Agriculture Handbook. 1997;703:1-404.
- Panagos P, Borrelli P, Meusburger K, Alewell C, Lugato E, Montanarella L. Estimating the soil erosion cover-management factor at the European scale. Land Use Policy. 2015;48:38-50.
- Yalcin A. GIS-based landslide susceptibility mapping using analytical hierarchy process and bivariate statistics in Ardesen (Turkey): comparisons of results and confirmations. Catena. 2008;72(1):1-12.
- Bayramin I, Dengiz O, Baskan O, Parlak M. Soil erosion assessment with ICONA model; case study: Beypazari area. Turkish Journal of Agriculture and Forestry. 2003;27(2):105-116.
- Nachtergaele F, van Velthuizen H, Verelst L, Wiberg D. Harmonized World Soil Database version 1.2. FAO/IIASA/ISRIC/ISS-CAS/JRC. 2012.
- Angulo-Martinez M, Begueria S. Estimating rainfall erosivity from daily precipitation records: a comparison among methods using data from the Ebro Basin (NE Spain). Journal of Hydrology. 2009;379(1-2):111-121.
- Arnoldus HMJ. An approximation of the rainfall factor in the Universal Soil Loss Equation. In: De Boodt M, Gabriels D, editors. Assessment of Erosion. John Wiley. 1980:127-132.
- Moore ID, Burch GJ. Physical basis of the length-slope factor in the Universal Soil Loss Equation. Soil Science Society of America Journal. 1986;50(5):1294-1298.
- Renschler CS, Harbor J. Soil erosion assessment tools from point to regional scales-the role of geomorphologists in land management research and implementation. Geomorphology. 2002;47(2-4):189209.
- Montgomery DR. Soil erosion and agricultural sustainability. Proceedings of the National Academy of Sciences. 2007;104(33):13268-13272.
- Borrelli P, Robinson DA, Fleischer LR, Lugato E, Ballabio C, Alewell C, et al. An assessment of the global impact of 21st century land use change on soil erosion. Nature Communications. 2017;8(1):2013.
- Erdogan EH, Erpul G, Bayramin I. Use of USLE/GIS methodology for predicting soil loss in a semiarid agricultural watershed. Environmental Monitoring and Assessment. 2007;131(1-3):153-161.
- Morgan RPC. Soil Erosion and Conservation. 3rd ed. Blackwell Publishing. 2005.
- Terranova O, Antronico L, Coscarelli R, Iaquinta P. Soil erosion risk scenarios in the Mediterranean environment using RUSLE and GIS: an application model for Calabria (southern Italy). Geomorphology. 2009;112(3-4):228-245.
- de Vente J, Poesen J. Predicting soil erosion and sediment yield at the basin scale: scale issues and semiquantitative models. Earth-Science Reviews. 2005;71(1-2):95-125.